

By:
General introduction to elements-at-risk
Assets - or elements at risk - is a generic term that signifies everything that might be exposed to hazards, ranging from buildings to the economy and from individual persons to communities. It is because of the interference with things we care about that we consider hazards as problems. In areas without assets, hazards are not considered as a problem. The more assets are exposed the more problematic we find the hazard. All assets have a "value", which can be expressed in monetary terms, in number of persons affected or in less quantifiable units such as cultural importance or environmental quality. Assets can be identifyable objects such as persons, buildings, cars, etc. but also include systems and services such as a community, utilities and the economy. Some of the assets remain fixed in space (they have a specified location, e.g. buildings and infrastructure), others are dynamic and vary in time and in space (people, cars, etc). Assets can be affected directly by the hazard (a house is flooded, a person is injured by a landslide) or indirectly because services are interupted, roads are blocked and factories are closed.
It is therefore important to have a good inventory of the assets in a given area, what is where and what services are being provided: what buildings are there, how many people live and work there " and how do they move " and what are the essential facilities (lifelines, services and emergency response units). It is also important to map locations of special interest such as cultural heritage sites, factories with dangerous materials and potential high-loss facilities such as schools, hospitals and retirement homes.
Elements at risk is about exposure to the hazard. What is there that can be damaged or destroyed, injured or killed, hampered or interupted. The degree to which this is effectuated depends on the intensity of the hazard (how "bad" is the flood or how big is the landslide) and the intrinsic quality of each element at risk to suffer loss due that particular hazard with that particular intensity. This intrinsic quality is called the "vulnerability" which is described in more detail in section 5.3.
The definition of elements-at risk
All objects, persons, animals, activities and processes that may be adversely affected by hazardous phenomena, in a particular area, either directly or indirectly. This includes: buildings, facilities, population, livestock, economic activities, public services, environment.
Generalclassification of elements at risk
There are many different types of elements at risk, and also many different ways to classify them. The table below gives an example of such a classification.
|
Physical elements Buildings: Urban land use, construction types, building height, building age, total floor space, replacement costs. Monuments and cultural heritage |
Population Density of population, distribution in space, distribution in time, age distribution, gender distribution, handicapped, income distribution |
|
Essential facilities Emergency shelters, Schools, Hospitals, Fire Brigades, Police, |
Socio-economic aspects Organization of population, governance, community organization, government support, socio-economic levels. Cultural heritage and traditions. |
|
Transportation facilities Roads, railway, metro, public transportation systems, harbor facilities, airport facilities. |
Economic activities Spatial distribution of economic activities, input-output table, dependency, redundancy, unemployment, economic production in various sectors. |
|
Life lines Water supply, electricity supply, gas supply, telecommunications, mobile telephone network, sewage system. |
Environmental elements Ecosystems, protected areas, natural parks, environmentally sensitive areas, forests, wetlands, aquifers, flora, fauna, biodiversity. |
Table 1: Classification of elements-at risk
In literature many different methods can be found to classify elements at risk, depening on the country, the setting (urban, rural, etc.) the objectives of the risk assessment, the scale, available resources etc.
HAZUS-MH is by far the most advanced method for spatial multi-hazard risk assessment that is publicly available. HAZUS-MH has been developed by the US Federal Emergency Management organization (FEMA) together with the National Institute of Building Sciences (NIBS). HAZUS is a software programme running under ARCGIS for estimating potential losses from earthquake, flood and hurricane hazards. HAZUS-MH software can be requested from the following website: https://www.fema.gov/hazus/
Technical documentation can be downloaded from the following webpage: https://www.fema.gov/hazus/hazus-mh-user-technical-manuals
An important distinction to be made here is also the differentiation between tangible and intangible elements at risk. Tangible elements at risk are those things that can be identified, localized, mapped and quantified (For examples, most of the physical elements). Intangible elements are those things that are very difficult to quantify or map, as they do not have a particular spatial dimension (for instance, the cultural values, the wellbeing of communities, psychological conditions, and sociological behavior). When a disaster hits also these elements at risk may be severely impacted.
Basic units for elements at risk mapping
Risk assessment should be done based on certain basic spatial units. These could be administrative units, such as countries, provinces, municipalities, wards or even individual buildings. Even at large scales a risk assessment is normally not done at individual building level. This has several reasons: the behavior of each individual building is characterized by many factors which can vary from building to building; displaying risk at individual building level is not realistic given the uncertainty in data and models; displaying risk information at individual building level could lead to undesirable legal consequences. Table 1 also gives suggestions for the best basic mapping unit to use. Even at large scales a risk assessment is normally not done at individual building level. Therefore, even at large scale, risk assessment is normally carried out for groups of buildings, located in so-called homogeneous units.
A homogeneous unit is a mapping unit that has more or less the same characteristics in terms of elements at risk. For instance the same landuse type or the same building types.
Scale versus elements at risk mapping
Elements at risk inventories can be carried out at various scale levels, depending on the requirements of the risk study. In this methodology book we use three different scales of analysis, ranging from national scale to a detailed scale. In the table below an overview is given of these three scale levels versus the detail of the elements at risk that could be used.
|
Elements at risk |
Scales of analysis |
||
|
National <1: 50.000 |
Large(Local) 1: 10.000 |
Detailed >1:10.000 |
|
|
Buildings |
Homogeneous units:
|
Building footprints
|
Building footprints
|
|
Transportation networks |
Road networks:
|
Detailed road networks:
|
Detailed road networks:
|
|
Lifelines |
Only main networks
|
Detailed networks and related facilities:
|
Detailed networks and related facilities:
|
|
Essential facilities |
As points
|
Individual building footprints
|
Individual building footprints, with detailed characterization:
|
|
Population data |
By enumeration districts
|
By Mapping unit
|
People per building
|
|
Land cover |
By pixel:
|
By cadastral parcel
|
By cadastral parcel, for a given period of the year
|
|
Economic data |
By parish:
|
By Mapping unit:
|
By building
|
|
Ecological data |
Natural protected area with national relevance |
General flora and fauna data per cadastral parcel. |
Detailed flora and fauna data per cadastral parcel |
Table 2: Elements-at-risk mapping versus mapping scale
One of the most important spatial attributes of the mapping units for an elements-at-risk inventory is the land use. The land use determines to a large extend the type of buildings that can be expected in the unit, the economic activities that are carried out, the density of the population in different periods of the day, etc. Land use maps are prepared by image classification at small scales or through visual interpretation at larger scales (See also Data management book Section 3.4). Ebert et al. (2009) have developed a method using Object Oriented Image classification method for the automatic characterization of the land use types in urban areas.
Physical elements-at-risk
Information collection methods
Buildings and infrastructures are one of the most important group of elements-at-risk. Buildings house the population and the behaviour of a building under a hazard event determines whether the people in the building might be injured or killed. Physical elements-at-risk information can be obtained in several ways. For instance, ideally data is available on the number and types of buildings per mapping unit, or even in the form of building footprint maps. These exiting data can be collected from cadastral data or census data. If such data is not available, building footprints maps can be generated using screen digitizing from high resolution images (Van Westen et al., 2002) or collect field data with Mobile GIS. Automated building and urban structures mapping have also been carried out using high resolution satellite images (Fraser et al., 2002), InSAR (Stilla et al., 2003), and specifically using LiDAR (Priestnall et al., 200; Brenner, 2005; Oude Elberink and Vosselman, 2009). LIDAR data also allows the extraction of other relevant features, and the calculation of shapes, building height and volumes which are needed in risk assessment.
- Examples--urban structure extraction
 |
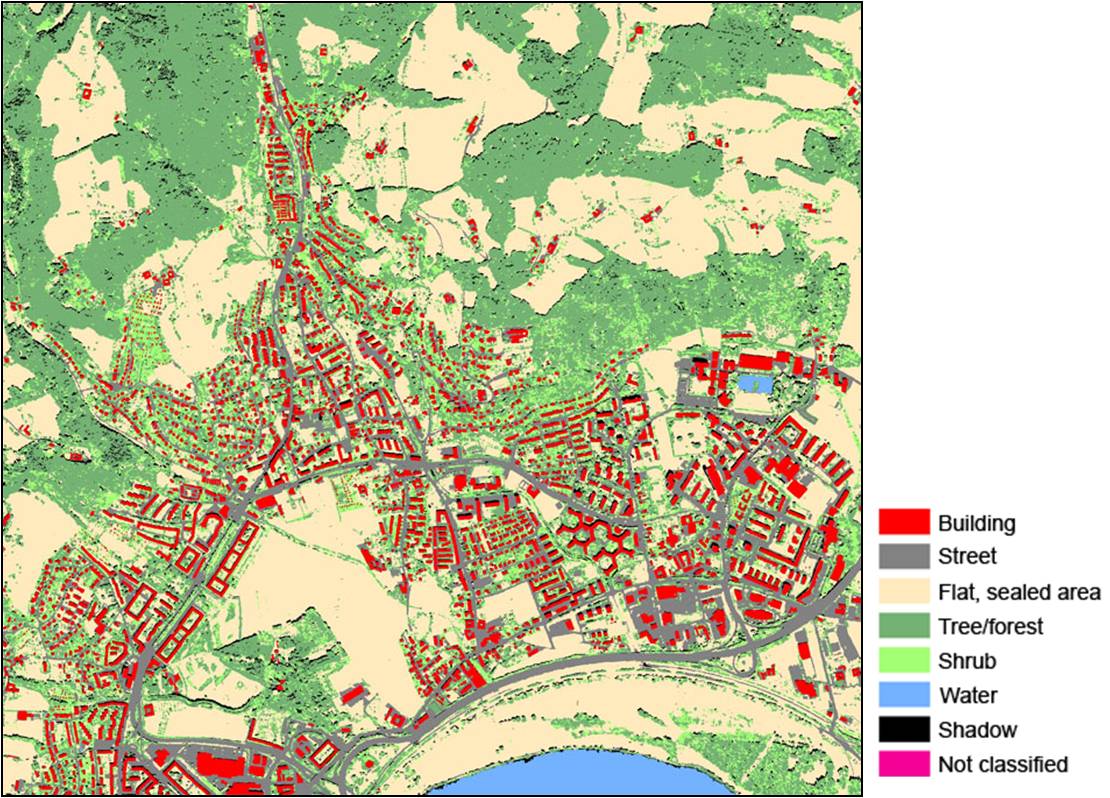 |
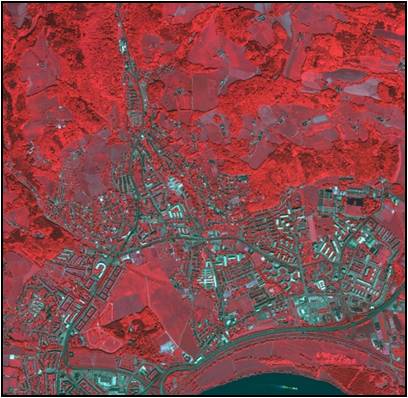
Figure 1: Left: IKONOS pansharpened image (1m) Right: the classified urban structure.
IKONOS data was collected including infrared channel and nDSM was generated based on ALS data. With objected oriented analysis and segmentation classification, the urban structures are classified into eight classes, which are building, street, flat sealed area, tree/forest, shrub, water, shadow and not classified (See figure 1).
More examples can be found in the powerpoint.
Different impacts on elements-at-risk
In order to be able to assess the potential losses and degree of damage of elements-at-risk, it is important to analyze the type of negative effects that the event might have on the elements-at-risk exposed to it, and the characteristics of the elements-at-risk. The negative effects of hazardous events on elements-at-risk can be classified in a number of groups, depending on the type of hazard (Blong, 2003, Hollenstein, 2005). For instance a building may be impacted by a mass, and the damaging effects would be determined by the volume of the mass, speed of impact and the medium of impact, such as rocks, soil, debris, snow, water, air etc. Buildings could also be affected by undercutting (erosion or landslides), shaking (earthquakes), inundation, fires, loss of support (subsidence), gasses, or loading (e.g. volcanic ashes). In each of these situations particular building characteristics are important for evaluating the damaging effects, such as structural type, construction materials, application of building code, age, maintenance, roof type, height, floor space, volume, shape, proximity to other buildings, proximity to hazard source, proximity to vegetation, and openings (FEMA, 2004; Jones et al., 2005; Grunthal et al, 2006; Douglas, 2007). In this methodology book, we focus on the impacts caused by flood and landslides.
- Flood impacts on elements-at-risk
Damage to buildings from flooding is caused by a number of factors, such as type, velocity, height, duration, sediment and pollution. Different flood types may cause different degrees of damage to buildings and their contents, e.g. coastal flooding, riverine flooding, flashflood. They will determine a number of the following factors.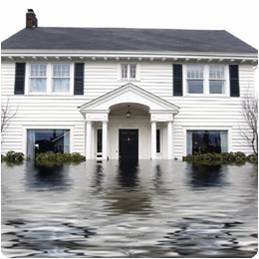 Fast flowing waters will have the capacity to impact the structure, and the lateral forces caused by the flood may produce collapse of buildings. High velocity floods may cause erosion/scouring of embankments, slopes, levees, and building foundations. Flood depth is an important factor as it will determine how much of the building will be submerged under water, and together with the velocity will determine the impulse of flooding. Impulse is velocity multiplied by height. Flood duration is very important in relation to the construction materials of the building and the way they may deteriorate under the influence of water. For example masonry buildings will be heavily affected by salt water in the case of coastal flooding, which may have a long duration effect on the building. The amount of sediments will determine the way in which a building and its contents is damaged and it will determine the clean-up costs. Polluted water will have a deteriorating effect on buildings and its contents.
The following building characteristics are important for determining the damage due to flooding:
Building use: the use of the building will determine the number of people present in the building in different periods of time, and the contents and the value of the contents. This was already discussed in the previous section of this session.
Building materials: the type of building materials will determine how they behave under water saturation, also with a long duration. Wood and masonry materials will have substantial large damage compared to steel or concrete.
 Structural type: the structural type, as mentioned in the previous section will determine whether the building can withstand the impact of fast floods
Height above the ground: the height above the surface will determine the degree of flooding and which types of building contents are damaged.
Maintenance level: As discussed before poor maintenance weakens the building.
Location of doors and openings: the location of openings will determine if and where flood waters can enter the building.
Presence of a basement: the presence of a basement, and whether a basement has windows or not will determine the degree of damage even when the floodwaters are very low.
Height of the building: the building height will determine how much of the building will be flooded. If the building consists of more storeys, the inhabitants will have distributed the content of the building over more floors, causing less damage when the lower floor is flooded. It also allows evacuation of people and valuable contents to higher floors.
Distance to the channel: the proximity to a channel may determine whether the building will be undercut by a fast eroding stream, leading to the collapse of the building. Also the foundation of the building is relevant in this respect.
Presence of walls and other flood retaining structures: the presence of walls around the building, or small levees will make that the building is flooded only at a later phase.
- Landslide impacts on elements-at-risk
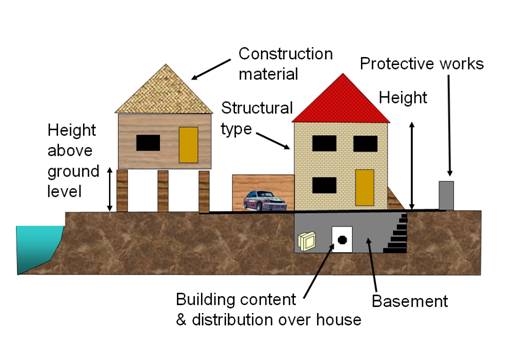
 "Since there are so many different types of landslides, it is difficult to indicate what are the main building characteristics that determine the degree of loss to landslid. The type, velocity and volume of the movement will determine whether the building is only damaged or whether is will be completely destroyed. Also the distance of the building to the source of the movement will play a very important role, and the determination of the runout is therefore very relevant. The important building characteristics are more or less similar to those that are relevant for earthquakes, in particular the structural type, and the foundation type. The orientation of the building and proximity to other buildings are also very relevant, as a building may be in "the lee side or shadow" of other buildings which may take the main impact and reduce the damaging effect. Figure 2 gives two examples about of different ways in which a building might be affected by a landslide.
Figure 2: part of different ways in which a building might be affected by a landslide
For more information about the building behavior under a landslide, see the powerpoint (Introduction to physical elements-at-risk).
Building characteristics importance for flood and landslide
Table 3 shows the summary of importance of building characteristics for damage estimation for flood and landslide. There are many items in the table that have to do with the quality of the construction. The structural type combined with the construction materials determine the strength of the building. But also the fact whether the building have been constructed according to a building code. The factor "age" can be used as a proxie to determine whether buildings are older or younger to the date when building codes where enforced in a given area. Age and maintenance also are indications for the current state of the building.
Table 3: Summary of importance of building characteristics for damage estimation for different hazard types.
Elements-at-risk cost
For risk maps that express losses in economic terms also an estimation of Elements-at-risk costs needs to be done. Several sources of information can be used, such as data on house prices from real-estate agencies, information from cadastres, which indicate the value used as the basis for taxation, engineering societies, which calculate the replacement costs, or insurance companies (Grunthal et al, 2006). It is often difficult to get hold of the building values used by the cadastres, whereas it is easier to use the values from real estate agencies. Samples are taken from each type of building in the various land use classes. In some countries building societies produce a monthly index that allows updating property prices. Cost estimation can be carried out by using the replacement value or the market value. Apart from building costs also the content costs are very relevant, especially for those hazards that have less structural damage such as flooding.
Population data
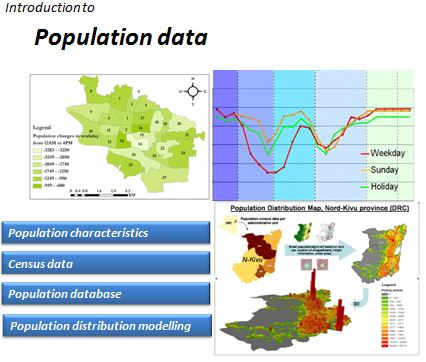
People are the most important elements-at-risk, with a static and dynamic component. The static component relates to the number of inhabitants per mapping unit, and their characteristics, whereas the dynamic component refers to their activity patterns, and their distribution in space and time. Population distribution can be expressed as either the absolute number of people per mapping unit, or as population density. The way population data is collected and represented in a risk assessment depends on the scale of analysis (See Table 2) and the availability of information (Rhind, 1991).
Census data are the obvious source for demographic data. They are used as benchmark data for studying population changes, and are key input for making projections concerning population, households, labour force and employment. Census data is costly to collect, and updating of population information is carried out on average every 10 years. Census data is aggregated to census tracts, and normally data at an individual household level is confidential. This is also the reason why risk assessment is normally carried out at the census tract level (FEMA, 2004). Census tracts are divisions of land that are designed to contain 2500-8000 inhabitants with relatively homogeneous population characteristics, economic status and living conditions. Census data may also contain other relevant characteristics that are used in risk assessment, such as information on age, gender, income, education and migration.
For larger areas census data may be aggregated into larger administrative units. However, for large parts in the world census data is not available, outdated, or unreliable. Therefore also other approaches have been used to model population distribution with remote sensing and GIS, based on a number of factors, such as land cover, roads, slopes, night time illumination etc. Basically two approaches are used: one is to use remote sensing as the main source for the estimation of population distribution, and the other is to use it refine the spatial resolution of population data from available population information (so-called dasymetric mapping) (Balk et al., 2006). Global population data is available from the LandScan Global Population Database (Bhaduri et al., 2007; LandScan, 2010) which provides the average population over 24 hours, in a 1 km resolution grid. The Global Rural-Urban Mapping Project (GRUMP) is another examples of modelling human populations in a common geo-referenced framework (GRUMP, 2004), as is the African Population Database (APD, 2010). More explanation about the population distribution, See Data Management book, Section 5.3 population distribution maps. Higher resolution population databases have also been developed for specific areas. Especially in low income countries where limited information is available, there is a need to generate population information using satellite data. Tatem et al. (2007) made a comparison between semi-automated population distribution mapping for several countries in East Africa, based on 30 m LANDSAT ETM data, and concluded that these produced more accurate results than existing products at a cost of $0.01 per km2.
For large scale risk assessment at municipal or community level, much higher details are required of population information. In the absence of census data static population information can be derived directly using high resolution satellite imagery (e.g. Harvey, 2002) or through a building footprint map, where the land use type and the floorspace are used to estimate the number of people present in a particular building (Chen et al., 2004; Lwin and Murayama, 2009).
Reference:
Most of the references have a link where you can access a pdf of the document.
Balk, D.L., Deichmann, U., Yetman, G., Pozzi, F., Hay, S.I. (2006) Determining global population distribution: methods, applications and data. Advances in Parasitology 62: 119"156. Link
Bhaduri, B., Bright, E., Coleman, P., Urban, M. (2007). LandScan USA: A High Resolution Geospatial and Temporal Modeling Approach for Population Distribution and Dynamics. GeoJournal, 69, 103-117. Link
Brenner, C. (2005). Building reconstruction from images and laser scanning. International Journal of Applied Earth Observation and Geoinformation, 6 (3-4), 187-198. Link
Chen, K., McAneney, J., Blong, R., Leigh, R. , Hunter, L. and Magill, C. (2004) Defining area at risk and its effect in catastrophe loss estimation: a dasymetric mapping approach. Applied Geography 24, 97"117. Link
Ebert, A., Kerle, N. and Stein, A. (2009) Urban social vulnerability assessment with physical proxies and spatial metrics derived from air- and spaceborne imagery and GIS data. In: Natural hazards, 48 (2), 275-294. Link
Fraser, C.S., Baltsavias, E., Grune, A., (2002). Processing of IKONOS imagery for submetre 3D positioning and building extraction, ISPRS Journal of Photogrammetry and Remote Sensing 56 (3), 177-194. Link
FEMA (2004). HAZUS-MH. FEMA"s Methodology for Estimating Potential Losses from Disasters. US Federal Emergency Management Agency. http://www.fema.gov/plan/prevent/hazus/index.shtm
GRUMP (2004). Center for International Earth Science Information Network (CIESIN), Columbia University. Global Rural-Urban Mapping Project (GRUMP): Palisades, NY: CIESIN, Columbia University. http://sedac.ciesin.columbia.edu/gpw
Grunthal, G., Thieken, A.H., Schwarz, J., Radtke, K.S., Smolka, A. and Merz, B. (2006) Comparative Risk Assessments for the City of Cologne " Storms, Floods, Earthquakes. Natural Hazards, 38 (1-2), 21-44. Link
Harvey, J.T., (2002). Estimating census district populations from satellite imagery: Some approaches and limitations, International Journal of Remote Sensing, 23,2071"2095. Link
LandScan (2010). LandScanTM Global Population Database. Oak Ridge, TN: Oak Ridge National Laboratory. http://www.ornl.gov/landscan/
Lwin, K. and Murayama, Y. (2009). A GIS Approach to Estimation of Building Population for Micro-spatial Analysis. Transactions in GIS, 13, 401-414. Link
Oude Elberink, S. and vossleman, G. (2009). Building Reconstruction by Target Based Graph Matching on Incomplete Laser Data: Analysis and Limitations. Sensors 2009, 9, 6101-6118. Link
Priestnall, G., Jaafar, J., Duncan, A., (2000). Extracting urban features from LiDAR digital surface models. Computers, Environment and Urban Systems, 24 (2), 65-78. Link
Stilla, U., Soergel, U., Thoennessen, U., (2003). Potential and limits of InSAR data for building reconstruction in built-up areas. ISPRS Journal of Photogrammetry and Remote Sensing 58 (1-2), 113-123. Link
Tatem, A.J., Noor, A.M., von Hagen, C., Di Gregorio, A., and Hay, S.I., (2007) High Resolution Population Maps for Low Income Nations: Combining Land Cover and Census in East Africa. PLoS ONE 2(12): e1298. doi:10.1371/journal.pone.0001298. Link
Van Westen, C. J., Montoya, L., and Boerboom, L. (2002). Multi-Hazard Risk Assessment using GIS in urban areas: A case study for the city of Turrialba, Costa-Rica, In: Proc. Regional workshop on Best Practise in Disaster Mitigation, Bali, 120"136. Link