

This use case is the first one dealing with hazard assessment and focuses on methods to collect historic information on disasters. Knowledge on when, where and what has happened is very important in order to be able to predict what might happen in future in terms of hazardous events. Even though conditions might change (e.g. climate change) historical disaster information is fundamental for understanding magnitude-frequency relations of hazardous events, and to validate hazard and risk models.
Keywords:
Disaster databases; emergency calls; international databases; media data; community based data;
| Before you start: | Use case Location: | Uses GIS data: | Authors: |
|---|---|---|---|
| It would be good to read section 4.2 of the data management book | This use case examines the availability of historical data from a number of sources using the country of Saint Vincent as example | Yes, there is a dataset available that can be used to analyze the historical data | Cees van Westen |
Introduction:
In order to be able to generate reliable hazard and risk maps, it is very important to have an understanding of the type of disaster events that have occurred in history, in order to be able to establish a relationship between the magnitude of the event and the frequency.
For instance for landslide hazard assessment it is important if data from different triggering events are available, because then it is possible to characterize the susceptibility classes with the expected landslide densities that could occur with triggering events with different return periods. Ideally we would like to have a worst case scenario for each of the islands: what would happen in terms of landslide density if the island would be hit by a major hurricane or tropical storm.
The availability of historical events is also important for flood hazard assessment, in order to determine which rainfall events have caused flooding, and if possible also where and how much.
In this use case we will analyse the available data for the triggering events, based on the collection of disaster events per island for the past 150 years. In the next use case we will also analyse the available rainfall data. If rainfall data covers a substantially large period of time during which these major triggering events have occurred, we can use the data to calculate the return periods. Also the spatial distribution of the rainfall stations is important in order to model the spatial distribution of rainfall during these triggering events. The distribution with different altitude zones on the leeward and windward sides are also very important for analysing the relation between landslide distributions and rainfall distributions.
Objectives:
The objective of this use case is to generate a record of historical disaster events, using different data sources. The aim is to present the different sources of getting historical data, illustrated by an example from Saint Vincent.
One of the key factors for the generation of hydro-meteorological hazard maps is information on when floods and landslides occurred in the past, and by which triggering events. For the four islands intense rainfall events are considered the most important triggering events. Even though there might be earthquakes occurring in the island, their expected intensity is generally not considered to be high enough to cause substantial landslide problems. Also human interventions may trigger landslides, e.g. through deforestation, clear cutting, improper drainage practices, or slope cutting, but still a rainfall trigger would be required to actual cause the landslides.
Flowchart:
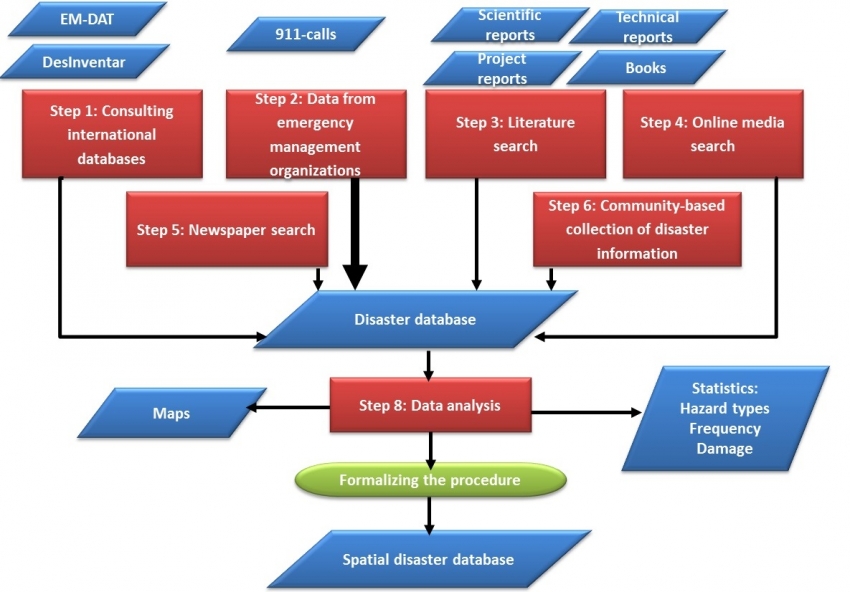
Figure 1: Flowchart. Click to open animation.
Analysis steps:
Step 1: Consulting international databases
The first step is always to start with international disaster databases
EM-DAT
The international disaster database EM-DAT, produced by the Office of U.S. Foreign Disaster Assistance and the Centre for Research on the Epidemiology of Disasters (OFDA/CRED), provides the initial baseline of disaster-event information. In order for a disaster to be entered into the database at least one of the following criteria has to be fulfilled:
- 10 or more people reported killed
- 100 people reported affected
- a call for international assistance
- declaration of a state of emergency
The first step in collection disaster event information is therefore also to consult the website:
http://www.emdat.be/country_profile/index.html
When you go to this website you can find the information available for Saint Vincent.
DESINVENTAR
The creation of a common conceptual and methodological framework was started in 1994 by groups of researchers, academicians, and institutional actors linked to the Network of Social Studies in the Prevention of Disasters in Latin America (Red de Estudios Sociales en Prevención de Desastres en América Latina - LA RED). These groups conceptualised a system of acquisition, consultation and display of information about disasters of small, medium and greater impact, based on pre-existing data, newspaper sources and institutional reports in nine countries in Latin America. The developed conceptualization, methodology and software tool is called Disaster Inventory System - DesInventar (Sistema de Inventario de Desastres . DesInventar).
You can consult it at:
http://online.desinventar.org/
Unfortunately no data is available for Saint Vincent and the Grenadines. In order to evaluate the database, please select the database for Trinidad and Tobago. You can query the database and display the results in maps.
For example: http://online.desinventar.org/desinventar/#TTO-20101111/
Step 2: Data from emergency management organizations
Emergency management organizations need to have an emergency control room, where incoming emergency calls are received and evaluated, and for emergency response. First of all we visited the Office of Disaster Management/ NEMO/NadMA. We use in this example the data for one year only: 2011
Step 3: Literature search
In order to collect information on dates of historical disaster events a study was carried out using various sources to reconstruct the major disaster events in the history of the island (See Figure 3-1). Disaster data was downloaded from the CRED-EMDAT database (Guha-Sapir et al., 2015). The information in this database is rather limited. No specific landslide information was found related to landslides.
As stated in the SVG country profile for disaster risk reduction (DipEcho, 2014) " At present there is no formal cataloguing of disasters for St Vincent and the Grenadines, however, efforts are underway to populate the DesInventar database making it usable by the end of 2014. Various records have however been compiled which informs this documentation. The records will need to be updated regularly as SVG faces annual impact from hazards" .
We also collected information from various other sources on the internet. One of the best sources for older information was O" ™Keefe and Conway (1977) for the older disaster occurrences. They based their own data on extensive analysis of newspaper searches for the various countries. Cross (1992), Crowards (2000), Chaveriat (2000) and Boruff and Cutter (2007) also did a similar search using various sources of information. We also used damage and Loss estimation for the 2013 event called the "Christmass eve trough" (World Bank, 2014). Also Benson et al., (2001) give an overview and we also consulted http://www.hurricanecity.com/city/saintvincent.htm. We also consulted online newspaper reports: http://thevincentian.com/
Step 4: Online media search
We also searched information from online media, such as:
- Dominica: http://dominicanewsonline.com/news/entry-page/
- Saint Lucia: http://www.stlucianewsonline.com/
- Saint Vincent: http://thevincentian.com/
- Grenada: http://thenewtoday.gd/
- Belize: http://belizenews.com/
Step 5: Newspaper search
One of the best data on historical disaster events came from Saint Vincent, where someone carried out a study using newspaper records for the past decades. In some of the cases they had very limited information on historic disaster occurrences. For instance in Grenada the information is very limited.
Step 6: Community-based collection of disaster information
Finally, one of the best methods for the collection of local data on disasters is through the involvement of local disaster management committees and the local relief commissioners.
Step 7: Compilation of the final database
The data that were collected from the various methods described above need to be checked carefully, and compared, in order to remove errors in relation to the date of occurrence, duplications of events reported on consecutive days, and wrong data on impacts.
Step 8: Data analysis
Once the database has been completed it can be used as a basis for the analysis. The following types of information could be derived from such a database:
- Characterization of main hazard types in an area;
- Summarizing the impact of disaster events;
- General frequency of hazard events;
- Correlation of dates of occurrence with rainfall data;
- Spatial distributions of hazard events over the territory;
Results:
Information collected from International Disaster Database
When you search the EM-DAT database for disaster information from Saint Vincent and the Grenadines, the results are a bit disappointing (See Table 1). This is due to the inclusion criteria for the database.
Table 1: Disaster information from the EMDAT database: http://www.emdat.be/country_profile/index.html
|
day |
month |
year |
Hazard Type |
Deaths |
Affected |
Economic damage |
|---|---|---|---|---|---|---|
|
7 |
5 |
1902 |
Volcanic eruption |
1565 |
? |
? |
|
23 |
9 |
1955 |
Storm |
122 |
? |
? |
|
8 |
9 |
1967 |
Storm |
2 |
? |
4500000 |
|
17 |
10 |
1971 |
Volcanic activity |
0 |
2000 |
? |
|
13 |
4 |
1979 |
Volcanic eruption |
2 |
20000 |
? |
|
31 |
7 |
1980 |
Storm |
0 |
20500 |
16300000 |
|
0 |
9 |
1987 |
Flood |
0 |
1000 |
5000000 |
|
21 |
9 |
1987 |
Storm |
0 |
208 |
5300000 |
|
29 |
11 |
1992 |
Flood |
3 |
? |
? |
|
24 |
9 |
2002 |
Storm |
4 |
? |
11000000 |
|
8 |
9 |
2004 |
Storm |
0 |
1004 |
5000000 |
|
14 |
7 |
2005 |
Storm |
0 |
530 |
? |
|
29 |
10 |
2010 |
Storm |
0 |
6100 |
25000000 |
|
11 |
4 |
2011 |
Flood |
0 |
275 |
? |
|
23 |
12 |
2013 |
Flood |
12 |
17422 |
108000000 |
|
Totals |
1710 |
69039 |
180100000 |
|||
Of course this data doesn't incorporate small scale disaster events, which will have to be collected from other sources.
Information collected from internet sources and literature review
Boruff and Cutter (2007) carried out an extensive literature search for disaster events in Saint Vincent. They augmented the baseline data through local fieldwork and archival and Internet-based research, and obtained information on hazard events that affected Saint Vincent between 1901 and 2000 from books, journal articles, local newspapers, Internet databases, and reports from organizations such as the Caribbean Development Bank and the Organization of American States (OAS). Periodicals and colonial reports housed in the University of Florida" ™s Latin America Collection and at the University of the West Indies" ™ Cave Hill Campus Library yielded additional or overlapping references for more than seventy-two events during the same period. In total, they found information on eighty-one discrete hazard events affecting Saint Vincent between 1901 and 2000. Table 2 and Table 3 summarize their sources of information and results.
Table 2: Sources of disaster information used by Boruff and Cutter (2007)
|
Sources |
References |
Number of events |
|---|---|---|
|
Books |
15 |
7 |
|
Articles in journals |
29 |
9 |
|
Articles in other periodicals |
56 |
12 |
|
Organizational reports |
4 |
3 |
|
Project reports |
4 |
6 |
|
Personal communications |
4 |
4 |
|
Presentations |
0 |
0 |
|
Databases |
2 |
12 |
|
Total number of references |
114 |
53 |
|
Total number of events |
81 |
22 |
Table 3: Summary of disaster events for Saint Vincent by Boruff and Cutter (2007)
|
Hazard |
Frequency |
Return period |
|---|---|---|
|
Drought |
Occasional |
|
|
Earthquake |
7 |
14.14 |
|
Flood |
4 |
24.75 |
|
Fire |
Annual |
<1.0 |
|
Landslide |
Frequent |
|
|
Tsunami |
1 |
14.14 |
|
Tropical system |
7 |
99 |
|
Volcanic eruption |
3 |
33 |
According to the available disaster statistics earthquakes have not caused significant damage on the eastern Caribbean islands which are part of CHARIM. Each year, the Eastern Caribbean experiences about 1200 earthquakes greater than magnitude 2.0. It is also estimated that the region will experience at least one magnitude 6 earthquakes every 3-5 years. It is also estimated that the earthquake zone where SVG is located could experience earthquakes of level VII in Mercalli intensity scale for a return period of 50 years (OAS USAID/OFDA (2001); DipEcho, 2014).
The same is true of tsunamis. Only limited damage has been recorded on Saint Vincent (NGDC 2003; SRU,2007). However, some researchers are of the opinion that the underwater volcano Kick em Jenny north of Grenada may also produce a tsunami that might be harmful in Saint Vincent (Smith and Shepherd, 1993). There are three historical tsunami events known for Saint Vincent. The 30-year probability of tsunami run-up in excess of 0.5 m in Kingston is considered to be 11.32 % (Parsons and Geist, 2009).
Table 4: Historical tsunami events in Saint Vincent
|
Year |
Month |
Day |
Location |
Run-up height in meters |
Where? |
|
|---|---|---|---|---|---|---|
|
1755 |
11 |
1 |
Saint Vincent |
4.5 |
||
|
1867 |
11 |
18 |
Saint Vincent |
1.68 |
Beguia island |
|
|
1886 |
3 |
17 |
Saint Vincent |
0.9 |
Bequia Island |
|
On Saint Vincent, the only active volcano is the Soufriere volcano. In the Volcanic atlas of the Lesser Antilles a detailed description is given of the volcanic situation and the volcanic hazards (Lindsay et al, 2005). The most destructive events in terms of human casualties and losses have been the multiple eruptions of La Soufriere volcano. Volcanic eruptions have affected the country in 1718, 1812, 1902, 1971 and 1979. Three eruptions-in 1902, 1971, and 1979-prompted evacuations of the northern portion of the island. Two of the three events resulted in human fatalities (due to suffocating gases, lahartype debris flows, or volcanic ejecta) and destroyed buildings. During the 1979 eruption a large segment of the travel and communications infrastructure on the island was affected as well (Robertson 1995). A summary of historical activity at the Soufriere volcano (Robertson, 1995; Dipecho 2014) is given in Table 5.
Recent statistics from the Forest Department and accounts from historic texts illustrate the frequency of fire events. Bonham Richardson (2004) points out that fire, primarily human-induced fire, has " cleared forests, burned sugar cane, sparked slave rebellions, insurrections, attracted crowds, lighted streets and houses, and symbolized protest in the region for centuries." Not only have sugarcane fires burning out of control or set as acts of defiance created economic hardships for plantation owners and labourers, but wildfires have damaged commercial and residential structures, affected island infrastructure, and, in some cases, resulted in deaths (Richardson 2004).
Table 5: Historical volcanic eruptions in Saint Vincent
|
year |
Description |
|---|---|
|
1718 |
Explosive eruption, preceded by one month of earthquake activity. Ash falls reported on Martinique, St. Kitts, Barbados and Hispaniola. The eruption is estimated to have been the most violent of the historic period (Anderson and Flett, 1903). |
|
1780 |
Increased fumarolic activity - possibly with lava emission. |
|
1811 |
Strong earthquakes. |
|
1812 |
Explosive eruption, preceded by >200 earthquakes during the previous year. Pyroclastic flows, mudflows and ashfalls affected Wallibou to Baleine and Grand Sable to Tourama. Fifty-six people were estimated to have died and a new crater formed. About 80 deaths |
|
1814 |
Small eruption with rocks thrown 0.5 km from the crater. |
|
1880 |
Crater lake temperatures increased with a major rise in water level. There was an increase in fumarolic activity with possible emission of lava (dome). |
|
1901 |
Strong earthquakes. |
|
1902-03 |
Explosive eruption, preceded by 12 months of earthquake activity. Pyroclastic flows, mudflows and ash falls affected areas to the north-east, east and west of the volcano. At least 1565 died and extensive damage was caused to agriculture in the areas around the volcano. |
|
1945-46 |
Local earthquake swarm accompanied by an increase in fumarolic activity. |
|
1948-54 |
Increase in water temperature of the crater lake. |
|
1971-72 |
An aseismic effusive eruption resulting in discharge of 80 x 106 m3 of lava into the crater lake. The lake level rose 30 m destroying vegetation along the inside crater walls. Communities located north of the Rabacca dry river were evacuated. About 1600 persons killed. Considerable damage to the sugar industry. Economic costs estimated as US $ 200,000,000 |
|
1978 |
Local earthquake swarm. |
|
1979 |
Explosive eruption accompanied by effusive activity. The eruption was preceded by increased earthquake activity, an increase in crater lake temperature and a slight inflation of the volcano flanks. There were no fatalities but extensive damage to crops and livestock. The total cost of eruption to the economy was estimated to be above 5.2 m USD. There was evacuation of >14,000 people from areas north of Union Village (east) and Belleisle Hill (west). Others (DipEcho) estimate 20,000 people evacuated, and loses of about US $ 100,000,000. |
Saint Vincent has been hit heavily by hurricanes and tropical storms 25 times in 143 years. On average it is brushed or hit by a tropical storm or hurricane once every 6 years. The most significant hurricanes to affect Saint Vincent were Janet in 1955, Lenny in 1999, Ivan in 2004, and Tomas in 2010.
Hurricane Janet in 1955 is responsible for the single largest number of people killed in such events, 122 people. The hurricane also damaged crops and coastal roads. Tropical Storm Danielle on September 8, 1986 triggered landslides which swept away a considerable length of the pipelines conveying water to hydroelectric stations. This affected the generating capacity at South Rivers station in the northeast part of the island and Richmond station in the northwest. Altogether, the landslides reduced electrical generation capacity by 36%. The wood stave pipelines had to be fully repaired prior to restoring generating capacity sometime later.
In May 1981, St. Vincent experienced a major storm during what is normally the dry season. Landslides occurring at three separate locations severed the 8- inch diameter pipeline for the Majorica water supply system. The damaged sections ranged from 5 to 20 feet in length. Nearly 40 percent of the population of St. Vincent was affected by this water system damage. Damage to the system left some inhabitants without water for a few days and others for nearly six months. Repair of the water line took six months due to the inaccessibility of the damaged sections and. cost between $87,000 and $130,000 (Central Water and Sewage Authority, Personal Communication). Records permitting tabulation of costs for clearing landslide debris and repairing damaged roads are not presently available for St. Vincent. Review of damage assessment reports made for Tropical Storm Danielle and the torrential rains which followed in September 1986, and for Hurricane Emily in September 1987 give some indication of the magnitude of this cost to roads. Totalling items noted as clearing of landslide debris or building of retaining walls from a district by district breakdown of road damage due to Tropical Storm Danielle yielded a total of $677,000. For Hurricane Emily, the amount was $191,000. Based on the cost of road clearance and damage from these two recent storms and the experience on neighbouring islands, it is estimated the average annual cost of this impact on St. Vincent is $115100
Hurricanes and storms have also severely affected the housing sector in St Vincent and the Grenadines including the impact of Hurricane Allen in 1980, Lenny in 1999, Lilli in 2002 and Ivan in 2004, each of which affected over 700 houses. Hurricane Emily in 2005 affected over 500 houses and hurricane Tomas in 2011 affected about 1,200 houses.
The most costly hazard events in St Vincent and the Grenadines (SVG) resulted from Hurricane Tomas in 2010, which cost about EC$130 million and the 2013 flood in December 2013 which resulted in damage and losses of US$ 108.4 mil or (EC$291.4 million). The cost of the 2013 flood is equivalent to 15% of the country" ™s gross domestic product (GDP), (GOVSVG, 2014) Hurricane Tomas resulted in disaster areas being declared on the North Eastern side of the island including Park Hill, Chester Cottage, Sandy Bay and Byera and on the North Western side including Chateaubelair, Coulls Hill, Spring Village and Fitz Hughes. The hurricane injured 2 persons injured, affected about 6100, damaged 1200 homes and destroyed about 20 houses. Damage was also done to schools, community centres and other facilities. The agricultural sector experienced widespread damage especially to bananas and plantains destroying almost 98% in the affected areas. Tree crops and vegetables were also severely affected. Damage was done to water, telecommunications and electricity. SVG also experienced a rainstorm in April 2011 about six month after Hurricane Tomas which caused severe flooding, landslides and the destruction to several bridges in some of the same areas affected by the hurricane. This disaster costed about EC$84 million.
On 24th and 25th December, 2013 a tropical trough system produced heavy rains in Saint Vincent and the Grenadines (SVG). Local rainfall stations reported between 200mm and 310mm in a matter of 2 - 3 hours on the north windward side of the island and up to 153.3mm in the north leeward side of the island, which resulted in intense flooding across the island. The ensuing rapid and intense flash flooding resulted in severe damage and 9 confirmed deaths with 3 persons still missing. Additionally, there is widespread damage to road infrastructure, electricity and water infrastructure, housing as well as public and private buildings.
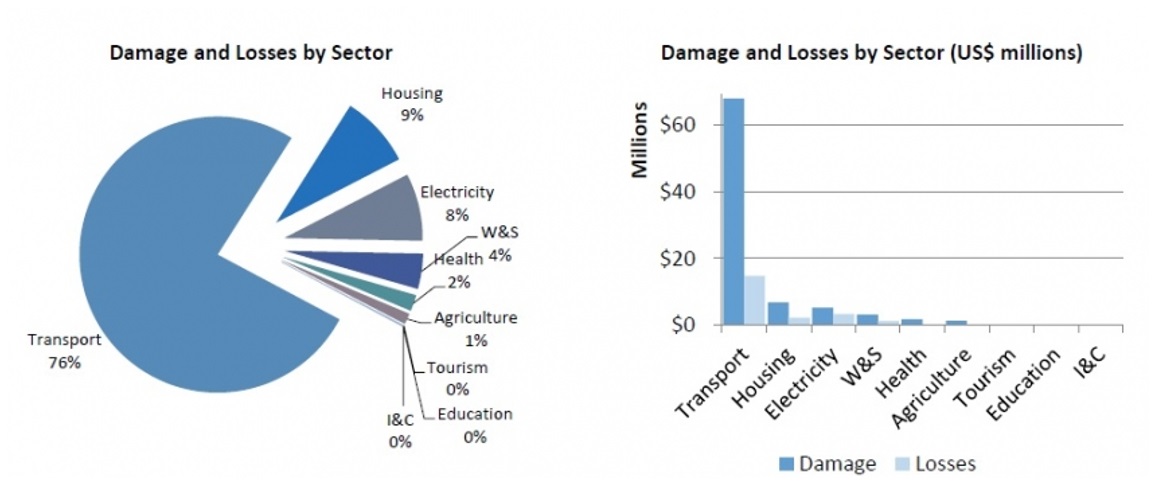
Figure 2: Summary of the Damage and Loss report for the 2013 " Christmas Eve trough" event (World Bank, 2014)
According to the summary of the data reported from each affected sector, the December 24-25, 2013 flood event resulted in total damages and losses of US$108.4million (EC$291.4 million), equivalent to 15% of the country" ™s gross domestic product (GDP). Most of the flood damage was sustained in the infrastructure sector (97%) - followed by the social (3%) and productive sectors (<1%). However, as in the case with any rapid assessment following a major event, re-construction/rehabilitation works contingencies - particularly in the transport sector, could potentially increase the total damages reflected in this report by up to 15%
Local collection of hazard events through emergency calls.
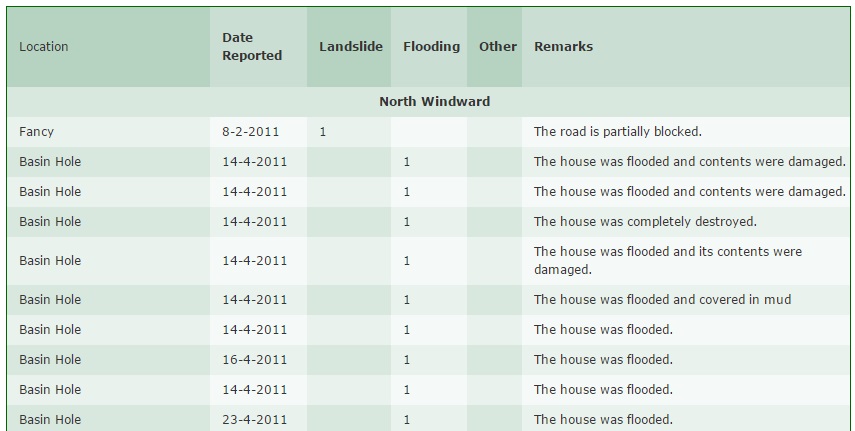
The following table shows an example of the reported hazard events in one year that were registered in the database of NEMO. The data has been modified it so that it shows the damage per sector of the country.
Table 6: Example of results of emergency calls related to landslides and flooding for one year in Saint Vincent (Click to open full file)
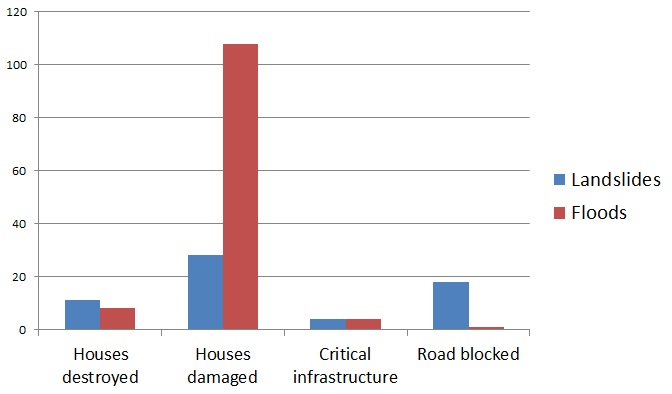 The graphs gives a summary of these data for a single year (2011).
The graph clearly indicates that obtaining event information directly through emergency control room databases may be the best source of information as it is much more complete than other types of disaster information. However, the emergency management organization may not be willing to share this information, as it also contains information on persons, telephone numbers etc.
In one year there were 11 houses destroyed by landslides and 8 by floods. At least 28 houses were damaged by landslides and 108 by floods. Landslides blocked the road in at least 18 places, and there were 8 incidents where schools, churches or clinics were affected by flooding or landslides.
Figure 3: Summary of damage from emergency calls for one year.
When we analyze the number of events reported throughout the year 2011 we can see that in total events were reported on 25 different dates (assumes no writing mistakes in the database). However, there are a few days where the number of reported events peaked: early January, Early February and middle of April, where the main peak is around 13 to 16 April. The Figure below shows the number of reported events (here only the landslide and flood events are indicated) throughout the year 2011.
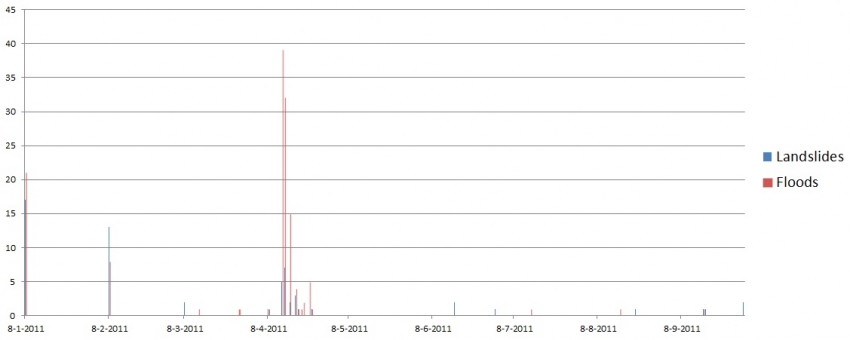
Figure 4: Number of emergency calls in Saint Vincent during one year (2011)
When we group the events per Parish we can also see the spatial distribution of the events over the country for the year 2011.
The Figure to the left summarizes the number of reported events in the NEMO database for the year 2011, by parish.
In this particular year the flood events were mainly concentrated on the windward side of the island, and the landslide events were concentrated mainly on the south side of the island.
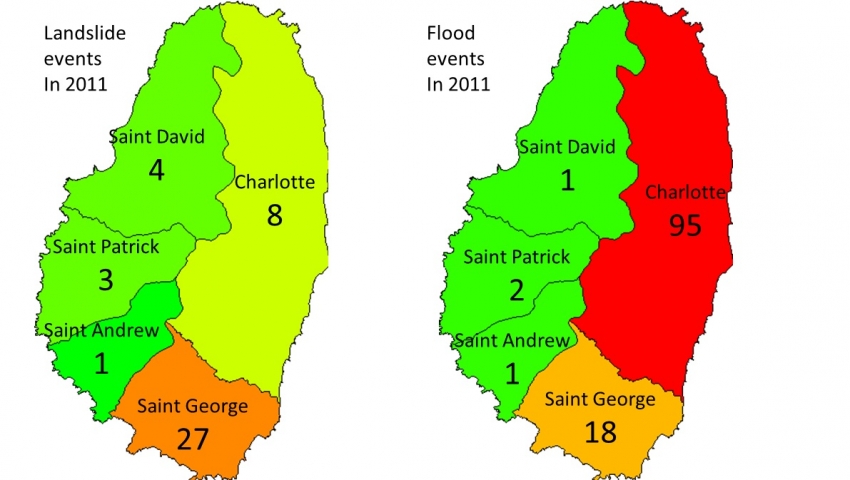
Figure 5: Number of reported landslide and flood events per Parish for 2011
Newspaper search
When searching the online newspaper the Vincentian also a number of reports can be found related to floods and landslides (See example). However, one needs to register for the website and the online version only contains information from 2013 onwards. Therefore also analog version of the newspaper should be consulted to complete the survey.
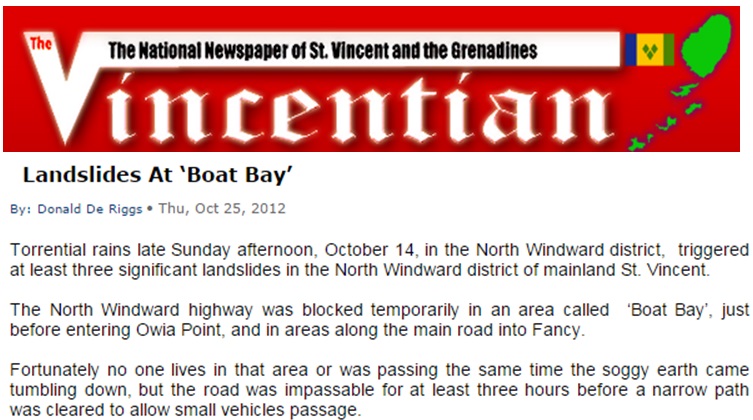
Therefore the search cannot be complete in this use case. The table below shows some examples of information fro the period 2013-April 2015
Table 7: List of events extracted from online news media.
|
Day |
Month |
year |
Location |
Landslide |
Flood |
Remark |
|---|---|---|---|---|---|---|
|
25 |
10 |
2012 |
Boat Bay |
1 |
3 landslides closing road |
|
|
5 |
9 |
2013 |
1 |
|||
|
3 |
1 |
2014 |
1 |
1 |
Christmass eve disaster |
|
|
2 |
1 |
2014 |
1 |
Massive floods |
||
|
2 |
5 |
2014 |
Drought |
|||
|
22 |
8 |
2014 |
1 |
Flood? |
||
|
12 |
9 |
2014 |
1 |
flood |
Conclusions:
After combining the information of the various sources we generated the following table with historical disaster occurrences for Saint Vincent. It is clear from this table that the information is far from complete, and that the more recent information is much more detailed, due to the inclusion of the one year data from NEMO. It would be very important to complete this information with histotical disaster information for other years as well from the NEMO database.
Also NEMO should maintain a systematic database of disaster events that would be complete in terms of :
- Date of occurrence
- What type of hazard occurred?
- What the damage was in terms of casualties, injuries, affected people, damaged houses, destroyed houses, damaged critical infrastructure, road blockage, economic damage.
- The geospatial location of the event. In terms of Parish, location name, and most importantly also the geographical coordinates. There fore it would be important to develop a web-based emergency system where on top of high resolution imagery (e.g. Google Earth background or Openstreetmap) it would be possible to geolocate the events, and assign each a unique ID, composed of the day-month-year-ID.
The final table with historic disaster information for Saint vincent and the Grenadines can be found here: http://www.charim.net/stvincent/historical
References:
Boruff, B.J. and Cutter, S.L. (2007). The Environmental Vulnerability Of Caribbean Island Nations. The Geographical Review 97 (1): 24-45
CDMP [Caribbean Disaster Mitigation Project]. 1999. The TAOS/L Storm Hazard Model and CDMP TAOS/L Applications. Implemented by the Organization of American States, Unit of Sustainable Development and Environment for the USAID Office of Foreign Disaster Assistance and the Caribbean. Regional Program. http://www.oas.org/CDMP/hazmap/taos/taosdoc/taosfull.htm
CDMP (Caribbean Disaster Mitigation Project ) 2000. Atlas of Probable Storm Effects in the Caribbean Sea. Implemented by the Organization of American States, Unit of Sustainable Development and Environment for the USAID Office of Foreign Disaster Assistance and the Caribbean Regional Program
Charveriat, C. (2000) Natural disasters in Latin America and the Caribbean: an overview of Risk. Interamerican Development Bank (IDB). http://papers.ssrn.com/sol3/papers.cfm?abstract_id=1817233
Cross, J.A. (1992). Natural Hazards within the West Indies. Journal of Geography, Volume 91, 5, 190-199
Crowards, T. (2000) Comparative Vulnerability to Natural disaster in the Caribbean. CARIBBEAN DEVELOPMENT BANK, Staff Working Paper No. 1/00.
DeGraff, J.V., 1988. Landslide hazard on St. Vincent, West Indies-Final Report. Washington, D.C., Organization of American States. 20 pages
DeGraff, J.V., Bryce, R., Jibson, R.W., Mora, S., and Rogers, C.T. 1989. Landslides: Their extent and significance in the Caribbean. In E.E. Brabb and B.L. Harrod (eds), Landslides: Extent and Economic Significance. p. 51-80. Rotterdam: A.A. BalkemaDeGraff, J. V., 1991
DipEcho, 2014 Saint Vincent country profile for disaster risk reduction. http://dipecholac.net/docs/files/789-cd-svg.pdf
Fairbridge, R.W., 1975c. Windward Islands. In R.W. Fairbridge (ed.), The Encyclopedia of World Regional Geology, Part 1: Western Hemisphere, p. 667. Stroudburg, Dowden, Hutchinson and Ross
Fiske, R.S., and Sigurdsson, H., 1982, Soufriere volcano, St. Vincent: Observations of its 1979 eruption from the ground, aircraft, and satellites: Science, v. 216, p. 1105-1126
Guha-Sapir, D., Below,R., Hoyois, P. - EM-DAT: International Disaster Database – www.emdat.be – Université Catholique de Louvain – Brussels – Belgium
Hurricane City (http://www.hurricanecity.com/city/)
INCREO (http://www.increo-fp7.eu/)
Lindsay, J.M., Robertson, R.E.A., Shepherd, J.B. and Ali, S. (2005) Volcanic Hazard Atlas of the Lesser Antilles. University Of The West Indies
Lockhart, A. L. 1879. Leeward Islands Almanack. Roseau: Official Gazette Office
NGDC [National Geophysical Data Center]. 2003. Tsunami Data at NGDC. Boulder, Colo.: National Geophysical Data Center. www.ngdc.noaa.gov/seg/hazard/tsu.shtml
O’Keefe, P. and Conway, C. (1977). Natural Hazards in the Windward Islands. University of Bradford, Disaster Research Unit, Occasional Paper Nr, 14. http://www.ilankelman.org/miscellany/BDRU14.pdf
Richardson, B. C. 1989. Catastrophes and Change on St. Vincent. National Geographic Research 5 (1): 111-125.
Richardson, B. C. 2004. Igniting the Caribbean’s Past: Fire in British West Indian History. Chapel Hill: University of North Carolina Press.
Robertson, R. E. A. 1995. An Assessment of the Risk from Future Eruptions of the Soufriere Volcano of St.Vincent, Natural Hazards 11 ( 2 ) : 163-19
SRU [Seismic Research Unit]. (2005). Volcanoes. University of the West Indies, Seismic Research Unit.
SRU [Seismic Research Unit]. (2007). Earthquakes. University of the West Indies, Seismic Research Unit.
UN-ISDR, 2004. Terminology of disaster risk reduction. United Nations, International Strategy for Disaster Reduction, Geneva, Switzerland http://www.unisdr.org/eng/library/lib-terminology-eng%20home.htm
World Bank, GFDRR (2014). Rapid Damage and Loss Assessment (DaLA). December 24-25, 2013 Floods. A report by the Government of Saint Vincent and the Grenadines. http://documents.worldbank.org/curated/en/2014/01/18892616/rapid-damage-loss-assessment-dala-december-24-25-2013-floods-report-government-saint-vincent-grenadines
Last update: 10 - 03 - 2016