

Optimal methods for the different scales of analysis.
Not all methods for landslide susceptibility and zonation are equally applicable at each scale of analysis, defined in the previous session (National, Local and Site-investigation scale). Some require very detailed input data, which can only be collected for small areas at the expense of a lot of efforts and costs (See more on input data for different scales in Data Management Book 2.3).
Therefore a selection has to be made of the most useful types of analysis for each of the mapping scales, maintaining an adequate cost / benefit ratio. Table 1 gives an overview of the methods for landslide hazard analysis and recommendations for their use at the three scales of analysis.
There are several aspects that should be considered:
- Selection of a method should suit the available data and the scale of the analysis. For instance, selecting a physical modelling approach at small scales with insufficient geotechnical and soil depth data is not recommended. This will either lead to large simplifications in the resulting hazard and risk map, or to endless data collection.
- In the case of lacking or incomplete landslide inventories, heuristic methods can still be applied.
- Different landslide types are controlled by different combinations of environmental and triggering factors, and this should be reflected in the analysis. The landslide inventory should be subdivided into several subsets, each related to a particular failure mechanism, and linked to a specific combination of causal factors. Also only those parts of the landslides should be used that represent the situation of the slopes that failed.
- Use of data with a scale or detail that is not appropriate for the hazard assessment method selected should be avoided.
- One should take care not to select factor maps because they can be easily obtained, such as DEM derivatives on a regional or local scale, or the use of satellite derived NDVI values as a causal factor instead of generating a land cover map.
- Methods should take into account the specific characteristics of the Caribbean islands, in terms of their volcanic soils, high weathering degree, intense rainfall, and tropical vegetation cover.
Table 1: Important aspects in the use of the main methods for landslide susceptibility assessment at the three scales of analysis. Colours indicate: green: best, yellow: useful as supporting tool or alternative, Orange: not applicable.
|
|
Important aspects |
Applicability at the defined scales of analysis |
||
|
National scale |
Local scale |
Site investigation scale |
||
|
Inventory methods |
|
Yes, but difficult to obtain event-based landslide inventories due to the rapid vegetation growth and unavailability of high resolution images after major events in the past. Emphasis should be given on the local collection of landslide data in the islands. |
Important supporting tool for the analysis at this scale is to map out in detail the landslides, also using community-based approaches. |
Important supporting tool for determining local hazard. Detailed mapping is required. |
|
Heuristic methods |
|
Best method at this scale. Causal factors and triggering factors can be weighted. In combination with statistical methods. |
Yes, best method for this scale in case physically based models turn out to be too complicated, this is the other alternative to be used at this scale. |
In case physically based models turn out to be too complicated, this is the other alternative to be used at this scale. |
|
Statistical methods |
|
Best method for this scale. Correlating past landslides with combination of factors, in combination with heuristic methods |
Not so applicable at this scale due to the limited spatial variability of the input factors. |
No, not enough spatial variability of input factors. |
|
Physically-based modelling |
|
No, too difficult to parameterize the models. There is not enough information available on soil depth, geotechnical properties and hydrological properties of soil materials to do this. |
Yes, best method for this scale. But only if the area if fairly homogeneous, and it is possible to generate soil maps which indicate the soil thickness and geotechnical & hydrological properties. |
Yes, best method for this scale. Different approaches can be selected, depending on the landslide type. Detailed runout modelling is also possible for specific sites. Should serve as basis for design of engineering measures. |
National-scale landslide susceptibility assessment
The procedure for landslide inventory mapping is explained more in detail in use case 9.3 and section 4.3 of the Data Management book. In this use case we are focusing on the process of generating the susceptibility map. As it is described in section 4.2 of the methodology book, there are many different methods for landslide susceptibility assessment (Fell et al., 2008; Corominas et al., (2013)).
In order to select the method it is important to have in mind the size of the study area (e.g. 754 Km2 for Dominica), the limited amount and quality of the available data, the scale of analysis (with input data ranging in scale between 1:25,000 and 1:50.000, and raster maps with a pixel size of 5 meters) and the experience of the susceptibility analysts.
Because of this, the use of physically-based modelling is not possible, due to the relatively large extension of the study area, and to the absence of parameters such as soil thickness distribution or the geotechnical and hydrological parameters required to carry out physically-based modelling. For a statistical approach we require a sufficiently large landslide datasets related to different triggering events. The current landslides inventories cover a large number of years, during which the causal factors might have changed (e.g. land use/land cover).
 Figure 1: Flowchart for the national-scale landslide susceptibility assessment
The best approach for landslide initiation susceptibility assessment at a scale of 1:25,000 - 1:50000 is the use of statistical methods in combination with expert-based weighting approaches. Since we do not have a very reliable landslide data set, we only used the landslides to check the statistical relation with the factor maps, but generate the actual landslide initiation susceptibility map using Spatial Multi-Criteria evaluation. A combination of statistical methods and expert-based methods should be used, in which the emphasis is on either one of the two, depending on the knowledge of the contributing factors, and the availability of sufficient landslide information.
The procedure was split up in the following steps:
- Step 1: Generation the landslide inventories
- Step 2: Collecting relevant factor maps for landslide occurrence
- Step 3: Exploratory statistical analysis
- Step 4: Selection of the final set of factor maps and generating statistical weights
- Step 5: Creating a criteria tree
- Step 6: Standardizing the factor maps
- Step 7: Weighting the factor
- Step 8: Validation of the susceptibility map
- Step 9: Classification of the landslide susceptibility map
- Step 10: Masking existing landslides
- Step 11: Manual editing
- Step 12: Simplifying units
- Step 13: Calculating densities
- Step 14: Cartographic production of the susceptibility map.
Step 1: Generation the landslide inventories
The first, and very important step is to generate a comprehensive landslide inventory. Several landslide inventories were available for Commonwealth of Dominica. However, these are far from complete, and an attempt was made to update these using several sources of information: interpretation of high resolution satellite images, collection of historical information on the dates of occurrence of past landslide events, collection of available data from the national emergency management organisation and from road maintenance records. The resulting landslide inventory map contains many more landslides than were initially available. Landslides were also classified based on their type, and a differentiation was made between initiation and runout areas. The existing historical landslide inventories were integrated into a multi-temporal landslide inventory map, which was made using extensive image interpretation using high resolution satellite images, complemented with historical high resolution images from Google Earth Pro, where the history slicer (allowing to switch to images from different dates) in combination with the relief exaggeration turned out to be very useful for mapping landslide features. All landslide from the historical inventories were checked, and where needed, classified. All other landslides were also classified into landslide types according to Varnes (1984). We generated finally two different landslide inventories: one for soil slides and one for mass movements in rock, because these are generally caused by different factors.
Step 2: Collecting relevant factor maps for landslide occurrence
In order to analyse the landslide susceptibility, the factor maps presented in table 3 were used. Before being able to use the maps in the modelling, they had to be homogenized. The available digital maps had different map projections and the outline of the island was quite different. Therefore the maps were converted to the same projection (WGS-84), and in order to clip them to the same area, a mask was used derived from the Digital Elevation Model. Next, the quality was evaluated by overlaying them on each other and evaluating whether the combinations made sense. Topological inconsistencies were removed, and wherever possible the thematic classes were adjusted or improved. For the statistical analysis it is required that the factor maps are class maps, therefore all value related maps were classified into classes as well (e.g. the DEM derivatives).
Step 3: Exploratory statistical analysis
It is necessary to understand the role of the different contributing factors or combinations of factors in order to be able to carry out a landslide initiation susceptibility assessment. There are many methods that could be used for this (See section 4.2 of the Methodology Book). One of these methods is the bi-variate statistical method of Weights of Evidence (WOE) which was used for this use case. In this method, each factor map as well as each landslide inventory was rasterized, and overlayed in a GIS, to calculate the density of landslides within the area occupied by the factor and comparing it with the landslide density in the entire study area. From those comparisons, positive and negative weights (W+i and W−) are assigned to each of the different classes of the factor map (e.g. each geological unit within a geologic map).
The method was used as an exploratory tool to determine the final input data. Using all the landslide inventories, this procedure was done for each factor map. This procedure also to evaluate:
- How important each factor class is for each landslide inventory and for individual landslide types. It is important to carry out the analysis for major groups of landslides separately and not mix landslide types that have different causal factors (e.g. shallow soil slides and flows, and deep seated rock slides),
- How consistent one landslide inventory is with respect to the others. An analysis should be done about the fact that the inventories have not been created in a homogeneous form throughout the study area. Greater number of events in accessible areas are always reported, so it is possible that all classes of factors that are present near the roads end up being classified as the most susceptible.
- Which landslide inventories should not be used, or should be integrated. For instance it is possible to use point-based or polygon-based landslide inventories, which may have quite different results. Also it is relevant to decide whether to use all landslides from all time periods, or to carry out the analysis for individual time periods, as the causal landslide factors might have changed.
- Which factor maps should be combined into new ones which have a better prediction capability (e.g. Geology combined with slope). For instance it would be better to combine a geologic map with a slope map so that the combination of a weak lithological unit and steep slopes gives a better prediction than using the factor separately.
Step 4: Selection of the final set of factor maps to be used
After analysing the importance of the factor maps and determining the best combination of individual factor maps, and deciding on the landslide inventory that was used, then the statistical analysis was carried out again using the Weights-of-Evidence modelling using the final landslide inventory and final factor maps. This is normally done in an iterative manner. The values obtained from the WOE procedure for the classes of the factor maps were then used as an indication of the weight that should be used in the Spatial Multi-Criteria evaluation (SMCE) for the landslide initiation susceptibility assessment.
Step 5: Creating criteria trees
As was shown already in a number of other use cases, the Spatial Multi-Criteria Evaluation method is also a useful approach in the landslide susceptibility assessment. It combines the expert knowledge, which is always essential in such type of analysis, with factual information derived from the statistical analysis. Due to all kinds of reasons the weights from the statistical analysis should not be taken strictly as they are. The most important reasons are:
- errors in the boundaries of thematic layers, leading to mismatches between landslides and factor classes;
- errors in the thematic content of the layers, leading to strange combinations of landslides and factor classes (e.g. landslides on a beach);
- the thematic map might not be available, and proxies should be used instead;
- uncertainty in exact location of the landslides;
- uncertainty in the classification of landslides
- illogical combinations of factor maps
For implementing the analysis, the SMCE module of the ILWIS software was used. In this method, the expert judgment plays an important role, from the problem definition, till the weighting of the factors within a group and among groups. The analysis starts with the definition of the problem. This step consists on organizing the problem into a criteria tree, with several branches or groups, and a number of factors and/or constraints.
Step 6: Standardizing the factor maps
In order to use Spatial Multi-Criteria Evaluation (SMCE), the factor maps need to be ordered, and standardized inside of the criteria tree. Standardization is the conversion of different types of data (e.g. slope classes, geological units, and distance to roads) into the same range of values between 0 and 1, depending on the importance of the particular data as a factor contributing to landslide susceptibility. In order to decide the final criteria tree to be used to produce the susceptibility map, several different combinations of factor maps were evaluated to find out the best combination of the factor maps for producing the susceptibility map.
Step 7: Weighting the factors
After standardizing the factors, the next step is to assign the relative importance of the factors. This is done in different levels. For example if we combine the topographic factors, such as elevation, slope steepness, slope direction and distance from ridges, into one group we have to determine which of these factors is more important than others. We can do this by pairwise comparison, or by ranking the factors. The relative importance of the factor maps was determined by ranking them according to their weights obtained from the statistical analysis, assuming that factors with higher weights (Weights of Evidence) are more important than those with lower weights.
Step 8: Validation of the susceptibility map.
In order to validate the susceptibility map we combined the composite index map resulting from the Spatial Multi-Criteria Evaluation with the original landslide inventory map. We then calculated the success rate, which indicates the relation between the percentage of the susceptibility map ordered from the highest to the lowest values, and the percentage of landslides occurring in the locations of these values. We applied different methods for analysing the success rate. For instance we only took the initiation areas of all landslides, or separated the landslides in groups with different types and analysed the success rate for them. When we had landslide inventories from different triggering events we also tested the quality of the map for these different inventories. We also carefully analysed the spatial distribution of the susceptibility values visually in the map by overlaying it with a hill shading image of the country and with the landslide inventory in order to evaluate whether the highly susceptible zones were in accordance with our experience in the field, and with the overall geomorphological situation. When we considered that this relation was not good enough or when the success rate was not good enough (e.g. by applying certain rules such as that 70 percent of the landslides should be located within 30 percent of the map) we decided to go back to the selection of relevant factor maps and repeated the statistical analysis and the spatial multi-criteria evaluation for other combinations of factors. So the landslide susceptibility assessment was an iterative procedure, which was done until we were satisfied with the results. We also discussed the results with a landslide expert (Jerome DeGraff) that was involved in earlier landslide inventory and susceptibility assessments on the island, and also with a group of professionals from the country that visited ITC in the Netherlands during a period of one month in spring of 2015. Based on their suggestions a number of modifications were made.
Step 9: Classification of the landslide susceptibility map.
We used the susceptibility value map, and the success rate to subdivide the map in three classes of susceptibility (high, moderate and low). The high susceptibility class has the highest landslide density. The low landslide susceptibility class is used for those areas where landslides are not expected to occur at all, or in very seldom cases. Moderate landslide susceptibility forms the middle class, which should be kept as small as possible.
Step 10: Masking existing landslides.
The final map should also contain the areas where landslides have occurred in the past. They should be included in the high susceptible zone, as it is possible that landslides may happen again in these conditions, unless remedial measures have been adopted after the landslide occurrence. Therefore the existing landslide inventories were used and the locations were masked as "high susceptibility" in the map. Zones immediately surrounding these were indicated a "Moderate susceptibility".
Step 11: Manual editing.
The landslide susceptibility map with the added historical landslides still is in a shape that is too generalized. This is due to the poor quality of the input data, and due to the nature of the analysis method using a combination of statistical analysis and spatial multi-criteria evaluation, which use generalized weights for maps applied to the entire area, whereas there may be exceptions that need to be taken into account locally. Therefore it is important that the final susceptibility map is checked carefully and edited. This is done by exporting the map to an external photo-editing software (CorelPhotoPaint) where it is possible to edit the three classes using the Paint tool. The best is to do this on a dual screen, by comparing the map with a Google Earth image and with a hill shading image overlain with the landslide susceptibility map, plus topographic information, like rivers, roads, buildings etc. This way each part of the area can be visually checked, and the modelled zones of high, moderate and low susceptibility can be adapted, so that they reflect the best situation according to the mapping geomorphologist. If there is a landslide susceptibility map available that is made for the road network, it is also relevant to use this map in editing the final susceptibility map. This is a rather time consuming activity, but it allows to analyse the different parts of the map separately, and therefore obtain results that also are valid for a local scale, and not only for a national scale.
Step 12: Simplifying units.
The manual editing of the susceptibility map is also done to simplify the susceptibility units. After running the statistical analysis and spatial multi-criteria analysis, the resulting landslide susceptibility raster map shows many small areas with different degrees of susceptibility. Sometimes the susceptibility differs from pixel to pixel, due to variations in the input maps (e.g. slope classes may differ very locally). In order to be able to use the resulting map as a basis for planning, the area should be subdivided into zones with different likelihood of landslide occurrence. Therefore during the manual editing phases, areas are simplified, and classified into one of the three classes, removing the large local variation. Also after completing the manual editing process, still many locations with isolated pixels remain. These were subsequently removed in GIS using a majority filter. The resulting landslide susceptibility map can also be converted into a polygon map.
Step 13: Calculating densities.
One the final landslide susceptibility map has been obtained, it is now possible to calculate the number of landslides in the three susceptibility classes. This is now not done anymore to validate the map, as the historical landslides were included in the map in step 10, but now the aim is to characterize the susceptibility classes in terms of landslide density (both in area and in numbers). If different event-based inventories are available, it is also possible to calculate landslide densities for each of them, and if also frequency information is available it is also possible to give an indication of the spatio-temporal probabilities (the density of landslides per class for different return periods of the triggering event). It is also possible to calculate the number of exposed buildings and other infrastructure if available. Especially the manual editing in step 11 allows a much more realistic estimation of the exposure.
Step 14: Cartographic map production.
The last step in the procedure was the cartographic production of the susceptibility map. This map was generated using a hillshading map, which is calculating artificial illumination using a filter over the Digital Elevation Model, which was made by interpolating the available contour lines with a resolution of 10 meters. The generation of the individual thematic layers was carried out using the ILWIS software Final map production was carried out using ArcGIS. Also the drainage network, the road network, the buildings, airports, administrative units, names and other relevant topographic information were added in order to make the map better readable. These maps are available as PDF's on the CHARIM webpage. Also the digital versions of the landslide inventories and the landslide susceptibility maps were made available through the GeoNode.
An example of this method for landslide susceptibility assessment for Dominica can be seen in Use Case 8.3.
National-scale Landslide susceptibility along the road network
The national-scale landslide susceptibility map, which was presented above, is a generalization, and may not represent the situation always correctly for local situations. This is particularly so for the road network. The nation-wide analysis doesn't take into account the specific conditions along the road network, as information is often lacking on the location of cut slopes, conditions of drainage along the road, and the presence of slope stabilization measures along the road network. Also there is limited information available on the landslides that occurred along the roads, as the road department doesn't keep a database of these events, and the road clearance reports are lost after a few years. Therefore it is also important to focus specifically on the road network and derive a susceptibility map using a slightly different approach than the one for the nation-wide study.
There we also discussed the requirement to generate specific landslide susceptibility maps for the road network, because of the following reasons:
- The national scale landslide susceptibility maps do not take into account the specific road related factors (e.g. such as the location and quality of cut slopes, road drainage etc.) due to lack of data;
- There are different agencies involved in landslide related work along the road network, and in the natural terrain. Public works department is responsible for cleaning roads after landslides have occurred, and the construction of remedial measures. They are generally not specifically focusing on collecting and storing landslide related data, and clearance records may get lost soon. This makes the construction of specific landslide database for the road network a real challenge.
- Landslides from the natural terrain above the road network may interrupt the roads, and therefore it is important to incorporate these in the susceptibility assessment. But along roads specific conditions may lead to landslides in cutslopes, failures below the road due to improper road drainage embankment failures. The road may be both the causal factor for the landslide and the element-at-risk.
Therefore it is important that Public work Departments also develop their own road-related landslide inventories, and use them to generate landslide susceptibility and hazard maps, to identify the critical points along the road network where remedial measures are required.
Historical landslide records together with image interpretation and field mapping are used to generate a multi temporal road related landslide database for storm events that have hit the Island of Dominica. The distribution of the landslides triggered by these events on the different road sections are assessed and landslide density per kilometre of the road section is calculated.
As the historical data is far from complete, it is also important to make an assessment of the individual road sections based on their terrain characteristics. Therefore factors such as slope, soil and geology, of the road sections are examined in relationship to landslide frequency and distribution. The return periods of the storm event are analysed based on daily rainfall amounts using the generalized extreme value distribution model. Finally, the landslide susceptibility of the major roads are analysed with spatial multi criteria evaluation (SMCE) based on the available input factor maps: landslide points, slope angle, soil, geology, drainage and land use.
Through this work, the road sections with high landslide susceptibility are identified. Besides, the relation of the landslide occurrences with the triggering rainfall amounts and their return periods are provided. This can help in determining the sections that need further investigation for implementing landslide mitigation measures. Also, the results can be used to identify possible blockage site of the roads due to landslides during storm events.
Figure 2: Flowchart for national scale landslide susceptibility (and hazard) assessment along the national road network.
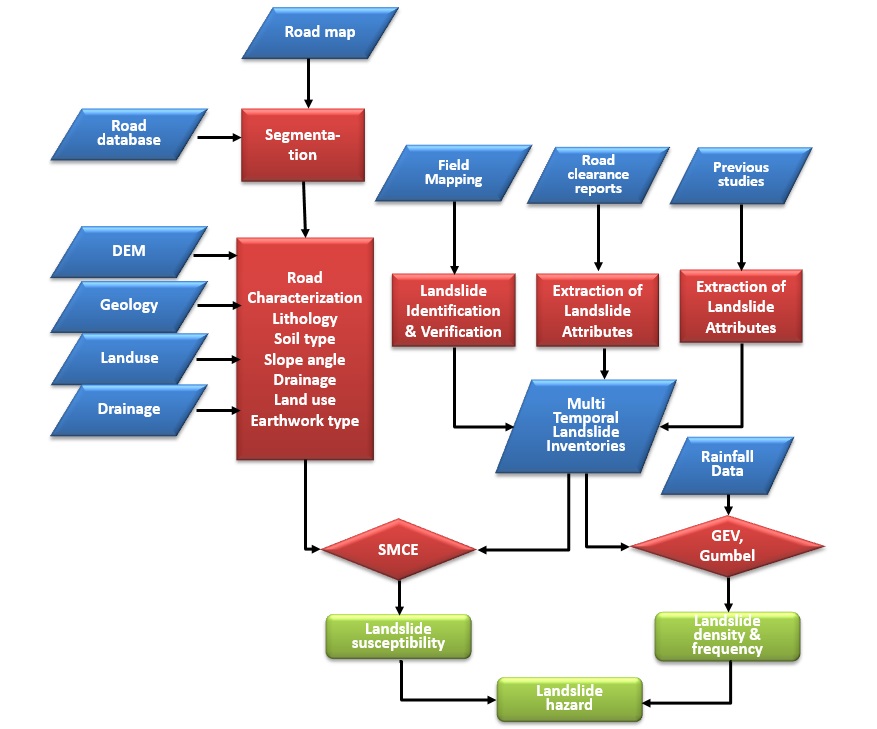
Step 1: Prepare the road database
To transform the road database into a geospatial dataset high resolution imagery together with the location and road network map of Dominica were used. First, the names and location of junction points of the road network were identified using the location map. Then, these points were digitized on the road network map using the high resolution image as a reference. The points were then correlated to the starting and end point information of the road sections provided in the database. After this, the road network was further segmented into 1km interval segments from the starting to end point of each road sections. Finally all the information from the database on each individual road segments were transferred to the respective road segments in road network map. There were some segments with missing data, and it was treated by referring to the images and neighboring segments.
Step 2: Segmentation of the Road sections
Road segmentation and characterization refers to subdividing the entire road network into smaller segments that possess the same spatial characteristics. The road segmentation was developed based on the road database obtained during fieldwork. The database was converted into a geo-spatial dataset, by entering all the information available in the database into the road shape file. As explained above, the shape file has attributes: adjacent ground terrain left and right (whether it is a cutslope, valley or flat), drainage type left and right, and adjacent ground land use. The information from the database were available per one kilometer segments of the road. Due to this, further segmentation of the roads was not possible, instead the 1 km segments were used as a basis to extract the lithology, soil type and slope angle of the road segments.
Step 3: Characterization of the Road sections
The lithology, soil type and slope angle of the one kilometer road segments were extracted from the available geology map, soil map and digital elevation model (DEM) respectively. For this purpose buffer maps along the road network were prepared taking 50 m buffer distances on both sides. For each road segment the upslope side buffer was identified based on the information obtained from the road database and image interpretation. Then, for each road segment the upslope side was selected and the other side was deleted from the buffer map. The buffer map was then crossed with the factor maps. Finally, the geology, soil type and slope angle were assigned for road segments, taking the predominant value (weighted by area) of each of the segment from the crossed tables.
Step 4: Landslide density calculation along the road sections
The landslide density is expressed as the number of landslides per 1 kilometer section of the road. The landslide inventories of the five storm events, prepared using the road maintenance and clearance reports, and the road database were used. First the information on the number of slides per road sections from the landslide inventories were joined to the road database. Then, the length of all each road sections were calculated by excluding the sub-sections where the terrain is flat in both sides. The flat sub-sections were identified based on the high resolution images and the information obtained from the road database. Finally, the number of landslides per kilometer (landslide density) was calculated for each road section by dividing the number of slides by the length of the road section. This was done for all the five storm events separately.
Step 5: Rainfall analysis
For the rainfall analysis we had data from only two stations with a 31-39 years record with some gaps. These stations were analyzed separately and return periods of extreme events were calculated for each. See use case 8.2 for more explanation on this. We also had hourly data for 10 stations arranged in a transect over the country from the DOMEX project, but these data covered a small period of time (from 2007 to 2010), and therefore were not useful for correlating the rainfall with the landslide occurrences. To analyze the distribution of extreme events of rainfall and calculate their return periods, both Generalized Extreme Value (GEV) and Gumbel distribution models were used. Annual daily maximum values of each recording period were calculated for the stations considered. The records were fitted to GEV and Gumbel models using RStudio. RStudio has an extreme value analysis package called "extRemes" . Two functions contained in this package were used for the analysis namely: Fit an Extreme Value Distribution to Data (fevd) and Likelihood-ratio Test (lr.test). The FEVD function can be used to fit the data into GEV distribution model or Gumbel distribution model. As an output, it gives different set of plots such as: QQ and QQ2 plots of the empirical quantiles against model quantiles, histograms of the data against the model density, return level period plots of the return level period against the return period rainfall with 95 percent confidence intervals, etc. The lrLR.test function tests the likelihood ratio of two model fits and indicates which model has a greater fit.
Step 6: Spatial Multi-Criteria Evaluation for landslide susceptibility assessment
The spatial probability analysis was performed using spatial multi criteria evaluation (SMCE). To formulate the criteria tree, the attributes of the characterized road segment map were used as spatial factors. A criteria tree was generated which contains the indicators used for the analysis of susceptibility in a tree like structure, with groups, sub-groups and individual indicators, which are represented by maps (See Figure . A criteria tree for the road network was prepared using slope, drainage, material and land use attributes as spatial factors. Under the slope factor, slope type of adjacent ground left and right and slope angle were included. Individual indicators were converted to a range between 0 and 1 (which is called standardizing) depending on the relative contribution to susceptibility, as evaluated by experts. For example the slope angle was standardized by dividing the values by the maximum to standardize it between 0 and 1. Another factor was the slope type of adjacent ground, which indicates whether the road segment is a cut, valley or flat section. It was standardized using pair wise comparison, considering that: the class "slope cut" is strongly more important than the class "valley" and very strongly more important than the class "flat", and the class "valley" is moderately more important than the class "flat". Another factor used was drainage type, which included the presence of a side ditch type left and right, with four classes: "concrete lined rectangular", "concrete lined V drain", "kerb" and "no drainage". Also this factor was standardized pair wise, giving the highest importance for "no drainage" and the lowest for "concrete lined rectangular" and "V drain". The group "material" contained spatial factors related to geology and soils. The last spatial factor, land use type beside the road segment, has four types: "residential", "commercial", "forest", "agricultural" and "bare". This factor was standardized by rank ordering, giving the 1st rank for "bare" and the last for "residential and commercial". Here also one attribute was used as constraint to exclude the flat sections from the analysis.
An example of a national scale landslide susceptibility assessment along the road network for Dominica is shown in Use Case 8.4.