

Land cover maps are vitally important to gain a full understanding of the hazardous events and the associated risk. Land cover is both a contributing factor in assessing the hazard, but it is also important for defining elements-at-risk (such as built-up areas, forests, agricultural areas). Land cover is also constantly changing so the requirement is to update these maps on an annual or bi-annual basis. For this satellite data and semi-automatic image classification techniques are very important.
Keywords:
Land use; land cover; satellite image; image classification
| Before you start: | Use case Location: | Uses GIS data: | Authors: |
|---|---|---|---|
| Read section 3.4 of the Data management book. | Saint Lucia, Grenada and Saint Vincent | Yes, this use case uses GIS data and satellite images | Colm Jordan and Stephen Grebby (British Geological survey) & Cees van Westen |
Objectives:
The objective of this use case is to generate land use/land cover maps for St Lucia, St. Vincent & the Grenadines, and Grenada by exploiting recent high-resolution or very high-resolution optical satellite imagery.
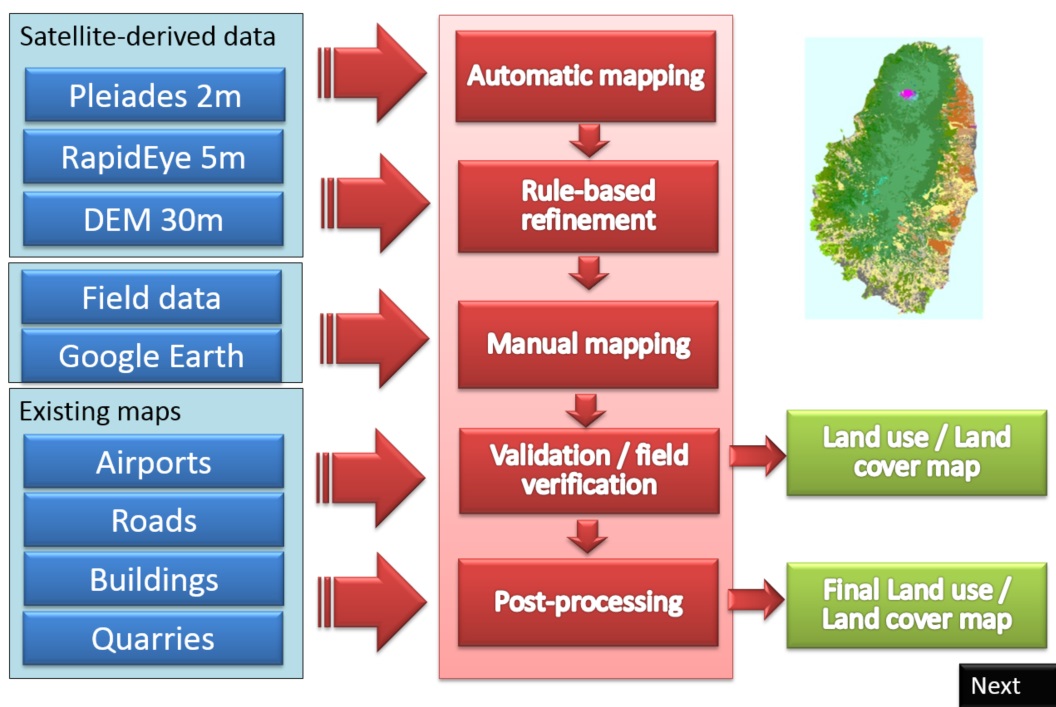
Flowchart:
Data requirements:
A set of recent images with acceptable levels of cloud cover was identified and obtained from the relevant archives for the Area of Interest (AOI). The satellite data comprised Pleiades imagery (acquired between 2013-2014) and RapidEye imagery (acquired 2010-2014). These datasets have a spatial resolution (pixel size) of 2m and 5m, respectively, for the multispectral waveband images. Additionally, the Pleiades datasets includes a very high-resolution 0.5m panchromatic image. Also a 30m resolution Digital Elevation Model was produced from the Pleaiades stereo images. Apart from the satellite data, also Google Earth images were used for land cover verification. Field work was carried out to verify the results, and existing GIS layers were also used in the postprocessing phase.
Table 1 Basic characteristics of the utilized satellite data.
|
Dataset |
Spectral channels |
Spatial resolution (m) |
|---|---|---|
|
Pleiades |
Panchromatic (470-830nm) Blue (430-550nm) Green (500-620nm) Red (590-710nm) Near-infrared (740-940nm) |
0.5 2 2 2 2 |
|
RapidEye |
Blue (440-510nm) Green (520-590nm) Red (630-685nm) Red Edge (690-730nm) Near-infrared (760-850nm) |
5 5 5 5 5 |
Existing land use/land cover maps from 2001 were available for the three AOIs following their production by the various partners of The Nature Conservancy" ™s Mesoamerica and Caribbean Region project (Helmer et al., 2007; 2008). These maps were produced at a spatial resolution of 30m through a combination of automated imagery classification of Landsat Enhanced Thematic Mapper Plus (ETM+) satellite imagery and manual delineation of IKONOS satellite imagery. The mapping was augmented with extensive field knowledge and observation. Accordingly, these maps provide excellent baseline data to build upon for the land use/land cover mapping under this service.
The Pleiades multispectral imagery was selected as the basis for the three new land use/land cover maps because its higher spatial resolution enables more detail to be represented. With a spatial resolution (pixel size) of 2m for the multispectral bands, mapping can theoretically be undertaken at a scale equivalent to 1:10,000.
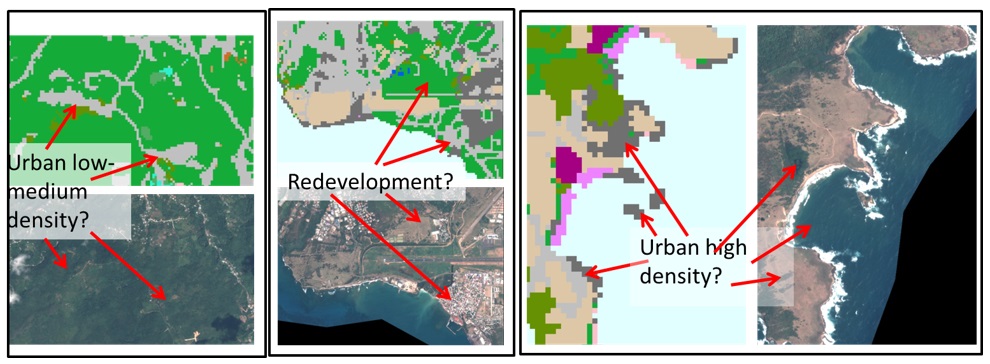
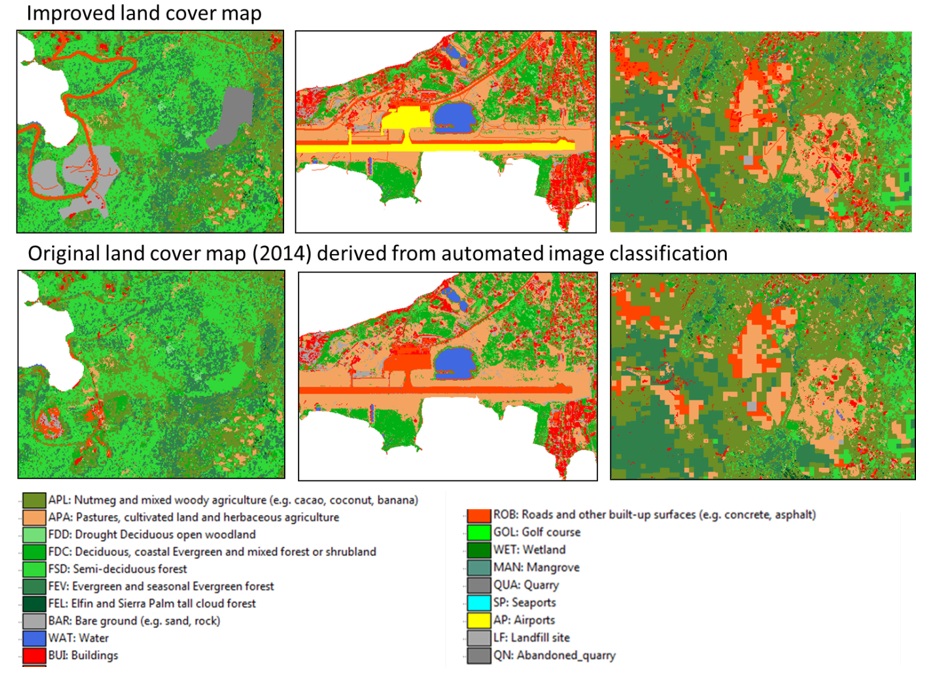
Existing land use maps had a number of problems, illustrated in Figure 1:
- The spatial resolution of 30 m is a problem as this resolution is not enough to capture the details needed for land cover maps used in hazard and risk studies. For hazard assessment information is needed on the hydrological characteristics of different land cover types, and when these are too general it will affect the modeling results considerable. When using the land cover maps for elements-at-risk characterization it is important to have enough detail to capture individual buildings, schools, roads and other objects, which requires a higher resolution.
- Some incorrect classifications. Existing maps had quite some problems with incorrect classifications. In several countries land cover maps were available that had entirely different legends, and were therefore difficult to compare. Also there were many situations were the land cover type was indicated in a wrong manner.
- Outdated. One of the major problems encountered in the windward island was that the existing land cover maps were rather old. The land cover changes rapidly due to construction of buildings, roads, quarries, tourist resorts, etc., but also due to changes in agricultural practices, (illegal) logging, wildfires etc. The occurrence of major disaster events, such as hurricanes also trigger many rapid land use changes, such as bare slope due to landslides, windfall etc.
Figure 1: Illustration of the various problems encountered in using existing land cover maps.
Analysis steps:
To enable the most detailed information to be resolved, the Pleiades imagery was used as the primary dataset for generation of the new land use/land cover map; thus achieving a spatial resolution of 2m, which is equivalent to a mapping scale of 1:10,000.
Step 1: Automatic image classification
For the AOI, land use/land cover was mapped using a combination of automated image classification, rule-based refinement and manual digitization. The existing 30m maps were used to define the different land use/land cover types and identify representative areas in the imagery to help guide the initial automated classification and to subsequently validate the mapping. Water features and the basic road networks were manually digitized at 1:10,000-scale from Pleiades imagery that had been pan-sharpened to 0.5m resolution using the panchromatic image (See section 3.3 of the data Management Book for more information on satellite image processing). Wherever available, existing vector layers were utilized as baseline information during mapping
Cloud problems
Cloud and associated shadow coverage in the Pleiades imagery was quite significant, typically varying in the region of 20-40% . Wherever the ground was obscured by cloud and shadow in the Pleiades imagery, the land use/land cover maps were patched using the RapidEye imagery and the existing land use/land cover maps in order to provide complete areal coverage of the AOI (See Figure 2).
Figure 2: Data used to patch the land use/land cover maps for (A) St. Lucia, (B) Grenada and (C) St. Vincent and the Grenadines

Unfortunately, it was generally not possible to map water features (particularly rivers and streams) and roads in the areas obscured by cloud and shadows in the Pleiades imagery because the alternative RapidEye imagery lacked the spatial resolution required to resolve such features. this means that rivers and roads initially discontinued in the cloud covered areas. However, this was repaired during the post-processing phase, by using vector layers of roads and watercourses.
Determining land cover types
Before mapping, the land use/land cover classes for the AOI were first defined by considering those included on the existing 30m maps, which are based on the International Institute of Tropical Forestry classification scheme. Minor modifications to these classes were made where appropriate to reflect the anticipated discrimination capability of the satellite imagery (Table 2). For example, the " low density urban" and " Medium-high density urban" classes in the existing maps were modified to " Roads and other built-up surfaces" and " Buildings" given the ability to resolve these features in the high-resolution Pleiades imagery. Moreover, given their inherent similarities and the anticipated difficulty in discriminating between them, " Pastures" , " Cultivated land" and " Herbaceous agriculture" were merged to form a single class.
Table 1. Land use/land cover classes for the three countries
|
Saint Lucia |
Grenada |
Saint Vincent & the Grenadines |
|---|---|---|
|
Water |
water |
water |
|
Wetland |
Wetland |
Mangrove |
|
Mangrove |
Mangrove |
Buildings |
|
Buildings |
Buildings |
Roads and other built-up surfaces (e.g. concrete, asphalt) |
|
Roads and other built-up surfaces (e.g. concrete, asphalt) |
Roads and other built-up surfaces (e.g. concrete, asphalt) |
Bare ground (e.g. sand, rock) |
|
Bare ground (e.g. sand, rock) |
Bare ground (e.g. sand, rock) |
Semi-deciduous forest |
|
Quarry |
Quarry |
Seasonal Evergreen forest |
|
Semi- or Drought Deciduous, coastal Evergreen and mixed forest or shrubland |
Semi-deciduous forest |
Evergreen forest |
|
Lowland forest (e.g. Evergreen and seasonal Evergreen) |
Drought Deciduous open woodland |
Drought Deciduous, coastal Evergreen and mixed forest or shrubland |
|
Evergreen forest |
Evergreen and seasonal Evergreen forest |
Elfin and Sierra Palm tall cloud forest |
|
Elfin and Sierra Palm tall cloud forest |
Deciduous, coastal Evergreen and mixed forest or shrubland |
Montane non-forested vegetation (e.g. high-altitude pastures) |
|
Woody agriculture (e.g. cacao, coconut, banana) |
Elfin and Sierra Palm tall cloud forest |
Blue Mahoe plantation |
|
Pastures, cultivated land and herbaceous agriculture |
Nutmeg and mixed woody agriculture (e.g. cacao, coconut, banana) |
Woody agriculture (e.g. cacao, coconut, banana) |
|
Golf course |
Pastures, cultivated land and herbaceous agriculture |
Pasture, cultivated land and herbaceous agriculture |
|
|
Golf course |
Golf course |
Image classification
The basis for each land use/land cover map was the result of supervised per-pixel classification of the imagery according to the land use/land cover classes outlined in Table 2. Due to their inherent similarities, it was anticipated that some of the classes - in particular some forest types, and " Bare ground" , " Roads and other built-up surfaces" , " Pastures, cultivated land and herbaceous agriculture" - could be particularly difficult to discriminate using the limited spectral information contained in only the blue, green, red and near-infrared bands of the Pleiades imagery. Therefore, textural information was also incorporated in the form of the Grey-Level Co-occurrence Matrix (GLCM) parameters of entropy, dissimilarity, second moment and homogeneity (Haralick et al., 1973 and Herold et al., 2003). These parameters were derived from the Pleiades green band in the ENVI 4.8 software package (Research Systems, Inc.) for a 3 X 3 pixel (i.e. 6m X 6m) window and a co-occurrence window shift of 4 pixels (i.e. 8 m) in both the x- and y-direction. These 4 textural bands were merged with the 4 Pleiades multispectral bands to create an 8-band spectral-textural dataset for each AOI for input to the classification.
Algorithm
Classification of the datasets was performed using a supervised neural network (NN) classification algorithm. The NN used in this case was a Multi-Layered Perceptron NN with a back-propagation learning algorithm for supervised learning (Richards and Jia, 2006). Using a three-layered NN (i.e., input, output and one hidden layer), land use/land cover classifications were performed in ENVI 4.8 with the default training parameters. Each classification was supervised with the aid of a set of training pixels that were carefully selected to represent the spectral and textural characteristics of each of the land use/land cover classes. These training pixels were identified in Pleiades imagery by using the existing maps as a guide.
The classified images did not initially provide full areal coverage of the AOIs owing to the obscuring effects of cloud cover and associated shadowing in the imagery. Accordingly, areas with missing land use/land cover information in the classified image were first patched using the results of RapidEye image classifications achieved using the same approach as outline above. Any remaining unclassified areas were then patched using the existing land use/land cover information (Figure 4). The St. Vincent & the Grenadines classification was patched entirely using the existing land use/land cover maps due to the poor quality of the RapidEye imagery.
Step 2: Rule-based refinement
Next, the preliminary land use/land cover maps were augmented using a combination of rule-based refinement and manual delineation. Rule-based refinement comprised reclassifying the classes of some pixels according to a set of rules or criteria. For instance, in all 3 cases rule-based refinement was used to reclassify forested pixels as " Elfin and Sierra Palm tall cloud forest" if they occurred above a specific elevation. Similarly, for St. Lucia, rule-based refinement was used to distinguish between " Lowland forest" and " Evergreen forest" according to the elevation at which the transition occurs.
Step 3: Manual mapping
The land use/land cover maps were validated using a standard remote sensing approach (supplemented by reconnaissance field verification with the imagery and preliminary maps available to field workers on tablet PCs with built-in GPS), which involves comparing the land use/land cover class identities of a sample of pixels in the map with their " ˜true" ™ land use/land cover class. The " ˜true" ™ land use/land cover classes of these pixels were determined using a combination of the pan-sharpened Pleiades imagery and existing maps
Step 4: Validation and field verification
The land use/land cover maps were validated using a standard remote sensing approach, which involves comparing the land use/land cover class identities of a sample of pixels in the map with their " ˜true" ™ land use/land cover class. The " ˜true" ™ land use/land cover classes of these pixels were determined using a combination of the pan-sharpened Pleiades imagery and existing maps. Field verification was carried to check the land cover classes for a number of areas where there was uncertainty with respect to the land cover mapping. Field verification generally took about 3 days per island, and was also combined with verification of the landslide inventory that was also generated from the satellite images.
Step 5: Post Processing
Post processing consisted of the combination of the land cover map with existing vector layers. One of these consisted of building footprints, to make sure that the land cover class of built-up areas, was converted to bare, in the places where no building was located, and also to add the buildings that were not in the land cover map, but were present in the vector layer, and which were verified that they were not removed. Similar masking operations were carried out in GIS with other vector layers, such as roads, airports, industrial complexes, quarries and waterbodies.
Results:
Classification results
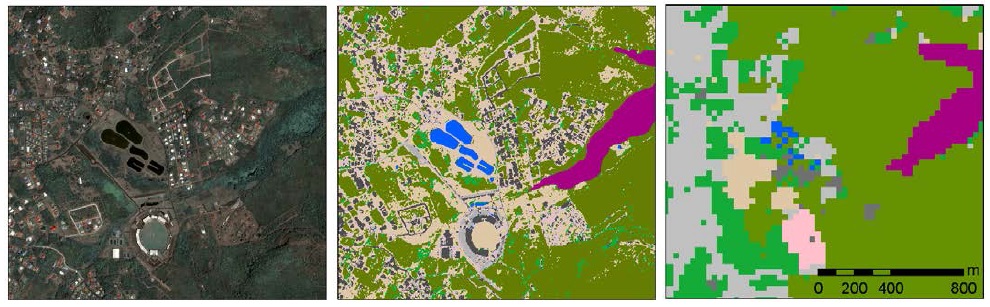
The final land use/land cover maps are raster images with a spatial resolution of 2m, and thus provide an order of magnitude increase in the amount of detail they contain in comparison to the existing maps (See Figure 3). Each 2m pixel in the raster is attributed with its associated land use/land cover class.
Figure 3: Comparison of the level of detail provided in the new 2m land use/land cover maps (middle) and the existing 30m maps (right, © Nature Conservancy Mesomerica and Caribbean Region). Pleiades imagery is shown on the left (includes material © CNES 2014, Distribution Airbus DS / SPOT Image S.A., France, all rights reserved)
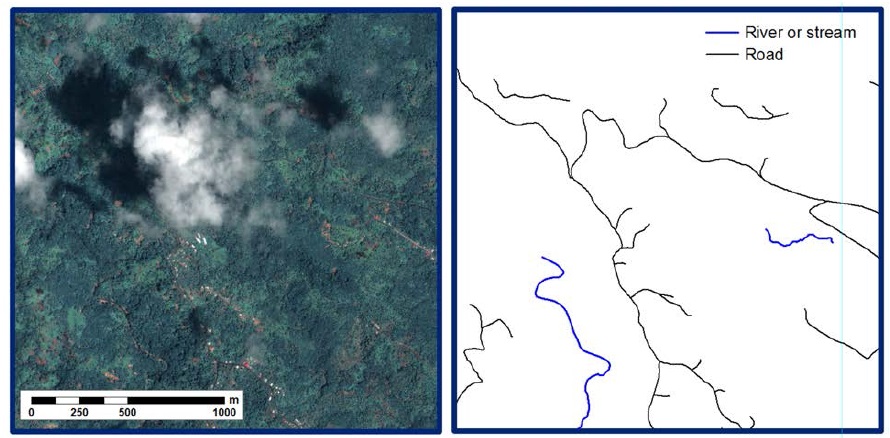
Shadow problems
In addition to land use/land cover, vector layers (shapefiles) documenting water features (e.g. lakes, ponds, rivers, streams) and the basic road network were also created for all 3 AOIs. These features were manually digitized at 1:10,000-scale from the pan-sharpened Pleiades imagery. Where available, existing vectors layer provided by various sources (e.g. local Physical Planning Offices, OpenStreetMap) were utilised as baseline information during mapping. These layers were edited to add, remove and shift features, or re-digitised at a finer scale, as necessary. Cloud cover, associated shadowing and dense vegetation made it difficult to delineate linear features such as rivers, streams and roads in the imagery (Figure ). With such features generally only resolvable at the resolution of the Pleiades imagery, complete coverage of the AOIs was not possible.
Figure 4: Example of the problem related to shadows for the mapping of roads and streams.
Post processing
Post processing was carried out to add those features to the land use maps for which independent GIS data layers were available: building footprints, roads, quarries, airports, oil storage areas, lakes, harbours etc. These data were added using a number of GIS overlay operations, and logical statements were used to change residential areas, whcih were not overlapping with built-up areas, into other land use classes, such as bare areas. This is illustrated in Figure 5.
Figure 5: Example of post processing where existing vector layers were used to modify the land cover maps. The example is from Grenada. Left: inclusion of a waste disposal site in the land cover map. Middle: inclusion of the airport. Right: improvement of the areas where coarse land cover maps were inserted resulted from RapidEye in areas covered by shadows in the Pleiades images.
Accuracy assessment
As described in the analysis steps an accuracy assessment was carried out using a confusion matrix, where the number of pixels was counted for combination of land cover that were derived from the land cover map, and from independent sample points, derived from visual image interpretation and field verification. The final land use / land cover map had an accuracy of 80.8% for Saint Vincent which are within the desired target accuracy of 80-90%.
Final product
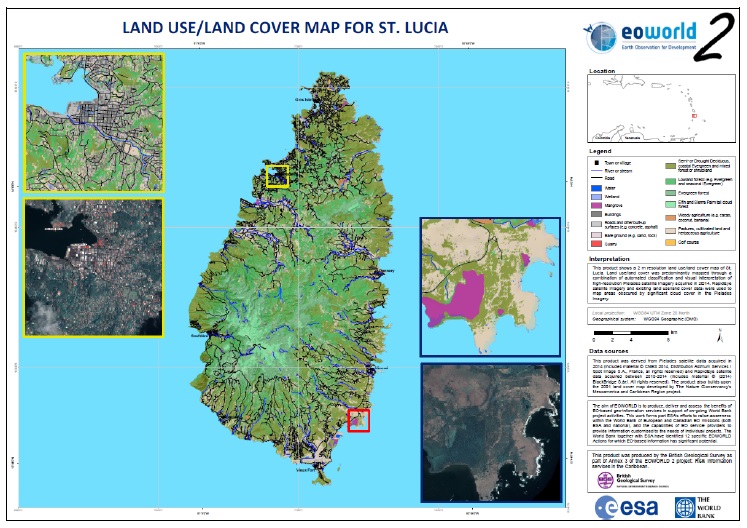
The land use / land cover raster and vector datasets for each country were also compiled into map format. An example (for St Lucia) is illustrated in Figure 6. Includes material © CNES 2014, Distribution Airbus DS / SPOT Image S.A. France, all rights reserved.
Figure 6: Resulting land cover map product from the EoWorld project for Saint Lucia.
The land use / land cover maps produced under this project can be downloaded here for:
Conclusions:
Compared to the existing maps, the new land use/land cover maps derived for this service represent an order of magnitude increase in terms of spatial resolution - increasing from 30m to 2m. As a result, the new maps provide much more detailed information on the distribution of the different land use/land cover types in the AOIs. Moreover, a number of significant errors (due to misclassification) in the existing maps have been corrected in the new maps. Nevertheless, a relatively minor degree of confusion between inherently similar land use/land cover types (particularly vegetation) does persist. Overall, the results demonstrate the potential to utilize high-resolution satellite imagery to produce detailed and accurate land use/land cover maps more efficiently than through an equivalent field-based survey.
The land use/land cover maps produced provide detailed information in St. Vincent & the Grenadines. The products are equivalent to a map scale of approximately 1:10,000. The accompanying vector layers of water bodies, rivers and streams and the basic road network were also mapped at 1:10,000 scale. Accordingly, the intended scale for use of these data is 1:10,000, and so may not be representative at finer scales. The land use/land cover maps provide 100% coverage of the AOI, however the vector layers are fragmented due to cloud and shadow obscuring the ground in the Pleiades satellite imagery. Overall, the new land use/land cover maps represent a considerable improvement on the existing 30m maps.
The land use/land cover maps can be used to determine spatial correlations with landslide occurrences . Such analysis is useful in establishing whether specific land use/land cover types are more prone to landslide events, and can thus be used as input, alongside the DEMs to derive landslide susceptibility maps for St. Lucia and Grenada. Additionally, the DEMs can also be used in conjunction with the water surface features mapped to model the flood risk in both St. Lucia and Grenada. Furthermore, the land use/land cover maps could be readily turned into impervious layers, which can also be incorporated in flood risk analysis.
Beyond the scope of this project, the land use/land cover information can be used for a wide spectrum of uses. For example, the maps could be used for planning purposes, asset management and in developing forestry management strategies. The data can also be used to monitor change over time. Some broader applications of the DEMs could include forestry management, the planning of new transport infrastructure (i.e. roads and railways), and natural resource exploration.
References:
Areces-Mallea, A., Weakley, A.S., Li, X., Sayre, R.G., Parrish, J.D., Tipton, C.V., and Boucher, T., 1999. A guide to Caribbean vegetation types: classification systems and descriptions. Arlington, Va., The Nature Conservancy.
Haralick, R. M., Shanmugan, K., & Dinstein, I. (1973). Textural features for image classification. IEEE Transactions on Systems, Man, and Cybernetics, 3, 610-621.
Helmer, E. H., Schill, S., Pedreror, D. H., Kennaway, T., Cushing, W. M., Coan, M. J., Wood, E. C., Ruzycki, T.,& Tieszen, L. L. (2007). Forest formation and land cover map series-Caribbean Islands. U.S. Geological Survey/Earth Resources Observation and Science (EROS), Land Cover Applications and Global Change, International Land Cover and Biodiversity, Caribbean Land Cover Analyses.
Helmer E. H., Kennaway T. A., Pedreros, D. H., Clark, M. L., Marcano-Vega, H., Tieszen, L. L., Ruzycki, T. R., Schill, S. R. & Carrington, C. M. (2008). Land cover and forest formation distribution for St. Kitts, Nevis, St. Eustatius, Grenada and Barbados from Decision Trees classification of cloud-cleared satellite imagery. Caribbean Journal of Science, 44, 175-189.
Herold, M., Liu, X., Clarke, K. C. (2003). Spatial metrics and image texture for mapping urban land use. Photogrammetric Engineering & Remote Sensing, 69, 991-1001.
Holcombe, E. & Anderson, M. (2010). Tackling landslide risk: Helping land use policy to reflect unplanned housing realities in the Eastern Caribbean. Land Use Policy, 27, 798 – 800.
Jordan, C. J. & Grebby, S. (2014) Risk Information Services for Disaster Risk management (DRM) in the Caribbean: Service Readiness Document. British Geological Survey Open Report ) OR/14/064 and ESA Technical Report.
Last update: 06 - 04 - 2016