Author: Michiel Damen
Keywords:
Links:
Introduction
Many people working with GIS data do not fully understand the collection methodologies of the (end) products, which can lead to unrealistic expectations, misuse of the data and acceptance of poor results. At the same time, the demands of geospatial information is such that the data must address the needs of a wider scope of disciplines. While new technology has made data collection easier and faster, such as the application of Earth Observation, GPS and advanced software for Geospatial data bases, is it also very susceptible to many problems; without the good management, erroneous results are well possible.
The power of GIS resides in its ability to use many types of data related to the same geographical area to perform the analysis, integrating different datasets within a single system. But when a new dataset is brought to the GIS, the software imports not only the data, but also the error that the data contains. The first action to take care of the problem of error is being aware of it and understanding the limitations of the data being used. (https://www.gislounge.com)
The presentation of data from new technology often leads to the expectation that the data is accurate and precise. For the major part, many of the small Caribbean islands lack the human resources and capacity to adequately question work from contractors and consultants and as such are unable to evaluate the accuracy and precision of delivered geospatial data. This chapter reviews the concepts of accuracy and precision. In order to really understand the relevance of accuracy and precision, we should start getting the difference between both terms:
Accuracy
Accuracy is generally considered to be the degree of closeness of an entity is to its actual/true value. When considering information on a map or digital dataset, the definition of accuracy is complicated by the perception, conceptualization and representation of reality. As such, in GIS the wider understanding of accuracy must consider all aspects of accuracy including its position; temporal aspects; thematic aspects and completeness.
The positional accuracy is generally understood as a quantitative assessment supported by statistical evidence. For points, the positional accuracy can be easily computed by considering how well its spatial position matches reality. The closeness between the represented and actual position can be represented by a Root Mean Square (RMS) statistical value, which is an indicator of the spatial/positional accuracy. Precision is often misunderstood to mean the amount of decimal places in numerical position. However, precision is a representation of how close repeated measurements are to each other, independent of their true value. This repeatable value should be represented in the numerical (decimals) reporting of the data and subsequent published map scales.
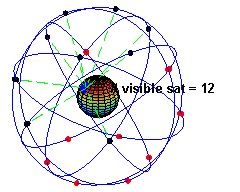
For instance the positional accuracy of a GPS data depends on many factors. For example, the quality of the GPS receiver, the position of the GPS satellites at the time the data was recorded, the characteristics of the surroundings (buildings, tree cover, valleys, etc. ) and even the weather. It makes also a difference if the GPS is stationary or moving (for instcnaer in a plane or car).

Figure 1. GPS satellite constellation
One has to differentiate between horizontal positional error and the vertical error. Differential GPS (DGPS) can improve the positional accurracy to less than a meter.
See for more details Trimble GPS Tutorial: http://www.trimble.com/gps_tutorial/howgps-error2.aspx

Figure 2. The mobile network data were shown to be nearly as informative as radar and rain gauges (right). Ref: BBC http://www.bbc.com/news/science-environment-21290976
The temporal accuracy refers to data that has a time components. This is to say, data whose position changes over time, in which case the mapping of the feature is accurate at the date of mapping. On such example are mobile rain gauges. If the gauges are moved, then their positions are only valid for that particular time. This aspect of time dependence has nothing to do with how up-to-date the information is, but rather the validity at the time of measurement.
A way to measure rainfall using mobile phone network signals has been put into practice across the Netherlands. Rain absorbs and scatters mobile phone signals in a way that can be analysed to yield an overall rainfall picture.

Figure 3. In the series of images, the concept of precision versus accuracy is visualized. The crosshair of each image represents the true value of the entity and the red dots represent the measure values. Image A is precise and accurate, image B is precise but not accurate, image C is accurate but imprecise, image D is neither accurate nor precise. Understanding both accuracy and precision is important for assessing the usability of a GIS dataset. When a dataset is inaccurate but highly precise, corrective measures can be taken to adjust the dataset to make it more accurate. Error involves assessing both the imprecision of data and its inaccuracies. From: https://www.gislounge.com/gis-data-a-look-at-accuracy-precision-and-types-of-errors/
The thematic accuracy refers to how well the properties of the entities match their positions. Or how accurate the attribute information from for instance an agricultural field is. This pertains to both quantitative and qualitative attributes. Thematic errors can occur due to misclassification or from conflicting thematic data for the same position.
An example of thematic accuracy is the validation of supervised classification of land cover from optical satellite images. The results of the classification has to be compared (=validated) with data from the field, to find its overall accuracy. In this regard, the error of omission is an indicator of how well information was collected/mapped in comparison to standards, while the error of commission reports on the confidence of the use of the mapped data.
An example of accuracy assessment of land cover mapping of the Caribbean islands can be found in the Caribbean Handbook Chapter 3.4. on Land Cover mapping based on Earth Observation. The land cover classification captures vegetation, sealed surfaces, the basic road network and rivers, streams, lakes and water bodies.

Completeness refers to how complete the entity mapped and attribute information is. It should be noted that reality cannot be completely (100%) mapped, and a map is only a representation of the capturer perception of reality. For cost and time purposes, we often need to generalize entities and capture a select target of entities based on the purpose of the data and the standards guiding the survey.
Other considerations related to accuracy that should be taken into consideration are consistency and resolution. Consistency refers to the information devoid of internal contradictions.

Figure 5. Successive clean-up operations for vector data, turning spaghetti data into topological correct data. Ref: ITC textbook on GI Science and Earth Observation, Chapter 8.
In the case of spatial contradictions this includes conformance to topological rules; temporal consistence maintains temporal topology, free from conflicting time stamped occurrences; thematic consistence refers to the lack of contradictions to redundant thematic information.
Precision
While accuracy refers only to how close the measurement is to the true value, is precision related to resolution and variation. This is to say, how much data is shown over a given area. In a way this is a measure of the spatial generalization of the data.
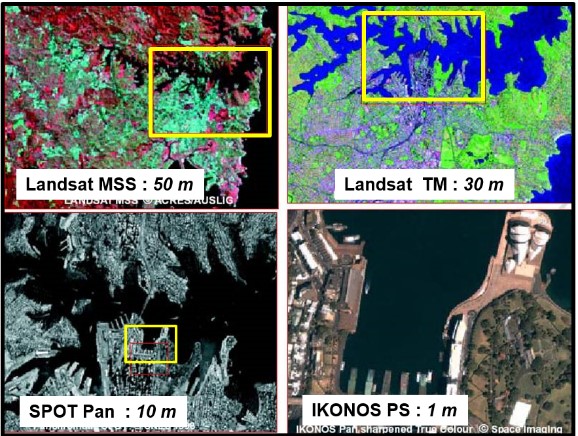
In vector data, this may be considered a function of the scalability and preference of the data capturer and cartographer based on the purpose of data. With raster data, the resolution is usually understood to be the grid size of the data, with the value representing the thematic information of interest. In terrain models these values can represent elevations at the top of features, such as in a digital surface model (DSM), and values on the bare earth or digital terrain model (DTM).

Figure 6. Example of spatial resolution, or grid size of an area, acquired by different types of satellite images.
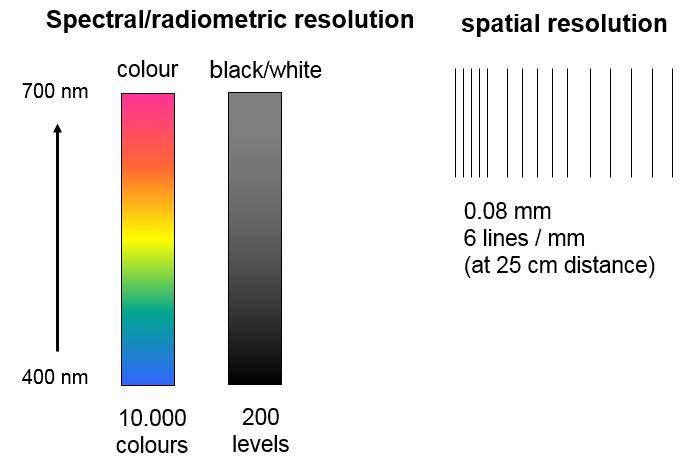
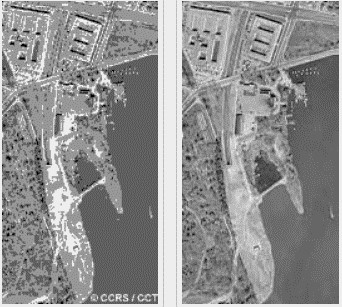
Besides spatial resolution can also the radiometric resolution be relevant for data precision of satellite images. The radiometric resolution of an imaging system describes its ability to discriminate very slight differences in energy. The finer the radiometric resolution of a sensor, the more sensitive or precise it is to detecting small differences in reflected or emitted energy.
Nowadays for the modern sensors this resolution is increasing. While the older Landsat or ASTER systems had ONLY 8 bit (or 256 ) values per pixels, NOWADAYS have almost most of the modern systems a resolution of 16 bit.

Figure 7. Radiometric resolution verses spatial resolution

Figure 8. Left panchromatic image has a lower radiometric resolution than the right image
Recommendation
It is highly recommended that all data within a national database be checked and centralized. This will ensure that all users have access to the same data without conflicts and new data collection projects can be prioritized. It is also important that agencies set target standards and request a QC\QA plan from contractors as to the equipment used and methodology employed in meeting the required accuracy standards. Once collection is complete, the contractor should be responsible for providing evidence that the standards were met, however the client or independent consultant should confirm the accuracy independent of the contractor.

