

Use case intended for: Engineer
| Before you start: | Use case Location: | Uses GIS data: | Authors: |
|---|---|---|---|
| Read use case 8.7: Flash flood hazard analysis,
use case 5.2: Shelter planning, Methodology handbook section 2.2: Rainfall analysis |
Bois d’Orange watershed, Saint Lucia | No |
Victor Jetten |
Introduction:
The purpose of a Flash Flood Early Warning System (FFEWS) is to maximize the warning time at locations subject to flood hazard. A good system provides information to predict whether a flood is about to occur, when it will arrive, and how severe it will be. Organizations and individuals are given notice by the system so they can protect themselves and their property (NOAA, 2010). The flood hazard a person is exposed to depends also on their location relative to the river. The warning time an individual has to reach a shelter is longer when they live further away from the river channel. Most flash flood systems issue a warning if the river reaches so called bank-full conditions, reasoning that a warning should be issued as soon as the discharge exceeds the river bed. These conditions can be analyzed from long term measurements of a river, river discharge modeling or both. Background information can be found at MetEd: NOAA FFEWS guidelines 2010.
A FFEWS is generally based on the "ready-set-go" principle, which ideally consists of 3 warning levels. For St Lucia it can be interpreted as follows:
- the "ready" stage links to weather forecasting, which can be days in advance or on the same day, depending on the type of weather developing;
- the "set" stage to local rainfall thresholds in the catchment where a flash flood is expected, denoting that something may happen within the next hours;
- and the "go" stage is linked to a critical rise in discharge in the main river channel, denoting that a flood may be imminent.
A warning is not useful if it is not embedded in an early warning system that involves the following parts:
- The technical warning system, based on thresholds in meteorology and hydrology that are measured/assessed by equipment and people, and the dissemination system for warnings;
- The institutional part: who is involved at which level
- The action plan: what are the actions when warnings are issued, and by whom
All three parts must be regularly tested and updated, both the technical part (broken down equipment) and the institutional part (rehearse actions, test information system).
On Saint Lucia, the first two stages of the ready-set-go principle is well taken care of. The meteorological services and the WRMA are both constantly monitoring the weather and standardized warnings are given over the media if the water develops into a storm or hurricane. The December through in 2013 proved that correct warnings were issued on the radio constantly, developing from bad weather conditions to actual storm warnings 6 hours before the storm actually manifested itself (on Christmas Eve).
The third stage, the warning based on rising water level in the river, can be based on an automated level recorder or by manual observations, even done by an upstream community member. On Saint Lucia several early warning systems are installed that send an SMS to the authorities when certain water levels are surpassed. However, these water levels are not based on a discharge analysis but on experience only. This may not be a bad thing but the behavior of a river on a specific location under different rainfall circumstances may be as expected.
Objectives:
The objective of this case study is to show how to analyze the analyze the river discharge and evaluate the threshold water levels.
- The current thresholds are 2, 4 and 6 feet of water level rise in the middle stretch of the river. These water level thresholds are compared to simulated discharge at the location of the early warning system water level, for different rainfall situations;
- The flood development downstream of the FEWS station for the different water level stages are analyzed;
- The threshold water levels are evaluated for their effectiveness.
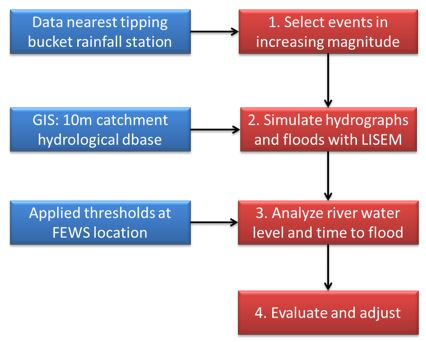
Flowchart:
Use case study area description:
The Bois d’Orange river is situated north of Castries on the north west side of St Lucia. It drains a 11.1 km2 watershed that is typical of that area, with the highest point being nearly 400m and ending and the mouth of the river ending is a coastal swamp. Along the river and spread out over the catchment is inhabitation, in villages such as Corinth, Grande Rivière and Mongiraud, but there are also many houses, businesses and service centers along the highway that crosses the catchment. There are several bridges across the Bois d’Orange river, and the bridge of the highway crossing the river was damaged in the last hurricane and has been rebuilt.
Between this bridge and the second to last is an area that frequently floods, and an early warning system is installed upstream. The Early warning system operates on solar power and is an ultrasonic device that records water level after a bridge continuously. It does not collect constant stream level data unfortunately. The base flow is very low at this location, the soil is between 2 and 2.5 meter deep and the river channel is eroded onto bedrock. This signifies that there is only a very shallow groundwater body and discharge will rise almost entirely because of overland flow during a rainfall event. Near the sea a large swamp area exists (uninhabited) and the baseflow water level is much higher.
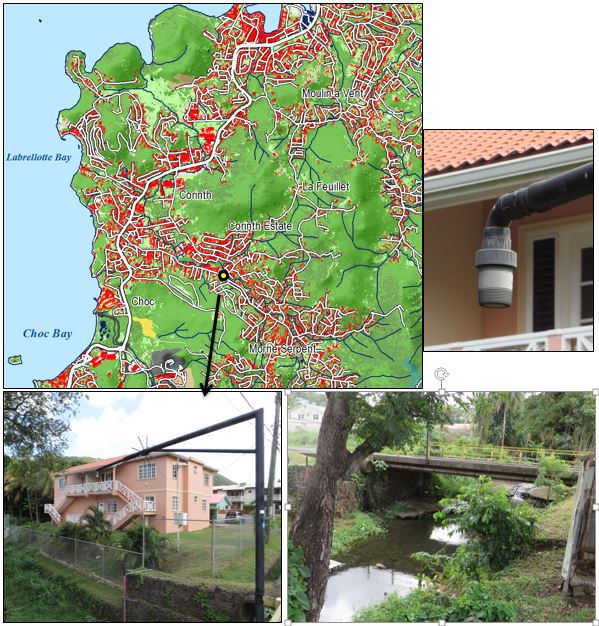
Figure 1: Topographic map of the Bois d’Orange catchment with the Flood Early Warning System sensor and the bridge on which it is installed. The sensor is an ultrasonic sensor operating on solar power.
Problems definition and specifications:
This use case analyzes if the early warning system in the Bois d’Orange catchment is efficient and gives the authorities and inhabitants sufficient time to act in case of a flash flood. The FEWS reacts to a rise in river water level and gives a SMS warning to the authorities, based on the thresholds of 2, 4 and 6 feet water level in the river, at a location in the center of the catchment.
These water levels are evaluated against simulated river discharges at the location of the FEWS station, for a series of rainfall events in increasing magnitude. These events are extracted from measured 1 minute rainfall data of the Trouya station that is located near the south east boundary of the catchment.
The discharges are simulated with LISEM, which simulates the hydrology of the catchment at 10m resolution with a 20 sec timestep (described below).
Data requirements:
|
Rainfall tipping bucket data |
Nearest station |
|
|---|---|---|
|
10m GIS hydrological database |
GIS: 10m flood database CHARIM |
|
Analysis steps:
Step 1
A rainfall analysis to find the rainfall event that causes bank-full conditions, this is a trial and error analysis. The tipping bucket rainfall of the nearest station is used, in this case Trouya, which is located in the south east border of the catchment. Data from July 2011 to June 2014 are used for this analysis. This analysis cannot be done without detailed rainfall data (30 minute intervals and less), such as measured by a tipping bucket.
Separate all rainfall events. A threshold of >120 minutes of a dry interval was chosen to decide the beginning and end of an event. Of these all events larger than 20mm were chosen, the lower limit of the maximum daily rainfall of the Gumbel analysis.
Isolate the rainfall event with lowest depth in each bin and run LISEM to get the hydrograph at the location of the early warning system. Identify also if flooding occurs.
Step 2
Preparation: from the 10m GIS hydrological database select the catchment that includes Bois d’Orange river. The PCRaster GIS is used to generate the input maps for the model with a script that uses the basic data to create maps with hydrological variables. This procedure is described in the National flood hazard map report (Jetten, 2016). LISEM uses a set of base maps which are available at 10m resolution (see fig 5.2.1): the DEM, soil texture classes based on the 1966 soil map and field data for infiltration related variables, the land cover based on the 2014 BGS land cover map, and "infrastructure" maps for channel dimensions, roads and buildings. The model uses the rainfall intensities for each 20 sec timestep, subtracts interception by vegetation canopy and roofs of houses, and compares the rainfall that reaches the surface to the infiltration capacity of the top soil (a 2 layer Green and Ampt infiltration model is used). Infiltration surplus becomes runoff which is routed to the stream channel (2D runoff routing). Then discharge is routed to the outlet with a 1D Kinematic wave but when the discharge rise above the channel sides, the flood dynamics are simulated (2D Saint Venant procedure).
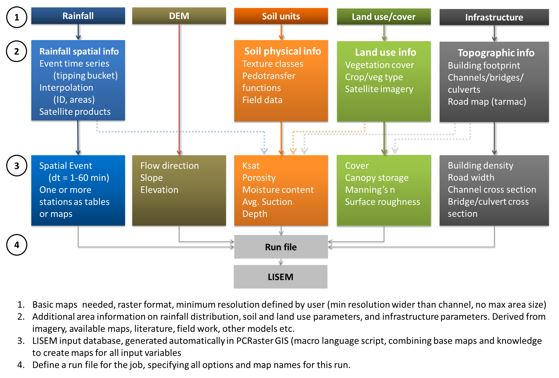
Figure 2: GIS Database used in this case study for the catchment flood simulation
Step 3
The hydrograph water levels for each rainfall are compared to the thresholds to see when the 2, 4 and 6 feet levels are surpassed. When flooding occurs downstream, the time a gridcell is first inundated is saved in a map so that it can be compared to the moment a threshold is surpassed. Immediately downstream on the FEWS station, many houses are located very close to the river bank so there is no additional time when the river floods.
Step 4
Evaluate and if necessary adjust the threshold values in the early warning system.
Results:
Step 1
Figure 2 shows that there are 40 events between June 2011 and July 2014 larger than 20mm (basic histogram information is also given. Note that the largest event (137 mm) is the Christmas event 2013, which caused massive damage on Saint Lucia. In the north however, this event was less pronounced, resulting in a total of 155 mm. As a reference, the total rainfall for the southern half of the island surpassed 300 mm. One additional event was used that occurred on the 6th of November 2015, that also caused flooding in the catchment, the rainfall depth of that event was 128.8 mm, making the total 41.
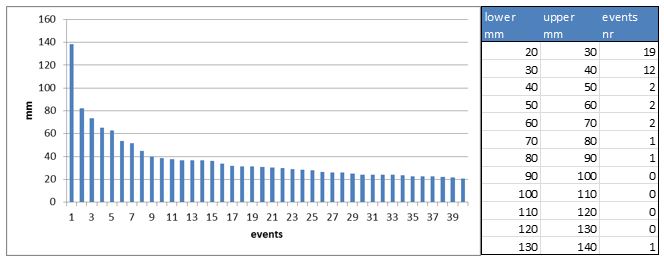
Figure 3: Left: the events of Trouya station > 20 mm between June 2011 and July 2014. Right: simple histogram frequency data of the events.
From the 41 events, 6 were chosen with increasing event depth (see table 5.2.1 for the dates and characteristics). On the dates of the largest two events flooding actually occurred in the catchment. The rainfall depth is the easiest way to characterize a rainfall event but it is not entirely correct to only look at depth only. Larger storms tend to be more complex, lasting longer and with multiple peaks. The first part of a complex storm will saturate the landscape, making it easier in the second or third part of a storm to cause flooding.
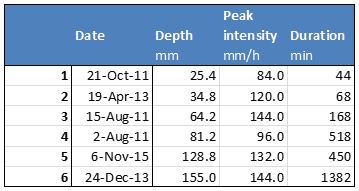
Table 1: Rainfall event characteristics in the EWS analysis
Step 2
All 6 events were simulated with the model LISEM. An initial moisture content of the catchment of 75% of porosity was assumed for all events, which is around field capacity if the soils. The largest 2 events caused flooding (6 Nov 2015 and 24 Dec 2013). The flood was greatest for the 2015 event. The timing and variation in rainfall intensity determines the discharge at this location as all discharge is overland flow related (there is very little baseflow). This mean also that the river reacts very fast to rainfall and the rainfall intensity determines the discharge behavior: above a given intensity de rainfall does not infiltrate and becomes overland flow, while the steep relief concentrates the water rapidly towards the river.
Step 3
For each event the hydrograph was produced for the location of the early warning system sensor. Figure 3 shows the hydrographs of the events. It can be seen that the catchment responds very quickly to rainfall, with an average of 15 minutes between the peak of the rainfall and the peak in discharge. This gives very little warning time.
All events that have rainfall intensities of 120 mm/h generate discharges close to the 6 feet threshold. The first threshold (2 feet, 0.6 m) is passed for every major rainfall event and this will happen multiple times per year. It can serve as a "heads-up" warning, to see if the second and third thresholds are also surpassed. However, the timing between these three for all rainfall events is very short. Table 2 gives the timing in minutes between the passing of the 3 thresholds. This varies between 3-7 minutes.
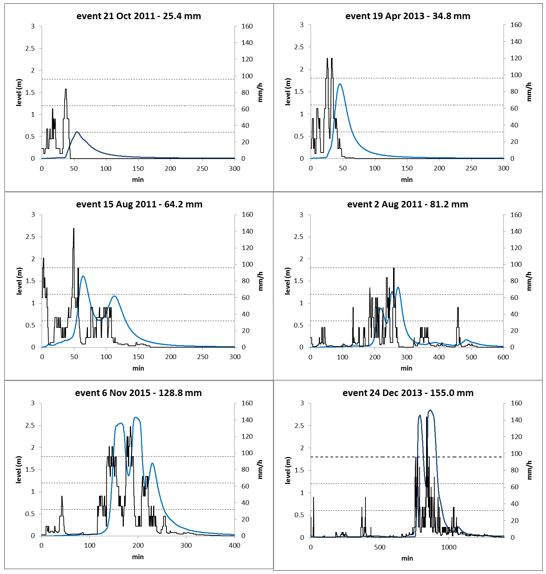
Figure 4: Simulated hydrographs (shown as water level in m) at the location of the EWS station for all events. The three dashed horizontal lines are the 2, 4 and 6 feet river water level thresholds that are used for warnings. The two largest events caused flooding in the catchment.
Figure 3 shows the time to inundation for the event of 6 November 2015. Immediately adjacent to the river downstream of The FEWS location (yellow dot) , buildings start to flood between 150 and 160 minutes, immediately after the 6 feet mark is passed. However houses that are located a bit higher or further away have more time, 20 to 30 min. This depends on the landscape elevation: the terrain west of the river rises quickly and buildings are generally out of danger.
In order to optimize the warning system the following approach could be adopted: store the data of the FEWS station and establish a baseflow level (which will likely have a seasonal variation). Adjust the bottom threshold to a level slightly above the baseflow level (probably between 0.2 and 0.4 meter). Since the system is very rainfall driven, water level will rise to a dangerous level if the rainfall station records more than 100 mm/h. If this could be coupled to an automated signal the lead time would be more.
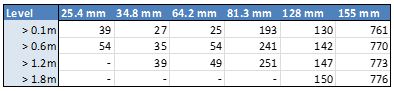
Table 2: Timing in minutes of the water level in the channel rising above the 2, 4 and 6 feetmark (0.6, 1.2 and 1.8 m). For reference the 0,1m water level has been added as approximatestart of the rise of discharge.
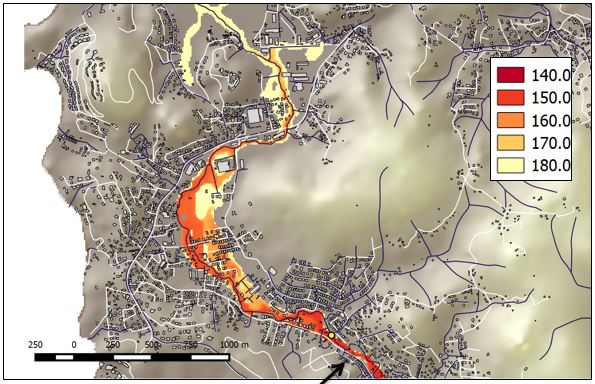
Figure 5. Simulated time to flooding (in minutes) of the area adjacent to the river for 6 Nov 2015. The EWS station is indicated with the arrow (yellow dot). Colors are time of first inundation since the start of the rainfall in minutes. The 4 feet water mark is passed at 146 minutes and the 6 feet water mark at 149 minutes so the inundation is immediate for the houses closest to the river.
IMPORTANT
This analysis is entirely based on simulations. In general the response of the LISEM model with the 10m database is good according to discussions with counterparts, but the model is not calibrated against measured discharge. This would be very simple: the FEWS station monitors the water level so all that needs to be done is storing this water level, and establishing a stage-discharge relationship.
Conclusions:
Based on this analysis, to have 3 water level thresholds that send out SMS warning signals for 3 water level thresholds may be useful, but these signals are not meant for the general population. The signals will be sent within 3-7 minutes of each other so that may cause confusion. The interest is to see if the next level is passed. The last level, 6 feet, is most important, once that is passed flooding is imminent, but response time is extremely short, less than 10 minutes for persons living adjacent to the river. If the FEWS sensor could be coupled to the rainfall station, the lead time might be increased: a combination of water level rising above the baseflow followed by a rainfall intensity of more than 100 mm/h should give more warning time.
Last update: 12 - 04 - 2016