

Keywords:
Integrated watershed management, flood hazard modeling, mitigation
| Before you start: | Use case Location: | Uses GIS data: | Authors: |
|---|---|---|---|
| Read use case 5.2 Early Warning System analysis | Bois d’Orange watershed, Saint Lucia | No | Victor Jetten |
Introduction:
Integrated watershed management (IWM) tries to look at our environment in a more holistic way, whereby the area under consideration is a watershed, instead of an administrative area. A watershed naturally concentrates all rainfall to a river channel and since many climate and environmental processes are water related, it is a logical unit to work in when dealing with development and conservation.
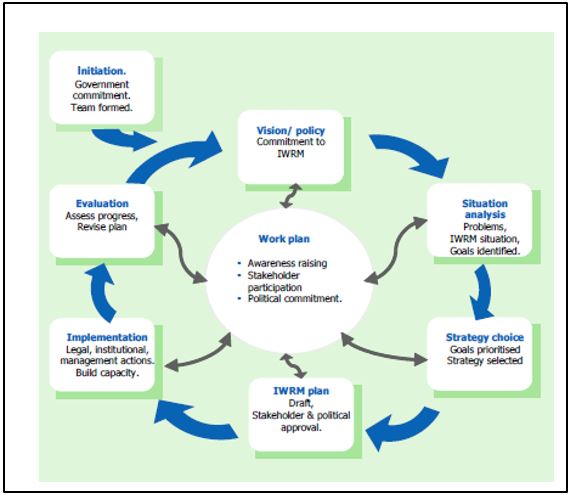
Figure 1: The cycle for developing and adjusting a IWRM plan, and type of questions asked in this process (WMO, Global water partnership, 2007).
The integrated nature of watershed management refers to two main things: the physical/technical context, looking at natural pathways of water and substances, including sources and sinks; and the socio-economic context, include all stakeholders in the process of analysis, planning and implementing changes in a watershed. Often the response of a government to a problem is to “fix it†at the location where a problem arises. This often leads to technical solutions without trying to understand the source of those problems or attempt to intervene in other ways, in particular if floods can be mitigated through intervention upstream. Figure 2 gives an overview of possible mitigation measures, divided in decreasing the hazard, the exposure and the vulnerability. Some of these interventions are technical/engineering in nature, other are based on land use changes or changes in behavior of people.
Figure 2: Overview of strategies available for flood mitigation, divided into hazard reduction, exposure reduction and vulnerability reduction (WMO, Global water partnership, 2007)
The socio-economic and governance parts are very important when designing a solution on a catchment scale, whether they consist of engineering, planning, early warning, or a combination. The costs and benefits, the level of protection expected, the associated actions that should be taken, have to be communicated and discussed with all stakeholders involved, in order to have a successful strategy.
Objectives:
This use case shows how you can use integrated watershed modeling as a part of watershed management.
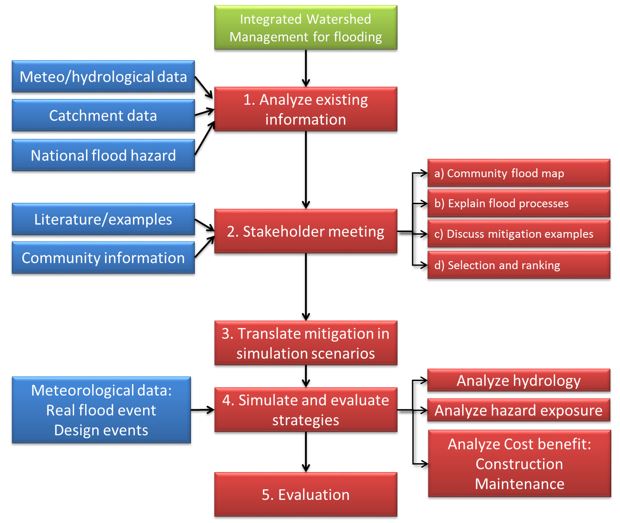
Flowchart:
Use case study area description:
The Bois d'Orange River is situated north of Castries on the north west side of St Lucia. It drains a 11.1 km2 watershed that is typical of that area, with the highest point being nearly 400m and ending and the mouth of the river ending is a coastal swamp. Along the river and spread out over the catchment is inhabitation, in villages such as Corinth, Grande Rivière and Mongiraud, but there are also many houses, businesses and service centers along the highway that crosses the catchment. There are several bridges across the Bois d'Orange river, and the bridge of the highway crossing the river was damaged in the last hurricane and has been rebuilt.
Data requirements:
The data requirements depend on the model you use to analyze different scenarios of flood mitigation. In this example the integrated flood model LISEM is used (see also use case 8.7). This model combines the hydrology of a catchment to simulate the water available for runoff during a rainfall event, with runoff routing, river flow and flooding (1D and 2D simulation processes). For IWM an integrated model is needed, one that simulates the entire catchment hydrology, because certain mitigation measures focus on changing upstream factors, others on downstream factors. LISEM model needs a dataset based on the DEM, land use and soil data, river channel data and data on infrastructure (houses, roads). In this case the data is available in continuous raster datasets, on a 10m resolution. A resolution of 10m or 5m is recommended, to accurately simulate water flow in a catchment.
Once mitigation measures are chosen, possibly other models have to be used (especially when designing engineering solutions.
Analysis steps:
The flowchart explains how the steps are connected.
Step 1a. Background information
Inspect visually the catchment to understand the situation. The national scale flood hazard map for this catchment is shown in figure 2. All along the river the flat valley floor is prone to flooding. This is logical as the valley floor is relatively flat so as soon as the river channel overflows, the flood water spreads out. The right hand image shows the shaded relief map with housing footprint. Discuss this with inhabitants and other knowledgeable people to get a first idea on the locations of floods.
We assume here that the attention areas are circle 1, where flooding of houses is indicated, circle two which has several large buildings and the highway crossing the valley. The northern area indicated as flood prone in the national flood hazard map, is a coastal swamp and flooding there is harmless as there are no inhabitants.
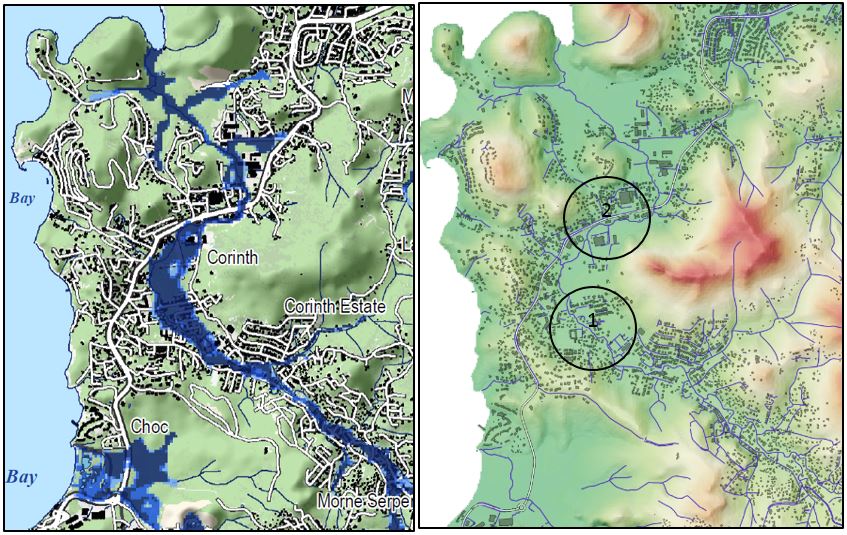
Figure 3: Bois d'Orange river national scale flood hazard map and shaded relief map indicating 3 areas of attention.
From a first general analysis, and evidence of flooding in the past, the entire valley along the river is at risk. This makes finding a solution difficult, if there would be a clear upstream area and a downstream township at risk, limiting runoff might be a good strategy. In this catchment the runoff is generated on the hills surrounding the flood plain so limiting runoff would mean a strategy that separates the runoff from the river along the entire valley.
Step 1b. Collect historical information flood events
The second part of the analysis is to analyze a range of existing rainfall events from the nearest rainfall station (Trouya station) that are known to have flooded the area in the past. This is done also for the early warning system analysis (use case 5.1). There were 40 events between June 2011 and July 2014 larger than 20 mm. The largest event is the Christmas event 2013, which caused massive damage on Saint Lucia. In the north however, this event was less pronounced, resulting in a total of 155 mm, while the total average rainfall for the island surpassed 300 mm. One additional event was used that occurred on the 6th of November 2015, that also caused flooding in the catchment, the rainfall depth of that event was 128.8 mm, making the total 41. Table 1 shows the dates and characteristics of 6 typical events in increasing magnitude. On the dates of the largest two events flooding actually occurred in the catchment. LISEM simulates floods for these two events but not for the other four in Table 1 (conform reality).
PICTURES floods simulated nov and dec
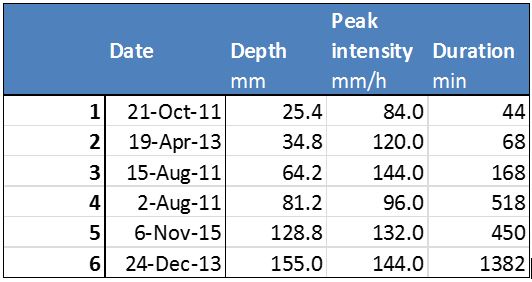
Table 1: Rainfall event characteristics of events with increasing size, the largest reported to give flood problems according to the people in the area.
Step 2. Select possibilities and prepare a stakeholder discussion
A stakeholder discussion has a certain format and its goal is to go over the following steps:
- Explain the context and the purpose of the meeting. The purpose is to come to a selection of possible flood mitigation measures, and because it is a participatory exercise, to create some ownership in the final selection of preferred measures. Note that the scientists/technicians themselves are also stakeholders, and they may also add their preference.
- Discuss evidence of past floods and collect evidence/stories. Let people indicate on a large map where they live and where they think flooding generally takes place. Create a community map.
- Explain the basic principles of flooding in layman language, and point out the cycle: rainfall – infiltration/runoff – flooding. The purpose of this is to later be able to discuss better the various mitigation measures, and how and why they are supposed to work
- Go over potential mitigation measures, using images from other countries. A list of possibilities is given in Figure 3, and these can be evaluated in a first discussion simply by the existing knowledge. Not every scenario has to be extensively simulated to evaluate it. The purpose is to have a few mitigation measures selected and if make ranking that reflects the preferences of the group. The ranking forces people to take the exercise seriously as it involves giving a reason why you have certain preferences.
Below is a list of strategies and reasons why they might work for this catchment. It is not based on a group discussion, but simply based on expert opinion. It serves here as an example.
Strategy 1: prevent runoff from occurring. In catchments that have had strong alterations of land use, assuming this is from natural vegetation to agriculture or an increase of built up areas, the infiltration may have decreased. As is common in tropical environments, the organic matter rapidly decreases with depth because of the high degree of decomposition. This was confirmed by Pratomo (2015), who determined the saturated hydraulic conductivity from 64 sample rings and porosity from 72 sample rings on Grenada, in the Gouyave and St John watersheds as part of a comparative catchment study in the CHARIM project. It is clear from Figure 3 that the saturated hydraulic conductivity value (ksat in mm/h) under natural vegetation is on average much higher than the values under agriculture. Furthermore soil around inhabited areas tends to be compacted and cause even more runoff.
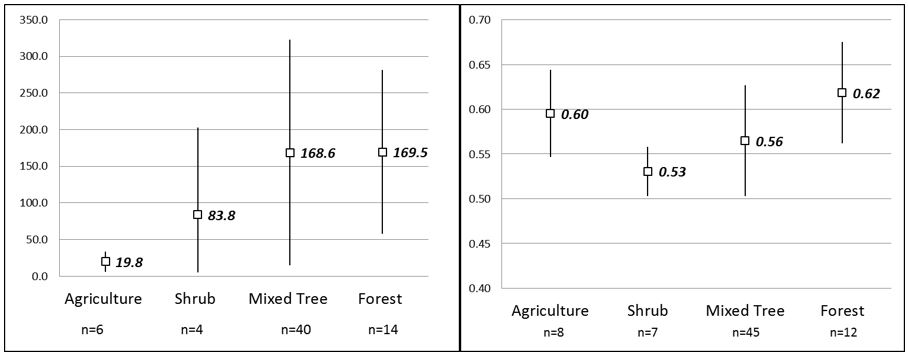
Figure 4. Left: saturated hydraulic conductivity (mm/h) and right: porosity (-) organized per main land cover type. The measurements are from Grenada, taken in the Gouyave and St John watersheds (Pratomo, 2015). The values in bold are the average, the lines show one standard deviation around the mean.
However in this watershed there is no evidence of major changes in land use. In general there is a high infiltration (see figure 4). There is little to gain with large land use changes.
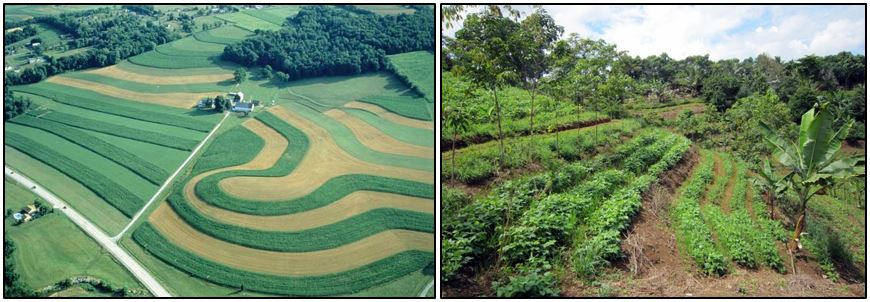
Figure 5: Left: an example of strip cropping following contour lines, alternating Maize with grass in the UK. Right: Small terrace like structures perpendicular to the slope, alternated with trees and Banana (Rwanda).
Strategy 2: prevent runoff from developing. A possible way of preventing runoff to develop into a flood is to interrupt the process. In many agricultural areas this is a preferred way and has lead to stripcropping and creating vegetation obstructions perpendicular to the prevailing runoff direction (see Figure 5), where you alternate between root crops and denser grass or grass like crops. This also prevents erosion from erosion prone crops such as Maize. There is widespread inhabitation, with many small agricultural fields or vegetable home gardens below the tree canopy. In this area there is no large scale agriculture that would benefit form a change in cropping pattern and tillage management. However, infiltration zones at strategic places can be simulated and evaluated. They are a low-cost (relatively low maintenance) solution.
Strategy 3: capturing runoff at an early stage. In this case structures are made (small dams) that are located at strategic points, that capture runoff or stream flow. On the one hand, if these structures are too far downstream the amount of water quickly becomes too much to contain. On the other, the dams do not need to capture all water inf low, only enough to prevent the stream channel from overflowing and developing a flood. Even slowing down water may be sufficient to alter the discharge characteristics, to prevent overflow. A slower release of runoff water from the slopes surrounding the channel, may lead to a lower discharge wave. A model can be used to evaluate different designs and placement of runoff retaining structures. This was in fact the strategy adopted in the Province of Limburg in the Netherlands, where approx. 400 small buffers (several 1000 m3 each) are created to prevent flood and sediment damage downstream. Their dimensions were calculated with the model used in this project: LISEM. Generally, these buffers have an outflow point that slowly releases the water, they do not function as a permanent storage, as permanent water bodies of breed diseases in tropical countries.
Strategy 4: calculate a maximum discharge and alter the channel or add flood defence constructions: dikes and/or retaining walls. A model can be used to estimate the discharge expected that can be used to dimension such engineering structures. When combined with strategy 3, an optimum plan could be made that does not involve very large and costly engineering constructions.
Strategy 5: increase flood resilience of housing: construct houses on stilts or high foundation. There are many examples world wide where people live next to rivers without any problems, and have adapted there way of life.
Strategy 6: do nothing but make sure an insurance system is in place to compensate people for losses.
Step 3. Simulate preferred mitigation strategies
The preferred mitigation strategies are implemented in the model dataset and simulated. In the examples above, three scenarios are simulated in this use case:
- Large water buffers in the flood plain, upstream of locations with a higher housing density. The buffers consist of a buffer, a low earthen dam spanning the floodplain that is 1-2 meter high, and an excavated area upstream of the dam, of for instance 1 meter depth. The river crosses the dam bu the cross section is made that is very narrow, or it is replaced for instance by a box culvert, so that in times of regular flow the buffer is not inundated, while in times of storm discharge the opening limits the discharge and the buffer is filled. An example of a grass storm water buffer is shown in Figure 6.
- A zone is defined along the central river at the bottom of the slope, that has a high infiltration rate. It can be a mixture of strips with natural vegetation, or gravel pits to capture the water. These zones have to have a subsurface drainage towards the river so that they remain relatively dry and there storage capacity is large drain. The exact design is to be determined and adapted to the situation. This is simulated by defining a strip of two grid cells wide on both sides of the central part of the river, that has a high infiltration rate (corresponding with natural forest) and a high storage capacity (water content below field capacity).
|
|
Baseline |
Buffers |
Infiltration |
Wall |
||||
|---|---|---|---|---|---|---|---|---|
|
Event |
Area flooded (m2) |
Build.affected # |
Area flooded (m2) |
Buildings affected # |
Area flooded (m2) |
Buildings affected # |
Area flooded (m2) |
Buildings affected # |
|
06-11-15 |
118700 |
39 |
329700 |
260 |
88500 |
24 |
72600 |
22 |
|
5 year |
|
|
|
|
|
|
|
|
|
10 year |
|
|
|
|
|
|
|
|
|
20 year |
|
|
|
|
|
|
|
|
|
50 year |
|
|
|
|
|
|
|
|
Figure 6: Example of surface storage buffers for rainwater from the UK (Photos from, left: Pinnacle Consulting Engineers, right: Unda Flood Risk Consultants).
- A low wall along both sides of the river of 1 meter high, serving as a small flood barrier. This wall does not have to be everywhere, only in the central part. Upstream there is not enough discharge to cause flooding, downstream the channel is deeper from itself and drains in a wetland.
Step 4. Simulation results
The strategies can be simulated with different rainfall events. It is good practice to include recent events that have happened and caused flooding, and to include design events with a known return period. The real event serves as a reference for the stakeholders as a basis for discussion. The design events with increasing return period serve to find out if the mitigation measures stop working for events beyond a given magnitude.
The most recent rainfall causing know flood was the one of 6 Nov 2015. In the CHARIM project 4 design rainfall events are defined with return periods between 5 and 50 years. Furthermore we have the baseline (no mitigation) and 3 scenario's. In principle that gives us the following simulation matrix with 5 events * 4 scenarios = 20 runs. Doing all the runs is beyond the scope of this use case.
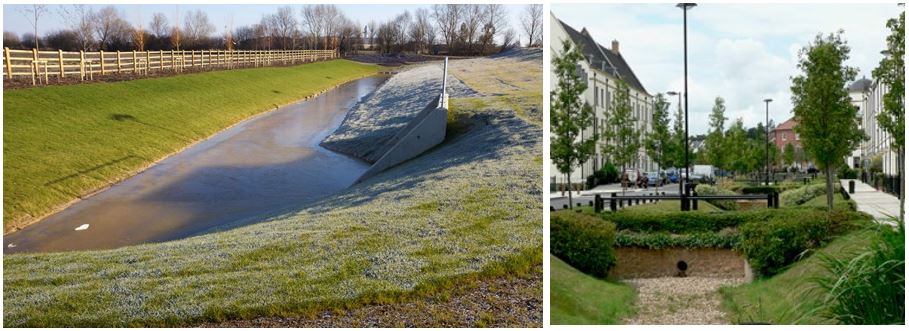
Figure 7: Example of an analysis table. The values on the first row are related to the analysis in this use case. The number of buildings affected is based on an average building size of 100 m2. All values are based on flood water deeper than 10 cm. Also the northern flooded part in the uninhabited area is not counted in this analysis.
NOTE: the examples below are not tested for realism and it may not be possible to realize them. Dimensions or locations may not be optimal, land may be owned privately where mitigation measures are to be installed, or general assumptions on the effects may be unrealistic. These are just examples. In fact it points out how important it is to involve stakeholders in the realization of mitigation measures.
Strategy 0: base line simulation. The flood is simulated with the November rainfall based on the current situation of land use, initial circumstances, buildings and infrastructure. This simulation should be compared to experienced flood extent and levels by the community, and calibrated of necessary. Also the simulations should be extended with the design events for 5, 10, 20, 50 years.
Strategy 1: water buffers. Four water buffers of various size were put in the database, located in the central valley upstream of areas that are flooded in the base line scenario. The idea is to slow down the water and capture part of the flood volume and lower the flood level downstream or alter the dynamics. The throughflow for the river channel is set to 5 m3/s resembling a large box culvert. That means sufficient can pas but it remains in the river channel downstream of the buffers. If the maximum outflow is too small the buffers simply fill up but they are too small to capture an entire flood.This mitigation measure does not work less well. The buffers fill up but eventually water bypasses the them and also backs up in the upstream direction. The end result is that a larger area is submerged than before, the buffers cause the flood water to spread out more. Creating water buffers in this case is possibly costly both in construction but especially maintenance.
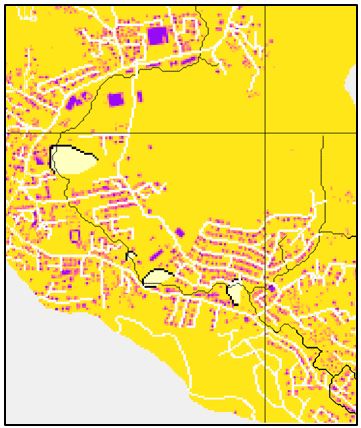
Figure 8: Configuration of four water buffers with varying size as half circular low dykes across the valley floor. Note that these are put in areas where the map does not show housing. This has not been checked with reality. Where the river crosses the barrier a maximum discharge of 5 m3/s has been assumed.
Strategy 2: infiltration strips. The strips absorb up to 500 mm of water (the event is 86 mm in total) so about 6 times the direct rainfall. The effect of this is a reduction of direct contribution of runoff to the river. The effect is quite a strong reduction of the flood water level and therefore successful. A variation can be to have a second infiltration barriers further up slope, parallel to this one, or extend the vegetation strip upstream. If new housing projects are established in the area, such measures could be included in the spatial planning design. The effect is maximized in the model so it should be tried in the field before implementing this. Nevertheless it is worthwhile examining its effect however, creating such a buffer zone is not very complicated. In the field of “Sustainable Urban Drainage Systems†or SUDS, there are many designs available with combinations of gravel pits, small barriers and vegetation strips) and especially the maintenance cost are low.
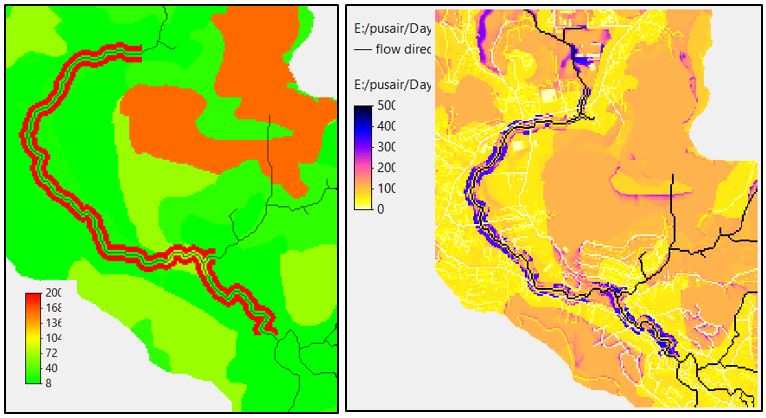
Figure 9: Left: a 20m infiltration strip perpendicular to the river (Ksat in mm/h) and right: Cumulative infiltration (mm) during the November event. The strip absorbs approximately 6 times the rainfall amount.
Strategy 3: Flood defense wall. This seems the best option for this particular case, although events of larger size and intensity might still flood the area. The flood remains between the walls on both sides of the river, effectively making the channel deeper. The channel itself cannot be deepened in most places as the bedrock is visible at the bottom. The wall should have possibilities of drainage of runoff water to the river. The wall works as long as the flood remains inside so this analysis should be followed up by simulations with the design events. Nevertheless once the initial costs are met, there is little maintenance cost. A model analysis should be done with a second type of model, that is better suited for the detailed engineering aspects of this measure. A model like HECRAS is commonly used for this purpose, but also TUFLOW is gaining a lot of recognition recently. Note that additional detailed data must be collected to execute such a model analysis. This could also be part of the tender procedure.
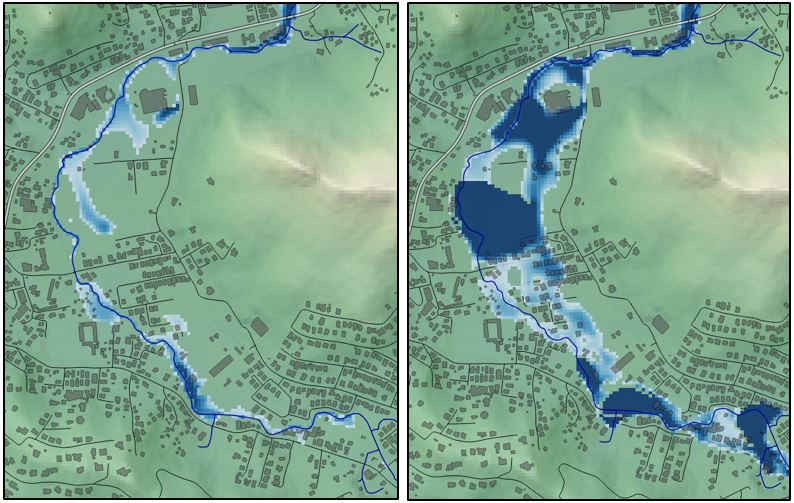
The flood maps of these scenarios are shown in Figure 10. The buffers clearly have a negative effect, spreading out the water and forcing it in areas where before there was no flood. The infiltration zone lowers the overall flood level and decreases slightly the area. The flood wall contains the flooded area in a narrow zone.
Further analyses in this step:
- Repeat the analysis for the design rainfall of 5, 10, 20, 50 year. The flood maps should be printed and checked in the field to see if the mitigation measures are in strategic locations, or if they are in impossible locations. If needed redo the simulations with adapted datasets based on field evidence.
- Do a cost-benefit analysis for the realization, including potential compensation for inhabitants when the mitigation measures infringes on their property, and including an estimated annual maintenance schedule. Possibly a part of the maintenance can be put at stakeholder level, such as unclogging drainage pipes.
 |
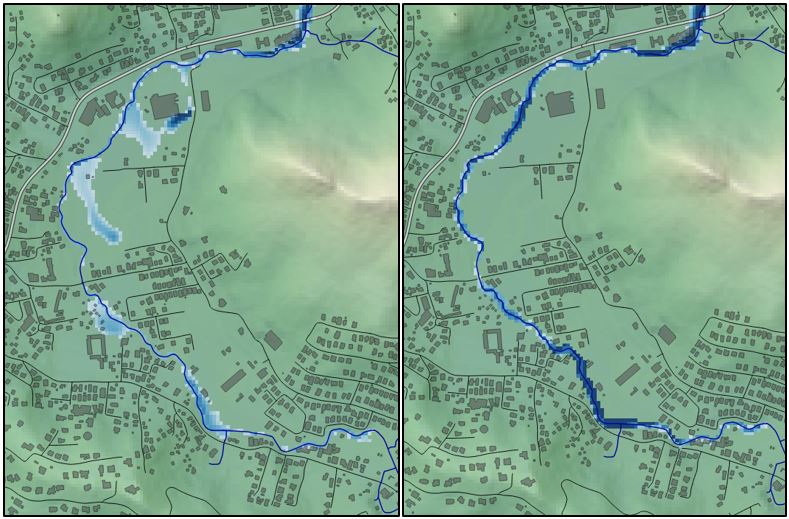 |
Figure 10: Maximum flood level ranging from 0.1 (light blue) to >0.5m (dark blue) for the November event as an example. Top left: base level flood, top right: water buffers (scenario 1), bottom left: infiltration zone (scenario 2), bottom right: flood wall (scenario 3).
Step 5. Evaluation
At this stage, the strategies are not compared to the field situation, to see if and how they can he implemented exactly. A site investigation would be necessary. Nevertheless some preliminary conclusions can be drawn.
The buffers in strategy 1 clearly do not work. They spread out the water more than the natural flood process, and even endanger areas that are outside the flood before. A may be that a careful balancing of minimum discharge leaving the buffer and water contained in the buffer may cause less problems, but in principle the amount of discharge in the central valley is already too large to be contained in this way. Multiple small buffers on the slopes (capturing runoff water in an earlier stage) also do not seem feasible, because the runoff adds to the stream flow along the entire length of the river channel as a diffuse process, there are no clear contributing upstream areas that can be captured. This leads to strategy 2: infiltration strips as a way to interrupt the runoff. The effect is a substantial interception of runoff, which could be more if a second buffer strip is established further away (not tested here). Further simulations with different magnitude rainfall needs to be done to test the upper limit of the capacity of their infiltration zones. Finally scenario 3 is attractive because it uses relatively little land to be established, but it also needs a site investigation. If the wall is created as a channel (so based on a lining of the river bed) the bed should not be made narrower than it is, and it may have substantial costs. If a flood wall is established a small distance away from the channel, it needs sufficient foundation to be strong enough and should not be erodible.
The results should be discussed with all stakeholders involved, so that it is clear what will be done, how long it will take and to what level people and property are now protected. Based on the outcome of these discussions and a final draft catchment development plan, a tender can be written. It is possible, and even likely, that steps 2 to 4 have to be done several times in an iterative process, as more information becomes available.
Conclusions:
The Bois d'Orange area is a difficult area to establish flood mitigation, because the hazard exists along the entire river stretch (see the national flood hazard map) and so mitigation measures cannot concentrated in a clear source area. Other locations clearly have a hazardous area in the township close to the sea such as forn instance Soufriere or Canaries, with a relatively uninhabited upstream area. Those can probably be more easily protected by upstream measures. The Bois d'Orange catchment needs mtitigation measures along the entire middle stretch of the river, and several types of mitigations are tested with the integrated flood model LISEM. A model that influences hydrology is needed for such an analysis, because of the mitigation measures in integrated catchment management intend to interrupt various hydrological processes. As indicated above, the entire procedure should be stakeholder based, to manage expectations and create a form of ownership and investment in to the mitigation measures.
Last update: 22-06-2016