

This use-case will show you the steps required to utilize national census data to generate indices for vulnerability at the national scale. This is illustrated with an example from Grenada where the national census data was obtained for the Enumeration Districts (ED). They were organized in a GIS database, as a series of attributes linked to a vector map of the ED's. The actual vulnerability assessment was carried out using Spatial Multi-Criteria Evaluation, with a specific module that is available in the ILWIS software. This use case shows you the steps required to do this and you can also actually follow the exercise with a dataset that is available for Grenada.
Keywords:
Census data; vulnerability assessment; national scale; Grenada
| Before you start: | Use case Location: | Uses GIS data: | Authors: |
|---|---|---|---|
|
Read the relevant chapters from the Methodology book , specifically chapter 5.3 Read a larger report on this topic by Mujeeb Alam. |
The use-case is based on a dataset from Grenada |
Yes, this use case requires GIS data to carry out the actual national scale vulnerability assessment
|
Cees van Westen and Mujeeb Alam |
Introduction:
Multiple definitions and different conceptual frameworks of vulnerability exist, because several distinct groups have different views on vulnerability. Academic staff from different disciplines, disaster management agencies, development corporations, climatic change organization etc. An overview is given on the website of the ProVention Consortium and in the book on Vulnerability edited by Birkmann (2006). Several definitions are given below:
- The intrinsic and dynamic feature of an element at risk that determines the expected damage/harm resulting from a given hazardous event and is often even affected by the harmful event itself. Vulnerability changes continuously over time and is driven by physical, social, economic and environmental factors (UNU-EHS, 2006 ).
- The potential to suffer harm or loss, related to the capacity to anticipate a hazard, cope with it, resist it and recover from its impact. Both vulnerability and its antithesis, resilience, are determined by physical, environmental, social, economic, political, cultural and institutional factors (Provention Consortium, 2007).
- Vulnerability is related to the characteristics and circumstances of a community or system, these characteristics and circumstances make community or system susceptible to hazard and cause loss. There are many aspects of vulnerability, arising from various physical, social, economic, and environmental factors. Examples may include poor design and construction of buildings, inadequate protection of assets, lack of public information and awareness, limited official recognition of risks and preparedness measures, and disregard for wise environmental management (UN-ISDR, 2009).
- Vulnerability = (Exposure ) + (Resistance) + (Resilience)
With: Exposure: at risk property and population;
Resistance: Measures taken to prevent, avoid or reduce loss;
Resilience: Ability to recover prior state or achieve desired post-disaster state.
Coping capacity:"The ability of people, organizations and systems, using available skills and resources, to face and manage adverse conditions, emergencies or disasters" The capacity to cope requires continuing awareness, resources and good management, both in normal times as well as during crises or adverse conditions. Coping capacities contribute to the reduction of disaster risks (UN-ISDR, 2009).
Resilience: the ability of resistance, absorption, adaptation and recovery of a system from the effects of hazard, including preserving and restoring the basic structures and functions. This depends on the necessary resources and organizing capability for the community before and after a disruptive event. Building disaster resilience can help community to be better prepared to the disasters and recovery fast after the disasters (UN-ISDR, 2009). (Watch an introduction video about disaster risk reduction and resilience)
What is common from the definitions is that vulnerability is: Multi-dimensional (e.g. physical, social, economic, environmental, institutional, and human factors define vulnerability);Dynamic (vulnerability changes over time); Scale-dependent (vulnerability can be expressed at different scales from human to household to community to country resolution; Site-specific (each location might need its own approach). And resilience is related to different phases before and after a disruptive event, including the preparation before disasters, impact of disasters and recovery after disasters and long time impact of disasters. One of the relationships between vulnerability and resilience will be discussed below in paragraph "framework of vulnerability".
In the last decades different frameworks on vulnerability were developed. In this paragraph we will look at a number of them. A good overview is given by Birkmann, 2006.
A vulnerability index map describes susceptibility of a community to natural hazards (Dewan, 2013). An index map is derived by mathematically combining different indicators that describes the relative state of the vulnerability (Catherine, 2010) and usually being measured at a scale 0 (no vulnerable) to 1 (complete vulnerable). The values in between describe different vulnerability levels. Similarly, a resilience index may also be constructed to measure resilience of a community or society.
Census data are one of the main sources of information for generating vulnerability maps. This data has widely been used by experts in vulnerability assessment related to natural hazards (see chapter 3 of the methodology book). It is the main source of demographic and socio-economic data in most countries. However, the type, scope, and level of detail may vary from country to country. Census data is usually collected at the household level and due to its confidential nature, it is usually aggregated to a higher level (for instance census tracts, or enumeration districts) and census information is generally only shared at that aggregated level. In some of the countries (e.g. Dominica) census data is not shared at all, as the statistics office is not willing to share this sensitive data with other government organisations.
As it is very costly to make a national census, in most of the countries census data is collected every 5 or 10 years. This means that the information based on a census from many years ago might be outdated, especially when major events (such as the occurrence of a Hurricane have taken place). The last census in Grenada for instance was in 2011, which is still not so long ago, and in the period after the last census no major event had occurred. This would have been quite different if a census before the occurrence of Hurricane Ivan (in 2004) was only available. The damage resulting from that event and the changes that occurred after that event in terms of demographic, physical and socio-economic conditions would make the use of a pre-hurricane census quite useless.
In the Caribbean censuses are carried out using a large number of enumerators, which go from household to household in their assigned enumeration district, without indicating the spatial location of the inquiries on their forms. This means that it is basically not possible afterwards to geo-locate the census to specific buildings, and to use the census information also for local scale vulnerability and risk assessment. There are plans to change this, for instance in Saint Lucia, where a new census is planned with the held of mobile devices including the positioning of the households.
Objectives:
The main objective of this use case is to indicate and demonstrate the steps required to use a national census database as an input for national scale vulnerability assessment, illustrated with an example from Grenada.
Specifically this includes the following sub-objectives:
- Evaluate the various items in the census, and select those that might be useful indicators for the national vulnerability assessment
- Determine the standardization of these indicators.
- Create a criteria tree for vulnerability assessment
- Weight the indicators
- Produce a vulnerability map.
Flowchart:
The following animation gives the flowchart that is used in this use-case for using census data as input for a national vulnerability assessment.
Use case study area description:
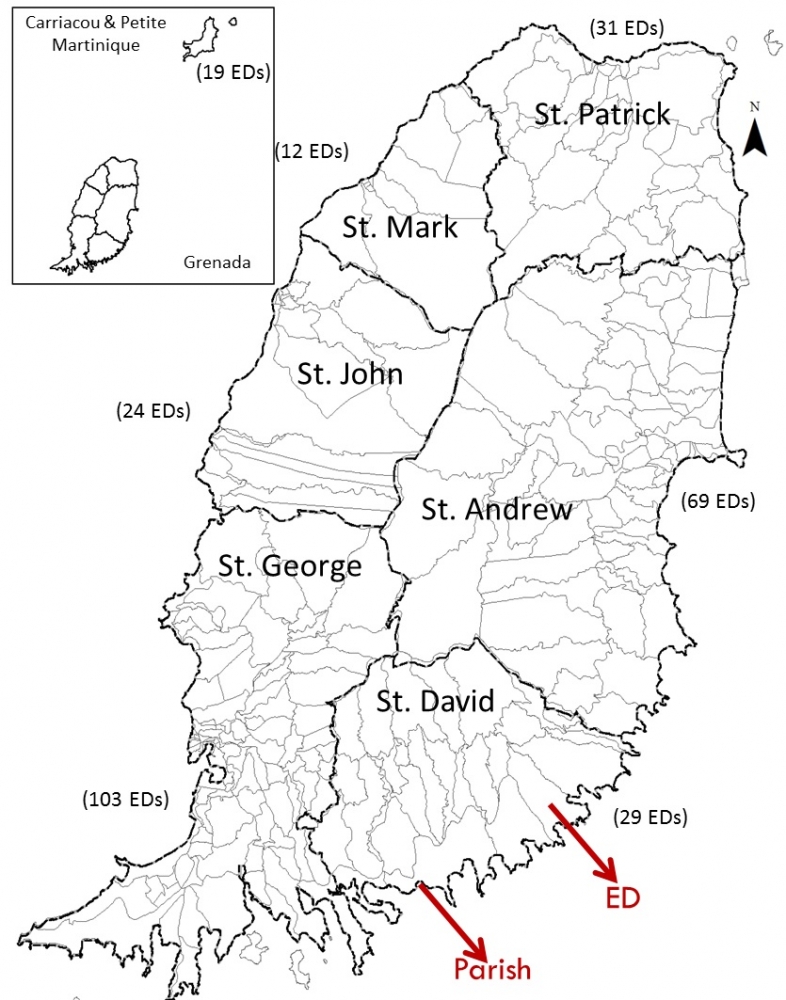
The use case study area is Grenada (main Island). Grenada is subdivided administratively into 8 Parishes of which 6 are on the main island (St. George, St. John, St. Mark, St. Patrick, St. Andrew and St. David) and two on the island of Carriacou and Petite Martinique. For the purpose of the census, the main island is subdivided in to so-called Enumeration districts. An Enumeration District (ED) is a polygon consists of a certain number of houses that is specially established to facilitate census survey. Grenada is sub-divided into 287 EDs including two small islands. However, an ED is not similar to an administrative unit, and the boundaries of the E$Ds are not directly compatible with those of the Parishes. Furthermore, there is fixed number of households in each ED. The minimum number of households in a ED based on available data varies between 3 and 467, with an average of 126 households per ED.
The latest census data for the study was provided by the Central Statistical Office (CSO), Ministry of Finance, government of Grenada. The statistics office collects a large set of data related to demographic characteristics, housing, health, education, income, crime etc. which is stored it in a relational database for analysis and reporting.
Figure 1: Overview of Enumeration Districts (Census units) and Parishes (Administrative units in Grenada.
Data requirements:
The Census is done household-by-household using a 15 page interview sheet with 101 questions, where a large number of characteristics are written down. In the table below an overview of the census data is presented that was shared by CSO for the whole country. The data was aggregated at ED level. The main drawback in this data was that it was not spatially located. No building coordinates were collected during the census survey. For, instance, it is not clear, how the population is spatially distributed over the island. Geo-locating these buildings and linking all census data physically on the ground attempted in some small areas, but turned out to be too complicated and time consuming. Therefore the analysis was carried out at the national scale, with the Enumeration Districts as mapping units.
|
No. |
Dataset |
No. |
Dataset |
|---|---|---|---|
|
1 |
Households |
16 |
No. of bed rooms |
|
2 |
Dwelling types (10 types) |
17 |
Access to internet (4 options) |
|
3 |
Material of wall (9 types) |
18 |
Vehicles (for private use) |
|
4 |
Roofing type (7 types) |
19 |
Garbage disposal method (7 types) |
|
5 |
Construction period |
20 |
Contents (16 household items) |
|
6 |
Dwelling insurance |
21 |
Disability (7 types) |
|
7 |
Contents insurance |
22 |
Health problems (14 types of illness) |
|
8 |
Ownership of dwelling (7 categories) |
23 |
Health insurance |
|
9 |
House mortgage (monthly payment) |
24 |
Education (17 categories) |
|
10 |
House rent |
25 |
Sources of livelihood (12 categories) |
|
11 |
Rent period |
26 |
Water supply (7 types ) |
|
12 |
Toilet facility (5 types) |
27 |
Drinking water source (8 types) |
|
13 |
Source of lighting (5 types) |
28 |
Use of fuel for cooking (7 types) |
|
14 |
No. of rooms |
29 |
Enumeration District (shape file) |
|
15 |
Demographics(children, elderly, population) |
|
|
Analysis steps:
Step 1: Collecting the input data
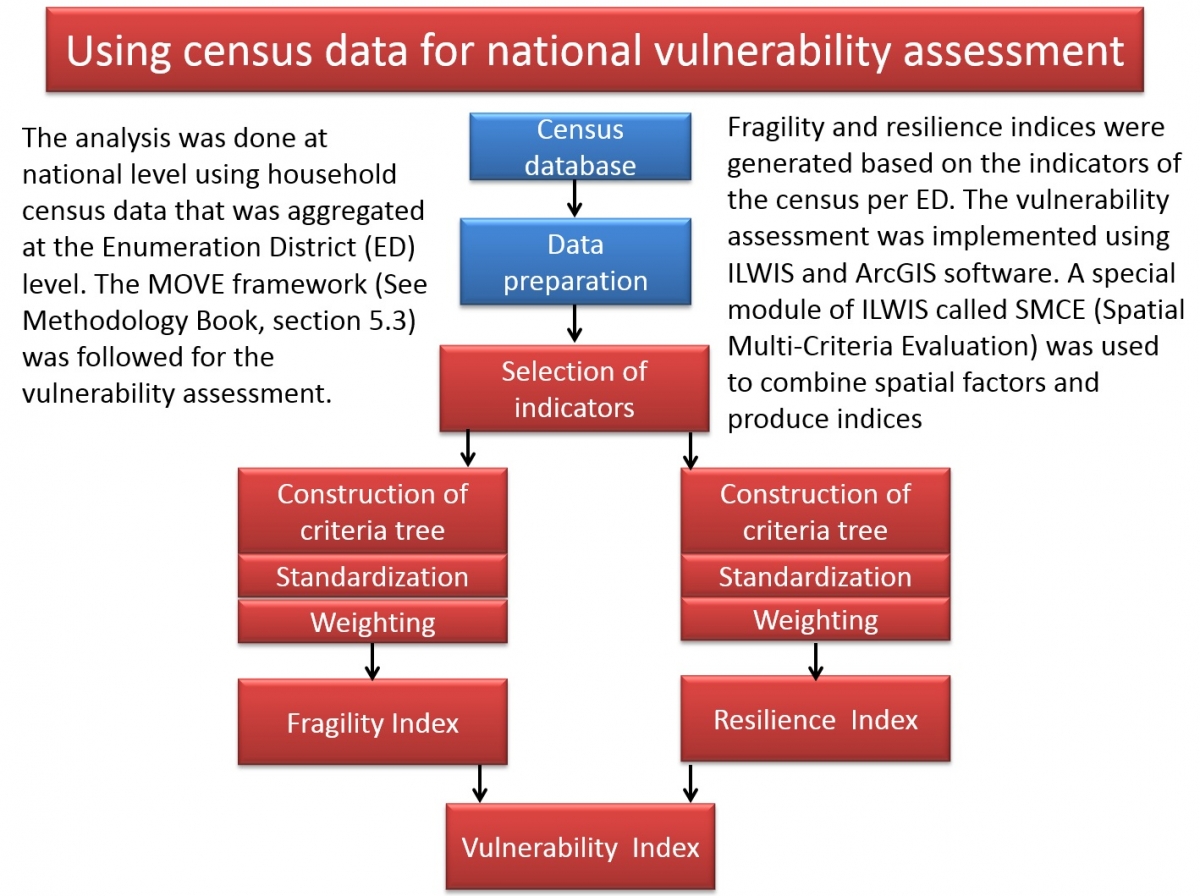
The analysis was done at national level using household census data that was aggregated at the Enumeration District (ED) level. The MOVE framework (See Methodology Book, section 5.3) was followed for the vulnerability assessment. Susceptibility (fragility) is defined as the weaknesses and lack of strength within a society or an individual to withstand hazard impacts, whereas resilience (capacity) considers the positive factors within a society or an individual which support in mitigating and recovering hazard impacts. Fragility and resilience indices were generated based on the indicators of the census per ED. The whole process of vulnerability assessment was implemented using ILWIS and ArcGIS software. A special module of ILWIS called SMCE (Spatial Multi-Criteria Evaluation) was used to combine spatial factors and produce indices.
Step 2: Selecting indicators and defining criteria
Vulnerability at a national level is usually characterized and measured using indicator based methods and in the literature a wealth of examples is available (see methodology book section 5.3), where indicators are used to produce different indices. Birkman (2006), defined vulnerability indicator for natural hazards as a variable which is an operational representation of a characteristics or quality of a system able to provide information regarding the susceptibility, coping capacity, and resilience of a system to an impact of an albeit ill-defined event linked with a hazard of natural. With reference to this research the crucial step was the identification of suitable indicators out of available datasets. Since, the quality of composite results hinges on quality of the individual variables that were included therefore, the chosen indicator must be relevant, robust, and representative (Cutter, Burton, & Emrich, 2010). The indicators were selected and grouped into two main vulnerability components; Fragility and Resilience that potentially exhibits related characteristics. The broad selected indicators are age, gender, socio-economic status, and health, which are also often found in the vulnerability assessment literature.
The main considerations for the selection of variables were;
- their relevance to the specific theme based on the literature
- their relevance with respect to the study area,
- quality of available dataset, and
- potential co-linearity among variables.
For instance, the source of drinking water is not included because all EDs have more or less similar water sources ( i.e. public pipe into or outside their houses). Similarly, fuel for cooking, sources of lighting were not considered important as indicators due to their low variations. The number of bedrooms was chosen instead of the number of rooms, which is a better indication for the socio-economic status. Ownership status provides similar information with house rent and house mortgage payments etc. These variables were further grouped into specific themes that are logically similar and exhibit specific aspects of fragility and resilience. For instance, insurance, higher educational levels and access to internet are grouped under social resilience. A list of selected indicators is presented in the Table below. More descriptions on the selection of relevant indicators can be found in the Methodology book, section 5.3.
|
Input dataset |
Indicator |
Criteria/class |
Expression/ unit (at ED level) |
|---|---|---|---|
|
Age |
Children |
Under age 5 |
Percent of children |
|
Age |
Children |
Over age 64 |
Percent of elderly |
|
Gender |
Women |
Female |
Percent of female |
|
Material of outer walls |
Type of wall (material) |
3 classes: Strong walls (concrete/ concrete blocks, stone, brick) |
Percent of dwellings falling in a defined category |
|
Weak walls (wood, wood & concrete) |
|||
|
Very weak walls (plywood, plywood & concrete, makeshift, other) |
|||
|
Construction period |
House age |
3 classes: New houses (2007 to 2011) |
Percent of dwellings falling in each category |
|
Old houses (1980 to 2006) |
|||
|
Very old houses (Before 1980) |
|||
|
Dwelling insurance |
Insurance
|
More dwellings with insurance in a ED; more resilient (fast recovery) |
Percent of dwellings with insurance |
|
Content insurance |
Insurance
|
More households with items (household) with insurance in a ED; more resilient |
Percent of dwellings with insurance of household items |
|
Health insurance |
Insurance
|
More persons with health insurance in a ED, more resilient (fast recovery) |
Percent of persons with health insurance |
|
Disability |
Disability (7 types) |
More persons with health problems in a ED; higher fragility |
Percent of all disabled persons in each ED |
|
Health |
Illness (14 types) |
More persons with disability in a ED; higher fragility |
Percentage of persons with illness |
|
Education |
Educational level
|
4 categories based on level of education attained Higher level (Bachelors and higher including related certifications /diploma) |
Percent of persons having certain level of education |
|
Tertiary level (under graduation and related certifications/diploma) |
|||
|
Primary level |
|||
|
None - no education/certification |
|||
|
Internet |
DRR awareness, communication |
More households access to internet more resilient (hazard anticipation) |
percent of dwellings with internet facility |
|
Nature of dwelling ownership |
Building ownership / tenure |
4 classes: Full ownership |
Percent of households with ownership type |
|
Owned with mortgage |
|||
|
Renters & leased |
|||
|
Squatted |
|||
|
Livelihood source |
Income: A proxy indicator of socio-economic status/ personal wealth based on stable/high livelihood means and relatively unstable/low livelihood options. |
2 classes: Stable income sources (employment, overseas pension, money from abroad, investment, savings) |
Percent of persons in each category |
|
Unstable income sources (pension local, disability benefits, social security benefits, local contribution from friends/relatives, overseas contribution from friends/relatives) |
|||
|
Bedrooms |
Income: A proxy indicator of socio-economic status/ personal wealth, Sleeping space (crowdedness) |
3 classes: Dwellings with 4 or more bedrooms |
Percent of dwellings in each category |
|
Dwellings with 2 to 3 bedrooms |
|||
|
Dwellings with 1 bedroom |
|||
|
Vehicle |
Income: A proxy indicator of socio-economic status/ personal wealth and potential mobility during emergency |
More dwellings with vehicles for private use in a certain ED considered wealthy area and thus lower vulnerability. |
percentage of dwellings (relative to HH ED) with vehicles in ED |
Step 3: Creating the criteria trees
Spatial Multi-Criteria Evaluation (SMCE) is a technique that helps users in making improved decisions with respect to a given goal. It is based on Analytical Hierarchical Process (AHP) (See Methodology Book, section 5.3). Because of its flexibility many organizations are using AHP in the decision making process and it is already been used for risk assessments.
The generation of a criteria tree starts with the formulation of the overall goal. Then sub-goals are defined to break the problem into sub-components, which are organized as branches of the criteria tree (or groups), which could have sub-groups. In the lowest level the indicators are defined, which are linked with related factor maps (which are called criteria). Thus a tree-like structure is formed.
In case of this study there were two main goals: fragility index and resilience index . The implementation of the criteria trees for the fragility index and resilience index using selected indicators and criteria are presented in the figures below along with weighing scheme.
After completing the criteria tree structure, relevant input maps are assigned for each criteria. The next stage was the standardization/normalization of all input maps. Standardization is a process in which values of input maps are scaled between 0 and 1. All input maps for each criterion were standardized using "˜Goal' function. This function standardizes the input values with a linear function that uses a specified minimum and maximum value. Any value specified as "˜minimum' value will be standardized to 0 (including any smaller numbers) and any value specified as "˜maximum' will get 1 (including any larger numbers). All other values will be standardized between 0 and 1. The basic reason for using "˜Goal' function was the fact that percentages for most of the criteria values did not start at 0 or end at 100. Also, this way it was possible to control possible outliers. After carefully analyzing values of each criterion minimum and maximum values were set in the function for the standardization.
In the next stage, weighing of factor and groups was completed. Assigning weights is needed in order to indicate the relative importance of factors with respect to the main goal and sub goals. In the ILWIS SMCE module, there are three methods for assigning weights namely; Direct method, Pair-wise comparison, and Rank order.
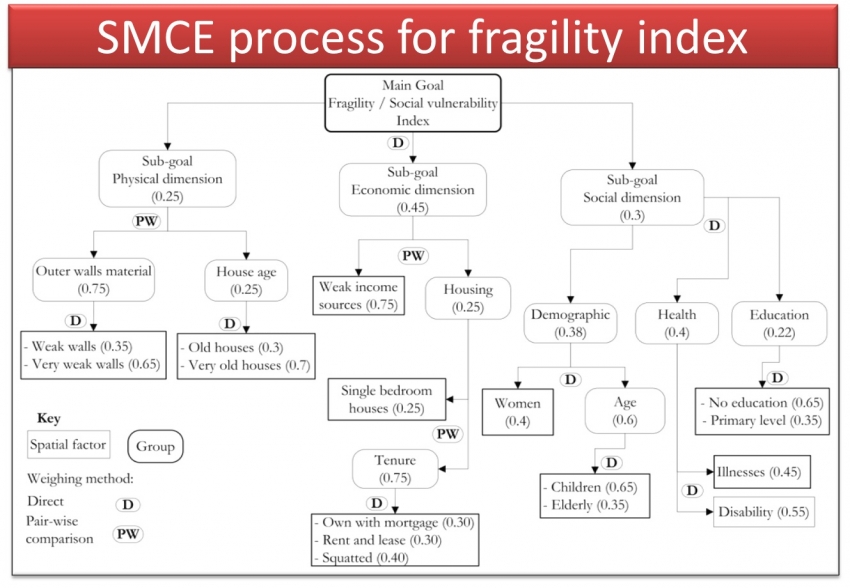
Both Direct and Pair-wise comparison methods were employed for weighing. For instance, three sub-goals under fragility; physical, social, and economical were directly assigned weights. Economical aspect is given a higher priority over other two, because, a person with low income may not be able to invest in disaster risk reduction interventions (such as insurance, retrofitting house etc), or will inhibit in recovery process following a disaster. Similarly, wall materials of a building are far more important than building age. Irrespective of the age, the building will collapse if the material is not strong enough to withstand the force of nature. Very old houses are considered to be weaker, especially if they are not well maintained thus more likely that they get damage in case of any hazard event such as earthquake, hurricane. Disability and other illnesses were treated more or less the same. However, disability is a permanent vulnerability, which merits relatively higher weight. There were 7 different types of disabilities recorded in the survey. Children are more vulnerable than aged due to their limited physical strength, experience etc. They were weighted 0.65 as compared to elderly (0.35). Nature of house ownership and livelihood options are stronger factors that influence vulnerability. People who own a house are generally less vulnerable as compared to people paying rents/lease or living in informal settlements. Moreover, weak or unstable income sources (consisting of local pension, disability benefits, social security benefits, local contribution from friends/relatives, and overseas contribution from friends/relatives) are indication of low socio-economic status, which results increased vulnerability. Housing is awarded 0.4 and weak livelihood options 0.6 weights.
The overall implementation of the Spatial Multi-Criteria tree including the weighting scheme (methods and actual assigned weights) are shown in the figure below for the Fragility Index.
Figure 2: Overall structure of the criteria tree for generating the fragility index
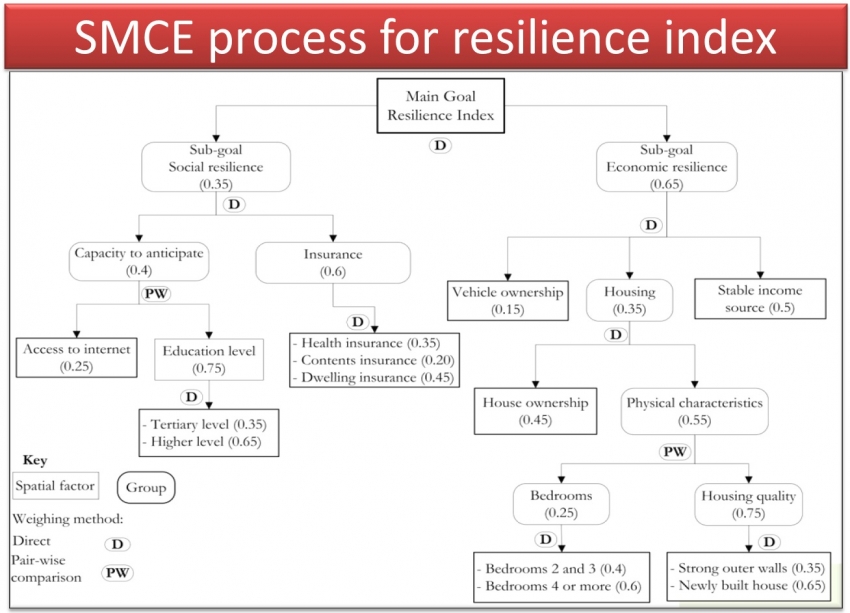
With the respect to resilience index, economic resilience was assigned a higher weight (0.6) than social resilience (0.4) as shown in the figure below. A stable income and better housing facilities are considered two important factors in this regard. Different livelihood options such as employment, overseas pension, money from abroad, investment, savings were grouped together as stable income sources as opposed to weak income options, which were included in the fragility index. Stable income was assigned 0.45 weights as opposed to 0.4 for housing. In Grenada, over 75 % of the people owns a house, but still there is poverty due to unemployment. In this context, a good stable income source merits relatively higher weight. The physical vulnerability of a building will be minimal if it is constructed from good building material such as concrete, brick or stone. Insurance under social resilience is given higher priority over anticipation (comprises: education and access to internet) and assigned a higher weight (0.6). Insurance is an important instrument with respect to fast recovery following a major disaster. Education has its own significance. However, having a higher educational degree does not automatically mean that necessary risk reduction measures are in placed at the household level. Education level was awarded 0.75 points through a pair-wise comparison with internet
The overall implementation of the Spatial Multi-Criteria tree including the weighting scheme (methods and actual assigned weights) are shown in the figure below for the Resilience Index.
Figure 3: Overall structure of the criteria tree for generating the resilience index
Step 4: Generating the final maps
After generating the Fragility and Resilience criteria trees, with selection of indicators, standardization and weighting, coomposite index maps were generated in GIS. These maps were then classified based on Z-values as proposed by Cutter et al., (2003). The Z-score or Z- value indicates how many stander deviations (Std Dev) an observation is above or below the mean. The mean and standard deviation values were 0.39 & 0.076 and 0.40 & 0.109 for fragility and resilience respectively.
Results:
The resulting fragility and resilience index maps are shown below.
Figure 4: Fragility and Resilience Index maps for Grenada generated using Spatial Multi-Criteria Evaluation with census data as main input.
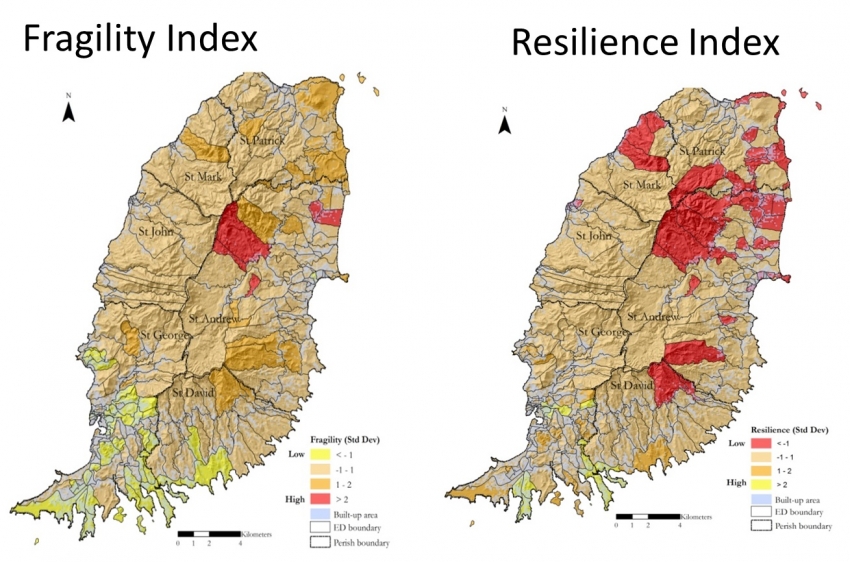
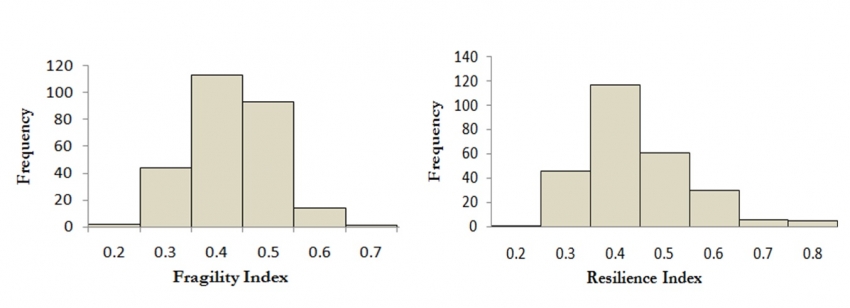
What do these maps convey and what interpretation can possibly be made? The resilience index shows that the overall household's resilience in Grenada is relatively low (small mean value) except for a very few enumeration districts in the south of the Island. There is overall a uniformity in the resilience level throughout the country. About 14 % (37) of the EDs are falling in the red zone as their standard deviation is larger than negative 1. Similarly, only about 16 % of the EDs (42) are in the yellow zone, with a positive standard deviation larger than 1. Whereas, the majority (70%) of the EDs are between -1 to +1 Std Dev. The histogram based on the actual index values is also presented in the figure below. Over 100 EDs with resilience index in the range 0.40.
Surprisingly the overall fragility within the EDs is also not high. Based on the available data most EDs both have lkow resilience and low vulnerability, which is remarkable. Over 69 % of theEDs (185) are in the range of -1 and +1 Std Dev., 30 EDs (11%) are between 1 and 2, whereas, only 2 % (6 EDs) are more than 2 Std Dev. (red color) which is the highest vulnerability class. Relatively less fragile or relatively more resilient EDs are in the south (St. David and St. George parishes). They are only about 17 % (46) of the total. The histogram of actual index values shows that most ED have fragility index between 0.4 and 0.5
Figure 5: Distribution of values for the fragility and resilience index.
Conclusions:
Recent census data was used to examine the vulnerability by producing fragility & resilience indices (vulnerability index). Although, the assessment was undertaken at the national level by using aggregated data of enumeration districts (EDs), the results provide insight on the overall household's resilience and fragility. Since, no other auxiliary data was included/available to define better indicators, care should be taken in using such census data alone, as it only reflects the information at household level, and doesn't consider other aspects such as community-based organisations, social networks, early warning systems etc.
Census data are a good source of information on various aspects that are particularly needed to produce a social vulnerability index. The data is available on housing, socioeconomic, health, and education apart from demographic information. The major drawback of this dataset is that it is not geo-located i.e. no spatial information of buildings is available. The overall quality of the census data was considered reasonable based on a number of samples that were taken in the areas. It was complete but is difficult to make any statement about the actual content (substance) of the data because it is difficult to ascertain how accurately data was collected by survey teams. Some inconsistencies were found in some datasets. For example, the number of households on rent/lease was not matching with the number of households paying rent/lease or those on mortgage. In some EDs, people didn't reply to specific questions, so large number of not stated figures are present. Similarly, there were visible differences in some EDs, where the number of households (dwellings) in the census data for a particular ED was not matching with the building footprints for the respective ED. It was also evident when cross checked with satellite imagery. In this context, there will always be some uncertainties when using census data.
According to the Cutter et al., (2003), there is general consensus within the social science community about some of the major factors influencing social vulnerability they are included, lack of access to resources (information, knowledge, technology); restricted access to political power and representation; social capital; building stock and age; physically limited individuals; and type and density of infrastructures and lifelines. Conflicts arise when selecting variables to represent these broader themes (Cutter et al., 2003). Further, Cutter (2003) compiled a detailed list of variables that are frequently found in the literature and pointed that among generally accepted factors are age, gender, race, and socioeconomic status. A research (Catherine, 2010) on vulnerability analysis to volcanic hazards for St. Vincent (Caribbean) selected similar variables for social vulnerability analysis based on interview with the local community. The suggested variables were disability; poverty; health; livelihood; education; house; Isolation; proximity; transport; and dependents (elderly and children).
By evaluating both fragility and resilience indices it can be concluded that generally there is a uniformity in household's vulnerability and underlying conditions across Grenada. In general there is no higher level of resilience nor fragility. There is an implicit assumption that communities which are low in resilience are also high in vulnerability (Bergstrand et al., 2014). It seems this assumption is proven in this area as there is no large difference between resilience and social vulnerability. However, the results indicate that EDs in the south, mostly in St. George's are doing better in terms of resilience as ratio between resilience to fragility is quite high compared to EDs in the north. This may be the fact that south part is relatively better developed due to tourism and socio-economically relatively more stable.
Which message planners can take home from these indices and how this information could possibly be used to support planning? The results of vulnerability assessment are important as they can be used to identify communities that are susceptible to suffer damage (Müller et al., 2011) and identify underlying factors contributing in vulnerability conditions (Dewan, 2013; Tate, 2012). However, it is pertinent to note that they can't provide any direct solution of any underplaying vulnerability issue, rather they are only indicators of possible presence of vulnerability, which may be required to consider in the planning (Dunning & Durden, 2011). Moreover, such instruments are particularly useful to initiate discussions on prioritizing areas for possible risk management and development planning. For instance In Grenada, the physical planning unit has main responsibility of development planning and producing national level and region-wise plans for future development. These maps are good source for starting their discussions in-house and stakeholders for prioritizing vulnerable regions for future development and thereby vulnerability reduction. Also, each indicator or group of indicators (sub-theme) could be analysed independently for each community and more specific actions can be taken for vulnerability reduction. For example, one ED is identified as most vulnerable with respect to squatted dwellings. The physical planning unit may take note of it and determine underlying cause of high concentration of squatting dwellings in this specific area. Similarly, fragility with respect to physical vulnerability (sub-theme), there are many EDs found in the north, where relatively physical vulnerability is quite high. It implies that dwellings are old and building walls are very weak. In those communities, government may investigate further and take some kind of targeted measures to reduce their vulnerability. Also, with respect to emergency planning, one could expect that those communities may affect relatively more in case of a hazard event such as hurricane.
References:
Most of the references have a link where you can access a pdf opf the document.
Birkmann, J. (2006). Indicators and criteria for measuring vulnerability: theoretical bases and requirements. In J. Birkmann (Ed.), Measuring Vulnerability to natural hazards: Towards disaster resilinet socities. United Nations University Press. Link
Birkmann, J. (2007). Risk and vulnerability indicators at different scales:Applicability, usefulness and policy implications. Environmental Hazards, 7(1), 20“31. Link
Catherine, J. L. (2010). Analysing Vulnerability to Volcanic Hazards"¯: Application to St . Vincent. University Collecge London. Link
Cutter, S. L. (1996). Vulnerability to environmnetal hazards. In Progress human geography (pp. 529“539). Link
Cutter, S. L., Boruff, B. J., & Shirley, W. L. (2003). Social vulnerability to environmental hazards. Social Science Quarterly, 84(2). Link
Cutter, S. L., Burton, C. G., & Emrich, C. T. (2010). Disaster resilience indicators for benchmarking baseline conditions. Journal of Homeland Security and Emergency Management, 7(1). Link
Dewan, A. M. (2013). Floods in a megacity: Geospatial techniques in assessing hazards, risk and vulnerability. (A. M. Dewan, Ed.)Floods in a Megacity Geospatial Techniques in Assessing Hazards, Risk and Vulnerability (p. 219). Dordrecht: Springer. Link
MOVE. (2011). Assessing vulnerability to natural hazards in Europe¯: From Principles to Practice A manual on concept , methodology and tools (p. 48). Bonn. Link
Müller, A., Reiter, J., & Weiland, U. (2011). Assessment of urban vulnerability towards floods using an indicator-based approach “ a case study for Santiago de Chile. Natural Hazards and Earth System Science, 11(8), 2107“2123. Link
Papathoma-Köhle, M., Kappes, M., Keiler, M., & Glade, T. (2010). Physical vulnerability assessment for alpine hazards: state of the art and future needs. Natural Hazards (Vol. 58, pp. 645“680). Link
Papathoma-Köhle, M., Keiler, M., Totschnig, R., & Glade, T. (2012). Improvement of vulnerability curves using data from extreme events: debris flow event in South Tyrol. Natural Hazards, 64(3), 2083“2105. Link
Reliefweb. (2004). Grenada Hurricane Ivan Flash Appeal Oct 2004 - Mar 2005 - Grenada | ReliefWeb. Retrieved February 04, 2015. Link
Sagara, J., & Saito, K. (2013). Risk assessment and hazard mapping. Washington, DC: The World Bank. Link
Tate, E. (2012). Social vulnerability indices: a comparative assessment using uncertainty and sensitivity analysis. Natural Hazards, 63(2), 325“347. Link
World Bank. (2004). Grenada preliminary assessment of damages of Hurricane Iva (p. 12). Link
World Bank. (2005). Grenada: A nation rebuilding - An assessment of reconstruction and economic recovery one year after Hurricane Ivan (p. 70). Link
Last update: 07-04-2016