

Introduction
The Caribbean islands are frequently plagued by floods as a result of heavy rainfall during tropical storms and hurricanes. These floods are termed "flash floods", from their rapid onset and relatively short duration, and are directly caused by runoff produced during a rainfall event. The islands mostly consist of a central mountain range, with small catchments ranging from the center part of the island to the sea. These catchments can be anything from 5 to 50 km2 in size. Hydrologically speaking, each island is made up of up to 50 larger catchments, with various types of land cover and soils, determining the hydrological behavior.
In tranquil conditions the rivers have a low baseflow level, fed by local groundwater bodies constrained to the valleys. During a tropical storm, the soils on the slopes quickly saturate and literally overflow, or the rainfall intensity can be so high that the infiltration capacity of the soil is not sufficient. Hence severe overland flow and erosion may take place, leading to flooding along the river channels. The water level can rise from 0.5m to more than 4 m at given locations, within 2 hours' time (sometimes much less) from the start of the rainfall. Since many valleys are inhabited, especially near the coastline, these flash floods can cause great damage and casualties. The shape and condition of the river channel has a large influence of the flood behavior: small and narrow channels quickly overflow, or channels that have a decreased size because of sediment may overflow much more quickly.
Flooding circumstances can be aggravated by man-made decisions or behavior such as:
- channels that are blocked by debris (e.g. at bridge locations) and are not regularly cleaned;
- channels that are diverted to circumvent habitation, leading to unnatural bends and flow paths that cannot handle extreme discharges;
- culverts and bridges at road crossings may be under-dimensioned, leading to backflow and rising water levels;
- Individuals extend their property into the river channel flood plain, thus narrowing the potential flow path.
It is a mistake to think that only the lowest areas in a catchment, i.e. the villages on the coastline, are subject to flooding. Also in the upstream valleys in the hills flooding occurs, which are often inhabited and the major valleys have important transport corridors that allow you to cross over the island. Moreover, upstream flooding may actually be considered positive if a valley is uninhabited, as the temporary retained flood water would otherwise contribute to the hazard downstream. It is therefore important to consider flood hazard as part of an integrated catchment analysis, and not focus on single isolated occurrences.
Given these conditions where the flood hazard is directly related to the rainfall-runoff processes in the catchments, a national flood hazard map for the islands should be based on a flood hazard model that takes these into account.
National-scale flash flood modelling
Important considerations
The national flood hazard map shows the potential flood hazard of all the catchments and locations on the island where flooding may take place. The information shown is flood extent only, water depth information is not included in this map. At this scale and resolution, water depth information is not accurate enough to make a hazard classification combining depth and extent. The map is produced on a scale of 1:50,000 based on GIS raster data layers used in the flood model with a gridcell resolution of 20x20m.
This effectively means that the map can only be used as an indication of where flood may occur, and be used to check which settlements and areas are exposed to floods. The infrastructure and buildings are deliberately shown in a generalized way, as is common with 1:50000 scale maps.
In chapter 6 of this report, a quality analysis is done based on a visual inspection and evaluation by the stakeholders in this project. Also the results are compared to two detailed flood hazard analysis projects that were done before.
As such, the national flood hazard map is a tool to gain more understanding on flood hazard on an island level, as an input for national planning, risk reduction and disaster preparedness. The map gives an indication of exposure of built up areas and infrastructure to flood hazard. It can be used to judge which communities should prepare themselves for a given hazard magnitude.
However, at this scale it has an inherent uncertainty: the map and associated information is indicative and cannot be used to provide details for individual properties or engineering design. It can be used as a first approximation, and serve as guidance to locate where a more detailed site investigation should be done to reduce local risk.
The methodology is based on the following considerations:
- Rainfall: the frequency and magnitude of the floods is assumed to be the same as the frequency and magnitude of the rainfall that causes it. In the model simulations, the island is subjected to a rainfall event that covers the entire island at the same time, without spatial differences. These are statistically derived artificial rainfall events (so called design storms), that do not resemble the dynamics of a real storm with a moving weather front and erratic variations in intensity. Therefore this map does not show what will happen exactly during a real event of a comparable magnitude. The return periods used are 1:5, 1:10, 1:20 and 1:50 years.
- Land use and soils: the differences in flooding between the catchments for a given rainfall are caused by differences in relief, land use/land cover and soils. Especially soil moisture storage capacity and infiltration rates determine how a catchment reacts to rainfall). The initial moisture content on the entire island is set to 85% of the porosity, which is generally half way between field capacity and saturation. These conditions apply in the wet season when most hurricanes and tropical storms occur.
- Buildings and infrastructure: on a national scale, certain details cannot be simulated, such as the effect of bridges and culverts, the presence of debris and excessive sediment from previous storms in the river channel, or the fact that some roads are elevated and may act as temporary barriers. The effect of buildings is included to a certain extent (explained below). In part this is because the exact dimensions of the infrastructure is not known, and in part this is because at the national scale certain details are generalized. The only known flood barrier included is the barrier that protects the Hewanorra international airport in the south of the island.
- Spatial data quality: the quality of the model results depends to a large extent on the quality of the input data. Care has been taken to use the existing data as much as possible, so that the results are close to the island circumstances. Where needed literature values are used, or values measured on the other islands in the CHARIM project.
Based on the physiography and topography of the Windward Islands, the following terms of reference for the flood hazard assessment were used:
- There is no viable discharge data, do rainfall is used to simulate the flash flood process. This means that a flood model has to be able to simulate the surface hydrology of entire catchments, both upstream and downstream areas. Since settlements are also spread out over the islands, flooding occurs not only near the coast (where the largest villages are) but also in higher valleys.
- The flood model has to be able to use the existing national spatial datasets, so that when better data becomes available, simulations can be done again relatively easily. Formats used are standard GeoTIFF. Data gaps are filled by knowledge and data pooled from the islands and from literature. Thereby we rely as little as possible on variables/constants/assumptions from general worldwide datasets, acquired in environments that are very different.
Based on the specific requirements related to the situation in the Caribbean islands we selected the integrated flood model LISEM (freeware and open source developed at the Utrecht University (1992-2006) and subsequently by the ITC (2006-current), in the Netherlands. LISEM is a model that was initially developed to simulate the effect of land use changes at farm level for sustainable land management, to combat erosion and desertification. Recently a 2D flood module was added to enable integrated flood management. It is an spatial event based model that operates at timescale of < 1 minute and spatial resolutions of < 100m grid cells. It does not model groundwater and evapotranspiration because ift focusses on the consequences of single rainfall events.
Flashflood modelling methodology
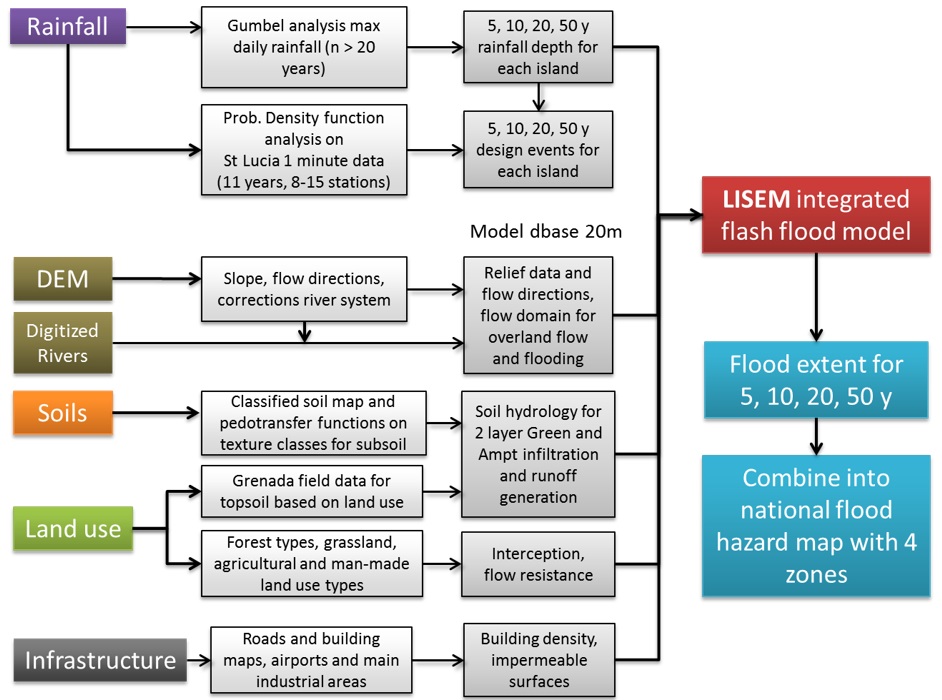
Figure 1 shows the framework that is used to create the flood hazard (each step is explained in detail in subsequent sections):
- A frequency magnitude analysis of daily maximum rainfall of all stations that had 20 years or more of daily rainfall data. Generalized Extreme Value distributions were fitted to these datasets to determine the daily rainfall with return periods of 5, 10, 20 and 50 years.
- Design events were created using the network of 8 tipping bucket rainfall stations on Saint Lucia, which have datasets between 5 and 11 years. Using the rainfall depth from the maximum daily values, and duration and intensity data form the tipping bucket stations, design curves were created using a Johnson Probability Density Function.
- The DEM was created from existing elevation isolines in the national GIS database. From the these lines a continuous surface was interpolated using block kriging, for a 10m grid. This was then resampled (averaged) to a 20m resolution for the modelling. The DEM boundary was used as coastline and very small islands and peninsulas were eliminated. The DEM was used directly in the modelling but also to correct the vector based river network.
- The land use map and soil class map were used to derive a number of soil physical and vegetation parameters used for the surface water balance of the model.
- The infrastructure, i.e. the road network and buildings were taken from the shape files in the national database.
- The model output consists of the maximum flood level reached during the event, the maximum water velocity the duration of the flood, the time since the start of the rainfall when a pixel is first inundated, and statistics about the total surface of buildings in different flood depth classes. From this data the extent was used for the flood hazard map. Note that pixels with less than 10 cm of water were not counted as flood pixels. The 4 flood extent maps were combined into a hazard map with 4 zones (corresponding to areas flooded with the 4 design events).
Figure 1. National scale flood hazard assessment methodology: basic information layers to the left are used for hydrological information that is given to the model. Rainfall for different return periods results in different flood simulation results. These are combined in hazard information databases, and also reproduced as cartographic products.
The method is based on the open source integrated watershed model LISEM. This model is based on the well-known LISEM erosion/runoff model (see e.g. Baartmans et al., 2012, Hessel et al., 2003, Sanchez-Moreno et al., 2014), combined with the FullSWOF2D open source 2D flood package from the University of Orleans (Delestre et al., 2014). As a runoff model LISEM has been used in many environments, European humid and semi-arid areas, islands (Cape Verde), East Africa (cities of Kampala and Kigali), India, Indonesia, Vietnam and Brazil.
LISEM is a hydrological model based on the surface water and sediment balance (see fig 1). In CHARIM only the water processes are used, erosion and sedimentation is not simulated. It uses spatial data of the DEM, soils, land use and man-made elements (buildings, roads, channels) to simulate the effect of a rainfall event on a landscape. Above ground processes are interception by vegetation and roofs, surface ponding and infiltration. The resulting runoff is derived from a Green and Ampt infiltration calculation for each gridcell, and routed as overland flow to the river channels with a 1D kinematic wave. The routing takes surface resistance to flow into account. The water in the channels is also routed with a kinematic wave (1D) but when the channels overflow the water is spread out using the full St Venant equations for shallow water flow. Runoff can then directly add to the flooded zone. Figure 2 shows schematically the steps in the model from runoff to flooding. Since it is an event based model, LISEM does not calculate evapotranspiration or groundwater flow.
Figure 2. Flowchart of the water and sediment processes in LISEM. In dashed lines the main parameters are given. In CHARIM only the water processes are used (in blue).
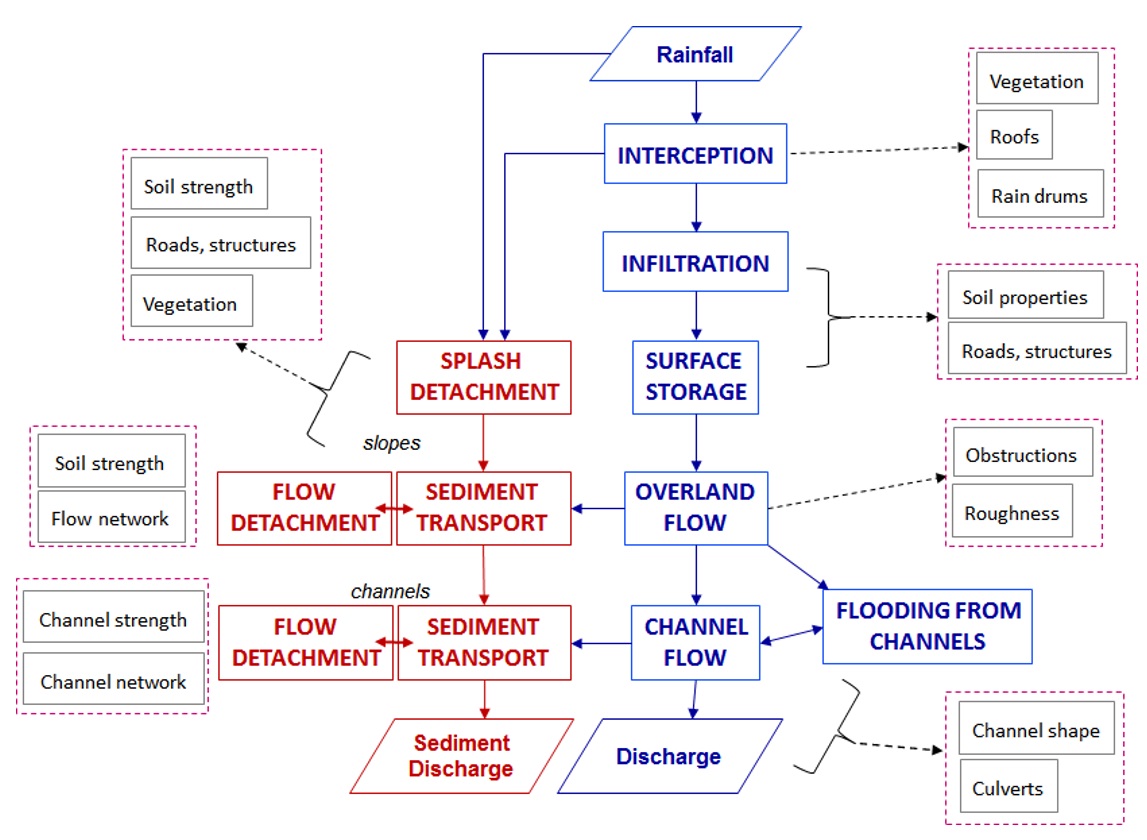
Figure 3 shows how LISEM deals with sub gridcell information. Layers with objects smaller than a gridcell can be added, which are then defined as a fraction (buildings and vegetation) or by their width (roads and channels). Roads, houses and hard surfaces (e.g. airports runway) are considered impermeable, smooth and have no vegetation interception. Houses are impermeable but have roof interception and to some extent obstruct the flow. LISEM 'looks' vertically along all the information layers to determine the hydrological response of each gridcell.
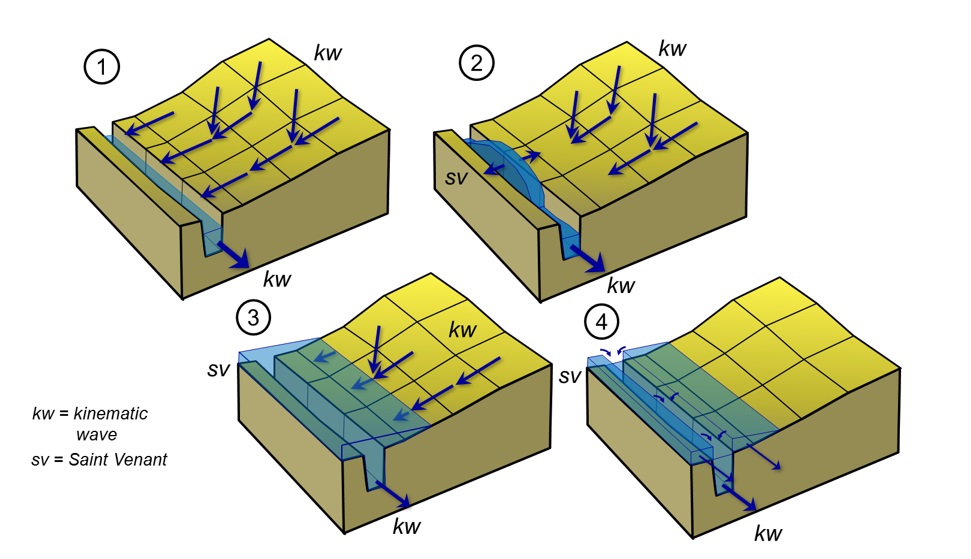
Figure 3. Schematic representation of flow processes from 1D kinematic wave runoff and channel flow (1), to overflow of channels (2), spreading out of water from the channels outward using 2D full Saint-Venant equations (3), and flowing back into the channel when water levels drop, most likely the runoff has stopped by now (4). Runoff continues to flow into the flood zone for a short distance.
Data requirements
Flood Modelling requires a lot of data, because in a raster GIS, that is essentially what LISEM uses, each property is defined in a new map layer. For instance the channel is characterized by 7 maps, for width, depth, angle of the channel sides, bed slope, flow resistance, and areas with imposed maximum flows (for bridges and culverts). The total number of input maps for LISEM looks daunting at a first instance, but they are all derived from 6 basic maps and several tables with soil and vegetation properties. This is explained in detail below. In the CHARIM project, a GIS script is created to do this automatically. The GIS used is the freeware GIS PCRaster developed at the Utrecht University, the Netherlands (pcraster.geo.uu.nl). This is just for convenience, in principle LISEM can use data from other GIS systems if it is in GeoTIFF format.
Figure 4. Different information layers are combined into one set of information per gridcell. Vegetation and building information is given as a fraction per cell, roads and channels are given as width in m. The soil layer is the base layer so that we always know what for instance the infiltration beside a road or house is. Infiltration and flow resistance are determined as a gridcell weighted average response.

More information on data requirements for flood modelling, with examples from Saint Lucia, can be found in the Data Management Book, Section on Flood data requirements.
Model outputs and Hazard maps
The hydrological response of the model with respect to the rainfall is such that the areas that are built up (roads, paved surfaces) generate runoff first, then the soils with a high clay content under non-natural vegetation, and finally the forested areas contribute (see fig 5). The overall runoff fraction (average of the island) of a 1:5 year event is 15% and increases to 20% for a 1:50 year event.
All major valley have flooding effects upstream in the hills. While this is of course dangerous for locations where there are settlements, there is also a hydrological effect of these flooded areas. Flooding upstream generally decreases and slows down the streamflow decreasing the flood hazard downstream near the coast. Site investigations that are based on models that need an incoming discharge to operate, should take this into account. Catchment models that generate a discharge as input for flood models overestimate the discharge when this is not taken into account.
Figure 5. Example of the hydrological response: cumulative infiltration approx. 2 hours after the start of the 1:5 year design rainfall event (legend units are in mm). To the north is Castries, south west is the Oil terminal. Built up area and roads show little infiltration, forested areas have an infiltration above 200mm at this moment. Flooded areas have increased infiltration because of the flood water pressure, in spite of the clay rich soils.

The national hazard maps are based on flood extent only. The extent of the floods is calculated for water depths > 0.05 meter, to avoid excessive areas that are only "wet" but not really pose a hazard. Below a number of locations are highlighted, and compared to known flood areas. Figure 6 shows the summary statistics for the flood hazard for 4 return periods. In total the area flooded increases from 11.5 to 34 km2, while the flood volume increases from 4.8 to 26.7 million m3. Note that for these statistics, areas inundated by less than 10 cm were not flooded. The level of accuracy of the modeling system and the database were not considered sufficient for that level of detail.
The average building size in the national flood database is approximately 75 m2, LISEM does not deal with individual buildings, only with built up area per grid cell area. Based on this average number, the approximate number of buildings flooded is 3200 for 1:5 years and rises to 9800 for 1:50 years. This analysis gives no indication of the flood depth at the location of these buildings, which can be anything from 0.1 to over 3 meters.
Figure 6. Summary statistics of the national flood hazard map for the 4 return periods. Note that the building nr affected is an approximate number based on an average building size of 75 m2.

References
Allen, G.H. and Pavelski, T.M. 2015. Patterns of river width and surface area revealed by the satellite-derived North American River Width data set. AGU Geophysical Research Letters 10.1002/2014GL062764.
Baartman, J.E.M., Jetten, V.G., Ritsema, C.J. and de Vente, J. 2012. Exploring effects of rainfall intensity and duration on soil erosion at the catchment scale using LISEM : Prado catchment, SE Spain. In: Hydrological processes, 26 (2012)7 pp. 1034-1049.
CDERA. 2006. Development of Landslide Hazard Maps for St. Lucia and Grenada. Final Project Report for the Caribbean Development Bank (CDB) and the Caribbean Disaster Emergency Response Agency (CDERA).
Chow, V.T., Maidment, D.R. and Mays, L.W. 1988. Applied Hydrology. McGraw-Hill Publishing Company; International edition. pp588.
Coles, S. 2001. An Introduction to Statistical Modeling of Extreme Values,. Springer-Verlag. ISBN 1-85233-459-2.
Cooper, V. and Opadeyi, J. 2006. Flood hazard mapping of St. Lucia. Final report for the Caribbean development bank, February, 2006.
De Jong, S. M. and V. G. Jetten 2007. "Estimating spatial patterns of rainfall interception from remotely sensed vegetation indices and spectral mixture analysis." International Journal of Geographical Information Science 21(5): 529"“545.
Delestre, O., Cordier, S., Darboux, F., Mingxuan Du, James F., Laguerre, C., Lucas, C., Planchon, O. 2014. FullSWOF: A software for overland flow simulation.
Advances in Hydroinformatics - SIMHYDRO 2012 - New Frontiers of Simulation, 221-231, 2014.
Hessel, R., Jetten, V.G. and ... [et al.] 2003. Calibration of the LISEM model for a small loess plateau catchment. In: Catena, 54 (2003)1-2 pp. 235-254.
Klein Tank, A.M.G., Zwiers, F.W. and Xuebin Zhang. 2009. Guidelines on Analysis of extremes in a changing climate in support of informed decisions for adaptation. WMO Climate Data and Monitoring WCDMP-No. 72.
Kuriakose, S. L., S. Devkota, Rossiter, D. and Jetten, V.G. 2009. "Prediction of soil depth using environmental variables in an anthropogenic landscape, a case study in the Western Ghats of Kerala, India." Catena 79(1): 27-38.
Lumbroso, D.M., S. Boyce, H. Bast and N.Walmsley. 2011. The challenges of developing rainfall intensity - duration - frequency curves and national flood hazard maps for the Caribbean. The Journal of Flood Risk Management, Volume 4, Number 1, January 2011 , pp. 42-52(11).
Marmagne, J. and Fabrègue, V. 2013. Hydraulic assessment for flood risk assessment in Soufriere, Fond St Jacques and Dennery. Huricane Tomas Emergency Recovery Project, parts 1, 2 and 3. EGISeau, RIV 22852E.
Morgan, R. P. C., J. N. Quinton, et al. (1998). The European Soil Erosion Model (EUROSEM): documentation and user guide. version 3.6. SIlsoe, Bedford, UK, Silsoe College, Cranfield University: 124.
Pratomo, R.A., 2015. Flash flood behaviour on a small caribbean island: a comparison of two watersheds on grenada. MSc thesis, Applied Earth Science-Natural Hazard and Disaster Risk Management. ITC, Utrecht University, the Netherlands, pp 84.
Sanchez-Moreno, J.F., Jetten, V.G., Mannaerts, C.M. and de Pina Tavares, J. 2014. Selecting best mapping strategies for storm runoff modeling in a mountainous semi - arid area. In: Earth surface processes and landforms, 39 (2014)8 pp. 1030-1048.
Saxton, K. E., W. J. Rawls, et al. 1986. Estimating generalized soil-water characteristics from texture." Soil Sci. Soc. Am. J. 50(4): 1031-1036.
Stark, J., et al. 1966. Soil and Land-Use Surveys N°20, Saint Lucia, The Regional Research Centre, Imperial College of Tropical Agriculture, University of the West Indies, Trinidad and Tobago, October 1966.
Wright, D., Linero-Molina, C. and Rogelis, M.C. 2014. The 24 December 2013 Christmas Eve Storm in Saint Lucia: Hydrometeorological and Geotechnical Perspectives. Latin America and the Caribbean Regional Disaster Risk Management and Urban Development Unit (LCSDU), GFDRR World bank. pp110.
WRMU, 2001. Integrating the Management of Watersheds and Coastal Areas in St. Lucia. Executed by the Water Resources Management Unit, Ministry of Agriculture, Forestry and Fisheries, Government of St. Lucia, July 2001.