

Summary
With the increasing frequency of disaster events caused by natural hazard globally, it is important to record for damages and losses for the shake of better disaster management and it should be a continuous in the effort in order to reduce economic damages and losses. The systematic collection of information related to the frequency and impact of disasters is an important tool for governments and institutions in charge of disaster risk reduction (DRR).
DesInventar is a conceptual and methodological tool for the generation of National Disaster Inventories and the construction of databases of damage, losses and in general the effects of disasters. This use case is based on the DesInventar methodology (also refer to Chapter 4.2 Disaster databases, Disaster Management Book), which provides a methodological framework to build information about the occurrence of disasters of small and medium impact and disaggregated data about the effects of large scale disasters.
Use case intended for: Spatial analist
Keywords:
Disaster Loss, National Disaster Observatory, DesInventar
| Before you start: | Use case Location: | Uses GIS data: | Authors: |
|---|---|---|---|
| Read about DesInventar (http://www.desinventar.net) | Belize | Yes |
Dr. Manzul Kumar Hazarika and Mr. Chathura Wickramasinghe |
Introduction:
Disaster damage and loss data are collected by various agencies in a country and the lack of systematic, homogeneous, and compatible records makes it difficult to use such information for Disaster Risk Reduction (DRR) planning. It is important to identify all possible data sources for a national effort, making the information accessible and in many cases, trying to conciliate multiple data sources report dissimilar figures when describing the effects of the same event. Therefore, there is a need to develop a system at the national level to collect, update and store such data continuously. Data collected through the system should be time-stamped and geo-referenced so that disaster trends, their spatial and temporal impacts are well understood.
The development of a Disaster Inventory System - DesInventar facilitates a common conceptual and systematic approach for data collection, retrieval, query and analysis of information about disasters of small, medium and greater impact, based on pre-existing official data, academic records, newspaper sources and institutional reports.
Objectives:
- To provide a methodology overview for building a hazard and loss database, specifically with DesInventar approach
- To provide an overview of data analysis within the DesInventar system
DesInventar Disaster Information Management System
A disaster information management system is a sustainable arrangement within an institution for the systematic collection, documentation and analysis of data about damage and losses causes by disasters associated to natural hazards. The DesInventar system which was used in this Use Case includes a software with two primary modules:
- Administration and Data Entry module, which is a relational and structural database through which the database is fed by filling in predefined fields (space and temporal data, types of events and causes, sources) and by both direct and indirect effects (deaths, houses, infrastructure, economic sectors).
- Analysis module allows access to the database by queries that may include relations among the diverse variables of effects, types of events, causes, sites, dates, etc. This module allows at the same time to represent those queries with tables, graphics and thematic maps.
DesInventar Database Development
The DesInventar database itself is built in two stages, through a day-by-day, continuous observation of effects of disasters and through a historical research that will look into past disasters for a recommended period of time, usually 30 years.
Daily operation of the Observatory:
Every time a disaster hits a country (even small or medium scale disasters) an observer registers the impact in a disaster database. The impact is represented as the set of damages and losses such as mortality, number of houses or agricultural crops destroyed and damaged, etc. The National Disaster Observatory will collect information generated at local level and will provide stakeholders with reports, analysis and other products derived from the data collected.
Historical Research:
An institution will be identified and the necessary institutional framework will be established so that disaster loss data from the past (ideally past 30 years) will be identified, collected, classified, and validated. The data will be collected mainly from government records, but data from media can also potentially be used.
The whole set of collected data are analyzed to generate information, which shows the trends and interaction between disaster events and losses causing development setbacks. Such information is used to generate interest in the government for mainstreaming disaster risk reduction into development planning.
Figure 1 shows the observers of various hazards in a country. These observers are mostly the national agencies designated by the government and they will provide data and information to the National Disaster Loss Observatory. They responsible to archive and maintain these data using standards and share them with the end-users through a disaster data portal.
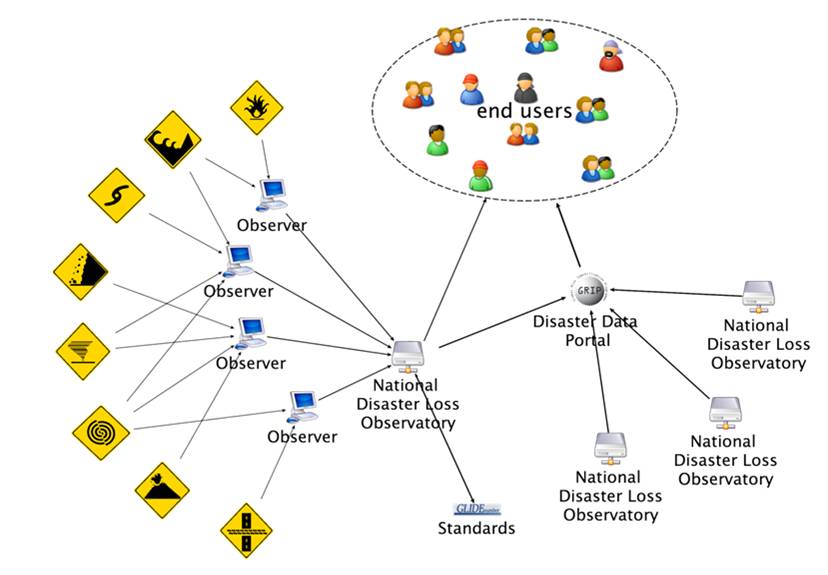
Figure 1: Institutional framework on data collection for the development of DesInventar database
Flowchart:
The flowchart shows the agencies in Belize, which contribute relevant data to the National Disaster Loss observatory.
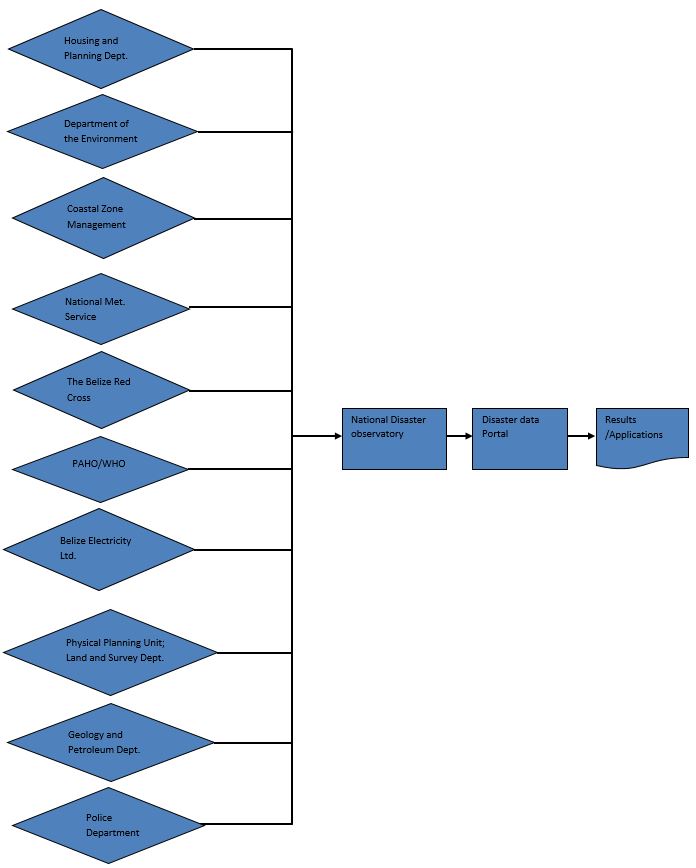
Figure 2: Processing Flowchart
Problems definition and specifications:
Disaster loss data are usually scattered among various institutions within a country, which often collect information without coherence and coordination. Further, lack of clear standards and definitions leads to inconsistent reliability and poor interoperability of the various existing disaster loss databases. This also hinders comparability of disaster related information and reported losses.
To avoid such inconsistency, there is a need for systematic collection, analysis and interpretation of disaster loss data. Within DesInventar system, a National Disaster Loss Observatory is developed for adoption of common standards, quality control, being compatible (national, regional and global), sustainable, institutionalized, applied and based on local capacity. Among the Caribbean countries, Belize has developed its DesInventar site.
Data requirements:
- Historical disaster damage and loss data. In Belize, a total of 129 disaster events from 1931 to 2011 have been listed from DesInventar database.
Inputting correct data is the key to maintaining a proper database with the necessary information. A National Disaster Loss Observatory is setup to collect and standardize data for DesInventar system. Input data can be divided as essential and non-essential information. Locations, damages, losses and human casualties can be taken as essential information, and economic losses, effected properties, recovery cost etc. can be taken non-essential information.
- Past disasters, their locations, damages, losses and human casualties.
- In case of Belize, the following data have been entered to DesInventar:
- Locations - districts and villages;
- Types of events;
- Types of causes;
- Effects - persons/property, sectors, and economic losses.
Analysis steps:
Analysis step involves deriving information from the collected data and generating map and charts to show meaningful information.
- Data query - Is simply querying the data based on one or more conditions. Data query may include deaths, economical damages and number of affected people. For example " disaster with more than 10 deaths" or " List disaster based on affected number of people" etc.
- Spatial analysis - Spatial analysis allows the physical components of a hazard to be represented digitally, making complex analysis a relatively simple task. This enables the user to extract information based on geographical features E.g. villages within a district that affected by floods.
- Sectorial analysis - Damage and loss caused by disasters on various sectors such as housing, agriculture, industry etc.
- Trend analysis - Analyzing trends of hazards and associated losses can be useful for knowing whether climate change has started to have an effect on frequency and the intensity of the natural hazards. Trend analysis is important to prioritize mitigation projects, E.g. cities with increasing deaths due to flooding. Funding for flood retaining walls can be based on a prioritized list.
- Thematic analysis - Thematic analysis gives a clear overview about the hazard related issues and represents some kinds of pattern or meaning within the data set, e.g., gender differences in morbidity and mortality.
Results:
DesInventar Analysis Module can be accessed by starting a browser and typing the URL: http://www.desinventar.net/
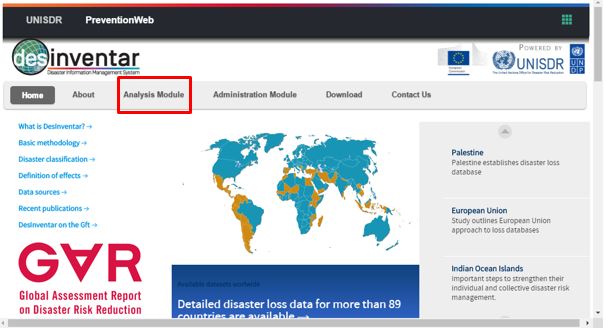
Figure 3: Web interface of DesInventar
The Analysis Module can be selected from the menu bar and users have the option to select which region or country they want to query, just by clicking on the corresponding name. For this Use Case, we select Belize (Figure 4).
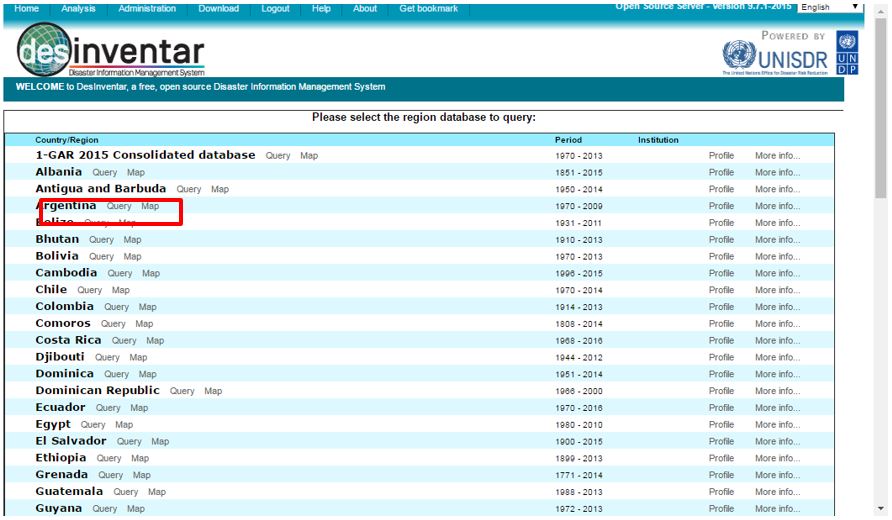
Figure 4: Country database in DesInventar
A quick preliminary analysis is made to show a profile link that is made on the data present in the system. The preliminary analysis contains composition charts (for the number of records, mortality, housing sector and affected people) and also trend charts and thematic maps for the same set of variables. Figure 5, Figure 6 and Figure 7 shows the results of preliminary analysis.
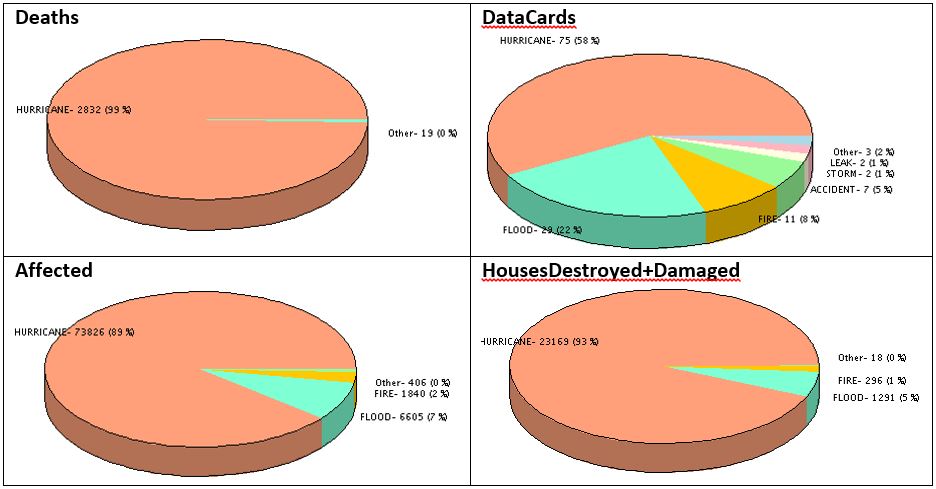
Figure 5: A preliminary analysis of composition charts
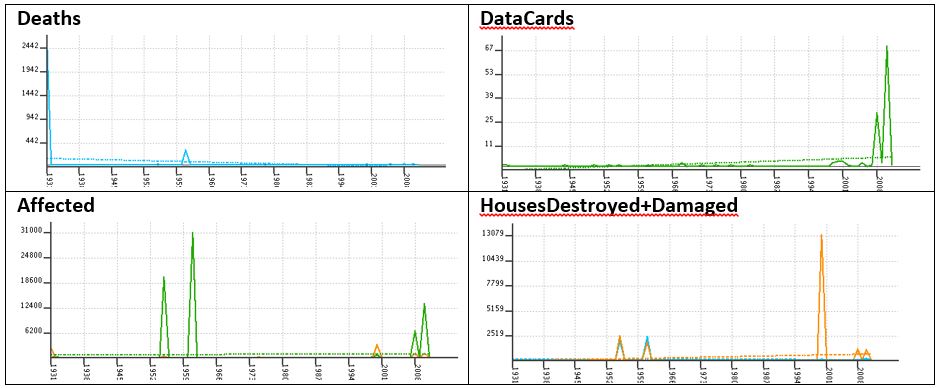
Figure 6: A preliminary analysis of trend charts
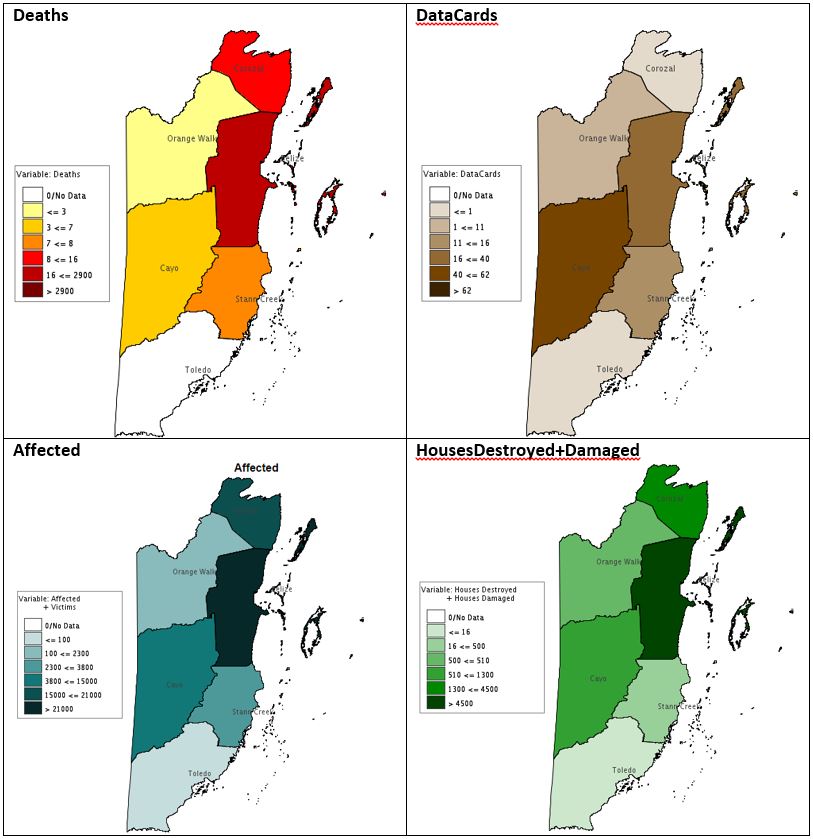
Figure 7: A preliminary analysis of thematic maps
The preliminary analysis also provide more detail statistical data on damage and loss for each disaster types, its spatial distribution and temporal behavior (Figure 8). Users can also download the data in Excel file for further analysis.
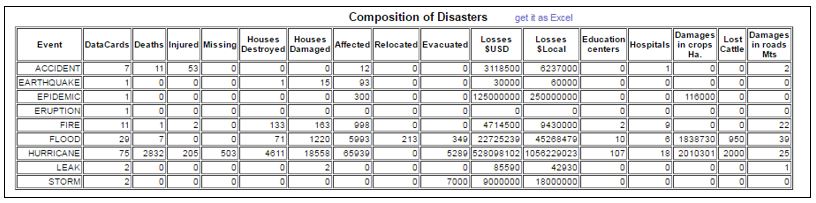
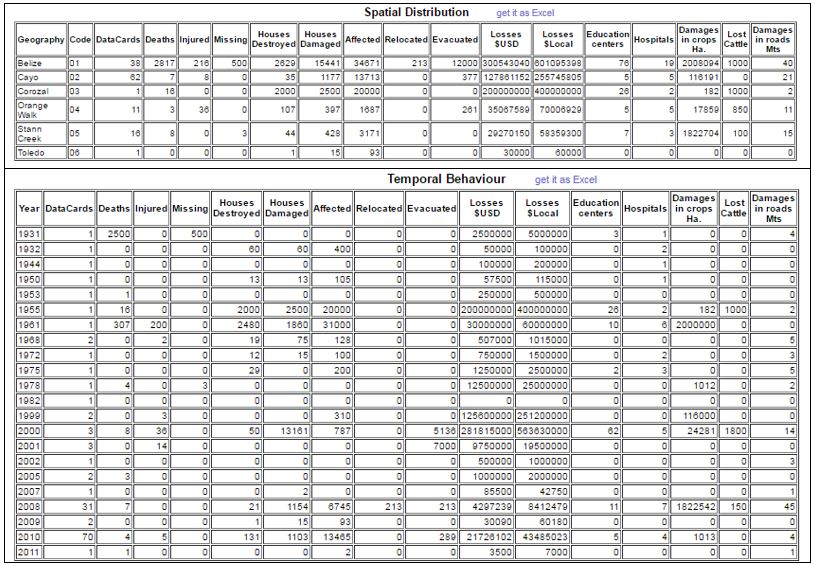
Figure 8: A statistical data on damage and loss for each disaster types, its spatial distribution and temporal behavior
In summary, there are 29 disaster records in Belize from period of 1931 to 2011. Among the natural hazards, hurricane caused the highest mortality with 2832 deaths from 75 records, follow by flood with 7 deaths in 29 records. Hurricane also caused the highest housing damages with 23,169 houses, then flood with 1291 houses. A large number of incidents were reported in 2008 and 2010. In 2008 tropical storm Arthur caused extreme rainfall resulting in floods and landslides. Similarly, in 2010, hurricane Richard made landfall in the northern lagoon area of the Belize district and high-speed wind caused damages to a large number of buildings.
Working with a large datasets requires a strong capability in data query to be able to extract a specific datasets. A query in DesInventar can be made based on several criteria, including disaster type, geography level (district and village), cause, events with specific effects (deaths, injured. houses destroyed, affected, evacuated, damage in crops, damage in roads, etc.), events that affected (agriculture, education, etc.), and date range. An SQL query is also available for a more sophisticated data search and intended for users that familiar with the concept of databases. Figure 9 shows interface of query in DesInventar. Figure 10 shows the results of data query on flood disaster happened in all villages of Belize district from 2000 to 2011, where more than 20 people was affected.
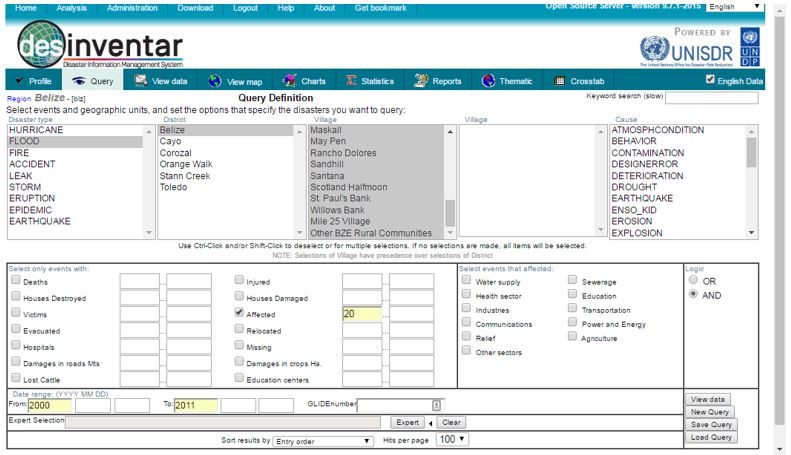
Figure 9: Query in DesInventar
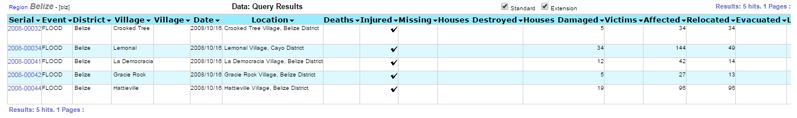
Figure 10: Results of data query with specific criteria
DesInventar is also capable to generate thematic maps that can show the spatial distribution of the data selected in the Query tab. Figure 11 shows the number of people affected by the disasters from 1931 to 2011 in six districts of Belize (Corozal, Orange Walk, Belize, Cayo, Stann Creek and Toledo). Gradient of color shows different number of affected people, from low (yellow) to high (red). Similar maps can be produced for deaths, people affected, building destroyed, losses incurred, sectors affected etc.
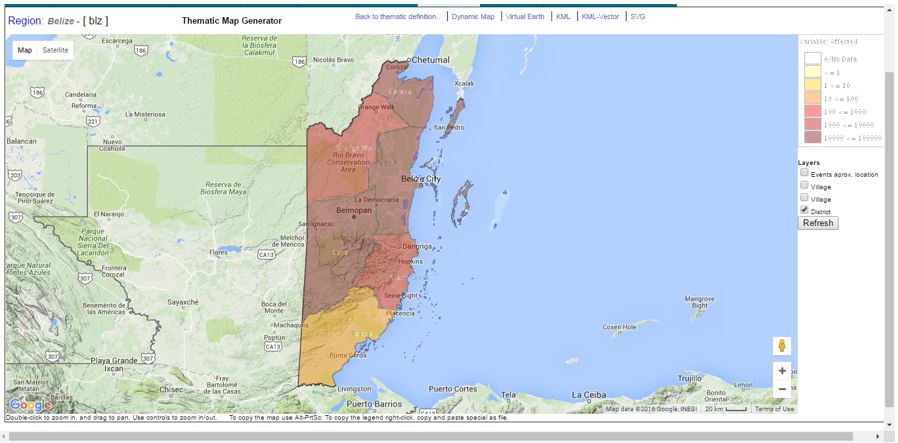
Figure 11: Map showing number of people affected in six districts of Belize from 1931 to 2011
Conclusions:
Building a historical hazard and loss database plays a very important role in developing the DRR strategies in a country. DesInventar system provides improved access to national and regional disaster data and enables to monitor, analyse and disseminate information on key hazards and disasters. Maintaining accurate records and developing the necessary procedures will ensure the quality of such databases, which can be useful for DRR planning such as:
- Provide inputs to National DRR strategies and it helps the government agencies to incorporate disaster mitigation measures in development planning.
- Provide access to disaster data and their analysis and interpretation to the national and international communities, researchers and other organizations.
- Calibration/validation of hazard and risk maps - Validation of hazard and risk maps produced from models is very important to improve the accuracy of models.
- Monitoring the effectiveness of risk reduction measures - Using a systematic collection and documentation of data about damages and losses cause by hazards and interpret the effectiveness of risk reduction measures.
Last update: 06 - 06 - 2016