

This use-case will show you the steps required to calculate the exposed number of buildings to natural hazards. It uses the available susceptibility and hazard maps for different types of hazards. It will also show you how to use this information for calculating the number of buildings exposed to each type of hazard individually.
Keywords:
flood hazard; landslide hazard; volcanic hazard; wildfire hazard; tsunami; storm surge; building exposure
| Before you start: | Use case Location: | Uses GIS data: | Authors: |
|---|---|---|---|
| Read the related chapter in the methodology book (sections 5.4 and 5.5). The composite multi-hazard susceptibility maps is made in use case 8.5. | This use case deals with the island of Saint Vincent | Yes, there is a GIS exercise available for this use case | Cees van Westen |
Introduction:
At a national level it is important for governments to have an understanding of the areas that might be affected by different types of hazards, how frequent that would happen and how many people, buildings, roads and other infrastructure might be affected. The Eastern Caribbean islands may be affected by a number of natural hazards, such as storm surges, hurricanes, tsunamis, flashflood, debris flows, landslides, and forest fires. Compared to single processes, standard approaches and methodological frameworks for multi-hazard risk assessment are less common in the literature (Kappes et al., 2012), which is related to the complex nature of the interaction between the hazards, and the difficulty to quantify these. One of the difficult issues in natural hazards risk assessment is how to analyze the risk for more than one hazard in the same area, and the way they interact. The simplest approach is to consider that the hazards are independent and caused by different triggers. If that is the case the risk can be calculated by adding the average annual losses for the different types of hazard. Hazard may be coupled, which means they may be linked to the same triggering event. In that case both events may occur in the same location and cause damage, and in risk assessment the highest damage is used. One hazard may change the disposition of another, making the area more susceptible for the other hazard without occurring simultaneously. And hazards may occur in chains, where one hazard may trigger the next. These hazard chains or domino effects are extremely difficult to quantify over certain areas, although good results have been obtained at a local level). See Methodology book 5.4 for more information on multi-hazards. The table below shows the main multi-hazard relationships for the hazards occurring in the Caribbean countries.
|
|
Earthquake |
Volcanic eruption |
Tsunami |
Storm surge |
River flooding |
Landslides |
Forest fires |
|---|---|---|---|---|---|---|---|
|
Earthquake |
- |
Independent |
Chain |
Independent |
Independent |
Chain |
Independent |
|
Volcanic eruption |
Independent |
- |
Chain |
Independent |
Disposition |
Disposition |
Chain |
|
Tsunami |
Caused by |
Caused by |
- |
Independent |
Independent |
Chain along coast |
Independent |
|
Storm surge |
Independent |
Independent |
Independent |
- |
Chain |
Chain |
Independent |
|
River flooding |
Independent |
Independent |
Independent |
Coupled |
- |
Coupled |
Independent |
|
Landslides |
Caused by |
Independent |
Independent |
Coupled |
Coupled |
- |
|
|
Forest Fires |
Independent |
Coupled |
Independent |
Independent |
Disposition |
Disposition |
- |
Table 1 : Main hazard types in the Eastern Caribbean and the interactions, as described above. The relationship should be read starting from the left and reading horizontally.
Although the hazards may have a relation as indicated in Table 1, in practice there are very few studies that have carried out comprehensive hazard assessments that take into account these multi-hazard interactions. Mostly hazards are analyzed separately by teams that have expertise in a particular type of hazard (e.g. volcanic hazard mapping, flood hazard mapping).
The generation of national-scale hazard maps is complicated, and in most cases the national scale maps are only susceptibility maps. A susceptibility map contains a subdivision of the terrain in zones that have a different spatial likelihood that a potentially dangerous phenome (e.g. flood, landslide etc) might occur. A hazard map also provides information on the expected frequency and magnitude or intensity of the hazardous event (e.g. flood height for a 50 year Return Period).
In some of the islands some progress has been made in the development of such national scale hazard maps. However in most of the cases these maps are still very general, and are mostly susceptibility maps, which express the relative likelihood of hazard in qualitative classes, rather than actual hazard maps, which show the expected intensity for different return periods. There is no metadata for the available hazard maps for the use case area (Saint Vincent), so it is unclear who made the maps and with which methods. After doing some literature review we assumed that these maps were generated by Boruff and Cutter (2007) as part of a study to analyze national scale vulnerability maps for Saint Vincent and Barbados.
Objectives:
The objective of this use case is to evaluate how many of the existing buildings are exposed to one or more hazard types in the entire country. The following hazard types are taken into account: storm surges, tsunami, river flooding, landslides, volcanic eruptions and forest fires. This information is then also aggregated per administrative unit (parish). Given the unavailability of data on intensities, return periods and hazard interactions, and the national scale of analysis, we are not able to generate a proper national scale multi-hazard map.
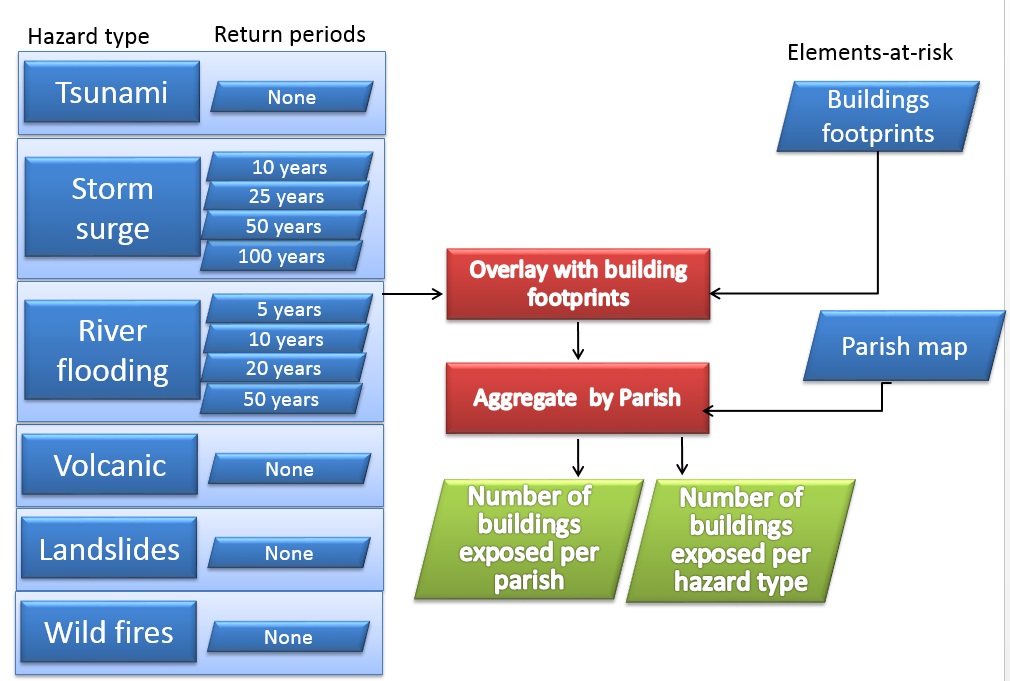
Flowchart:
Use case study area description:
Saint Vincent and the Grenadines consists of 32 islands covering a total of 389 square km, with a total population of approximately 106,000. Saint Vincent, the northernmost island, is the country's commercial and political centre, accounting for 90 percent of both the land area and population.
According to the 2010 National Accounts, the Gross Domestic product of SVG was US$ 583 million. SVG has a poverty headcount index of about 30.2 percent as of 2007/08 and an estimated unemployment rate of 21 percent. St. Vincent and the Grenadines ranks 91st out of 182 countries on the 2007 United Nations Development Program (UNDP) Human Development Index.
SVG is exposed to a range of natural hazards. Most common are hazards stemming from weather-related phenomena such as winds, rainfall, hurricane and drought. The islands experience an annual hurricane season from June to November, followed by a dry season from December to May.
Data requirements:
For this use case we require national scale hazard maps and national scale elements-at-risk maps. The maps that are available for Saint Vincent are summarized in table 2. For one hazard type (river flooding) we have maps that show water depth for different return periods. For storm surges, we have maps representing the expected extent of flooding for different return periods, however without depth information. For tsunami hazard we only have the run-up areas that are situated within 1.87 meters elevation from the coast, without data on return periods. For other hazard types (volcanic hazards, landslide hazard and forest fires) we only have maps representing the relative spatial likelihood of the hazard, without information on the frequency and the intensity. We did not have hazard maps for two types of hazards: wind, and drought.
|
Hazard type |
Intensity |
Return Period |
Type of map |
Source |
|---|---|---|---|---|
|
Tsunami |
1.87 meters |
No direct information |
Susceptibility map |
Boruff and Cutter (2007) Smith and Shepherd (1993) |
|
Storm Surge |
Flood extent |
10 years |
Hazard maps, although they do not show intensity as water height they do show extent for different return periods |
CDMP (2000) and Boruff and Cutter (2007) |
|
Flood extent |
25 years |
|||
|
Flood extent |
50 years |
|||
|
Flood extent |
100 years |
|||
|
River flooding |
Water depth |
5 years |
Hazard maps, showing water height for different return periods. |
CHARIM project (Jetten) |
|
Water depth |
10 years |
|||
|
Water depth |
20 years |
|||
|
Water depth |
50 years |
|||
|
Volcanic hazards |
Relative classes |
No direct information |
Susceptibility map |
Lindsay et al, (2005); Robertson (1995) |
|
Landslides |
Relative classes |
No direct information |
Susceptibility map |
CHARIM project (Van Westen) |
|
Bushfires |
Relative classes |
No direct information |
Susceptibility map |
Forest Department |
Table 2 : Overview of the susceptibility and hazard maps available for Saint Vincent, with indication of the information content and whether information is available for different return periods
For this use case we require national scale hazard maps and national scale elements-at-risk maps.
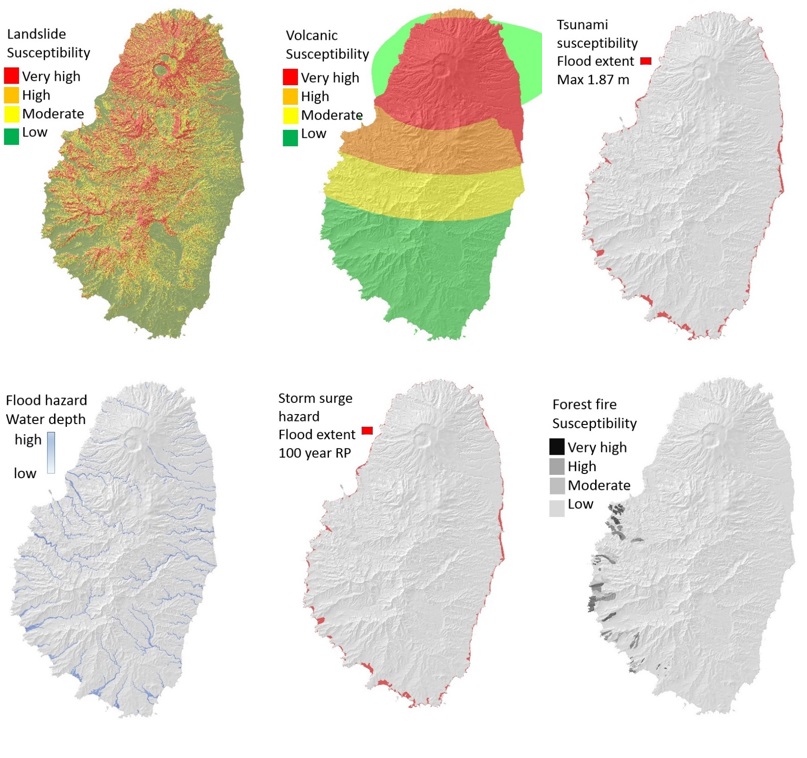 Ideally national scale hazard maps should represent the spatially distributed expected intensity (e.g. water depth, wind speed) for different frequencies and for different hazard types (coastal flooding, river flooding, landslides, tsunamis, volcanic eruptions, forest fires). So in fact one hazard map could consist of several maps that display the intensity per return period. The maps that are available for Saint Vincent partly fulfill this requirement. For one hazard (river flooding) we have maps that show water depth for different return periods. For some of the hazards, in particular for tsunamis, and coastal flooding, we have maps representing the expected extend of flooding for different return periods, however without depth information. For other hazards (volcanic hazards, landslide hazard and forest fires) we only have maps representing the relative spatial likelihood of the hazard, without information on the frequency and the intensity. We did not have hazard maps for two types of hazards: wind, and drought. However, given the objective of this use case (to develop a multi-hazard map indicating development restrictions due to natural hazards, and estimating the national level exposure), these two hazards are less suitable to include. The reduction of wind speed damage is related mostly to the building construction standards, and not so much to the spatial location of buildings, and it is not very likely that windspeed and drought would be used spatially to restrict housing development in certain areas. The method for generating the multi-hazard susceptibility map is described in use case 8.5.
Figure 1: National-scale susceptibility maps for landslides, volcanic hazards, tsunamis, floods, storm surges and forest fires. See Use Case 8.5 for more explanation.
Elements-at-risk data
In this use case we are restricting ourselves to a selection of elements at risk, namely buildings, population, land use and roads. This mainly due to the availability of suitable spatial data on these aspects.
Buildings
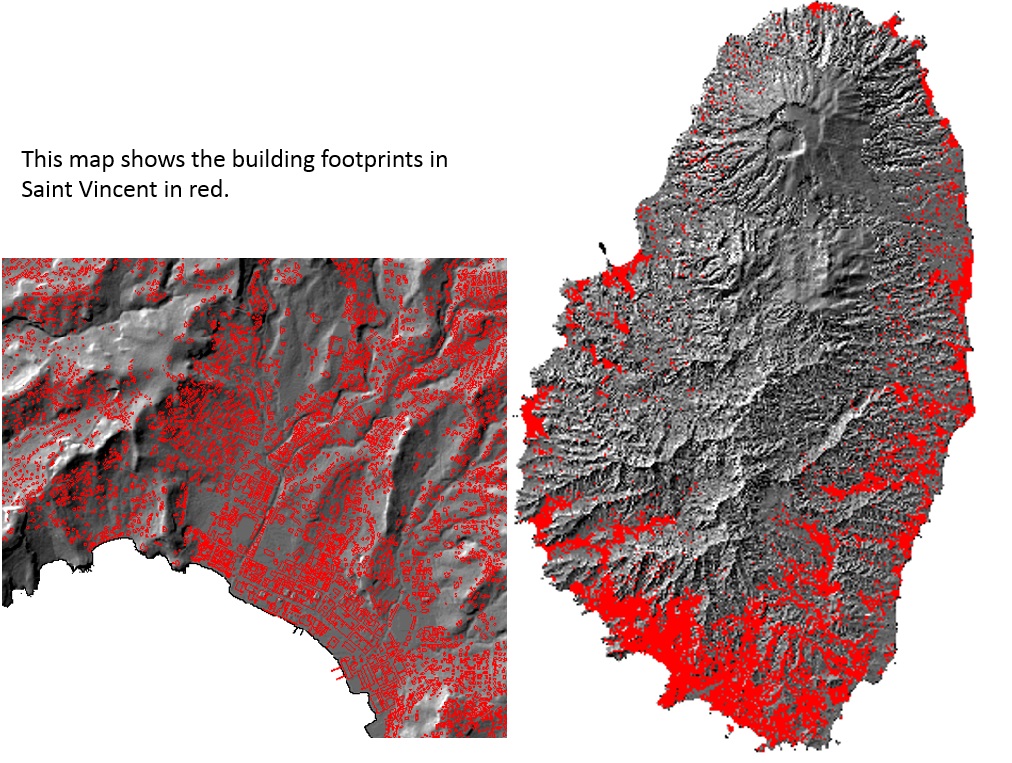 For Saint Vincent a building map is available from an unknown date (although we assume it is about 5 years old). It doesn't contain any attributes related to the land use types (e.g. differentiating residential buildings, from commercial, industrial etc.), construction types, number of floors, or people. Therefore, the exposure analysis can only be carried out at by analysing the number of buildings exposed in each hazard zone. You can find more information on the generation of building footprint maps in the Data Management book chapter 5, the Methodology book chapter 5, and in use cases 7.3 , 6.4 and 7.5.
Population information
Unfortunately we didn't have access to national census data, therefore the population data which is available is at a much aggregated level of the Parishes only. At that scale the population data is not very useful for the exposure analysis. It could therefore be better to use the building exposure as a proxy for the population exposure, even though we also do not have the information on the number of people per building.
Land use map
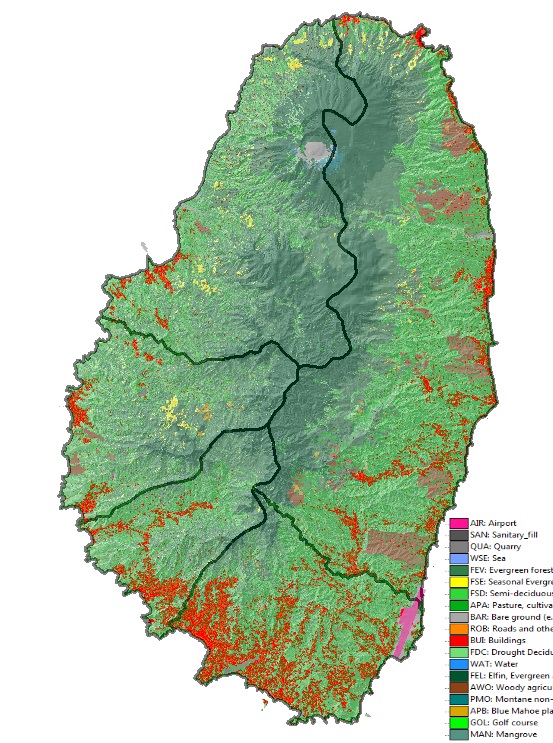 This map was generated by improving an existing land cover map. The land cover map was generated by the British Geological Survey based on automatic image classification using Pleiades satellite images from 2014, making use of ENVI software. The land cover map was very detailed spatially, but also contained substantial misclassification problems. Therefore new information was added related to the built-up areas, roads and quarries which were visually interpreted using very high resolution satellite images.
Infrastructure map
We also have a road map for Saint Vincent, which was modified based on image interpretation, representing the current situation. Also information on the airports is available. We do not have a map with the locations of critical infrastructures such as schools, hospitals etc.
Analysis steps:
The analysis involved the following steps:
1. Preparation of the hazard and susceptibility maps.
This involves the collection of the available information on the various natural hazards that may affect the island. This includes an extensive literature study on the frequency of past events, and the generation of a database of historical hazardous events. Also the collection of maps that portray information on the extent of the hazard. At this stage it is important to determine whether the information is available in the form of susceptibility maps only (without frequency and intensity information) or whether also hazard information is available. At this moment there are only rather general maps available for the various islands, and only Saint Vincent has sufficient data on various hazard types to carry out a basic exposure analysis. Risk analysis for multi-hazards is still not possible due to the lack of appropriate hazard maps, with information of frequency, intensity and extent, for the various hazard types. A proper multi-hazard risk assessment would also require the analysis of the interaction of the various hazard types, e.g. as indicated in table 1 above. The method for generating the multi-hazard susceptibility map is described in use case 8.5.
2. Preparation of the building map and parish map
Elements-at-risk maps are available for most of the islands in the form of building footprint maps, road maps, land cover maps and (in some cases) population distribution maps. For Saint Vincent we updated the existing building footprint map, and extensively edited the data to remove many erroneous polygons that were in the original database. We also updated the footprint map based on a recent very high resolution image and included the new airport, and the changes in buildings related to that. Unfortunately there were no building attributes, such as occupancy type, construction type, age etc. which would have been required in the case of quantitative multi-hazard risk assessment (See Methodology Book, 5.2 and 5.5). We also did not have population information per building. Otherwise we would have also been able to analyze the exposure of people to the various hazard types.
3. Overlay with building footprints
After generating the hazard/susceptibility maps for the individual hazard types it is possible to overlay these maps with the building footprint, and assign a susceptibility class to each of the buildings. The number of buildings located in high, moderate and low susceptible zones can then be calculated, and the building exposure of the different hazard types can be compared.
4. Aggregate the information by Parish
Finally, also the data can be aggregated by parish, by overlaying the parish map with the building footprint map, so that exposure statistics of individual and multi-hazard can be evaluated per parish.
Results:
We analyzed the building exposure for the individual hazard types. We followed the method described above for all hazard/susceptibility maps available.
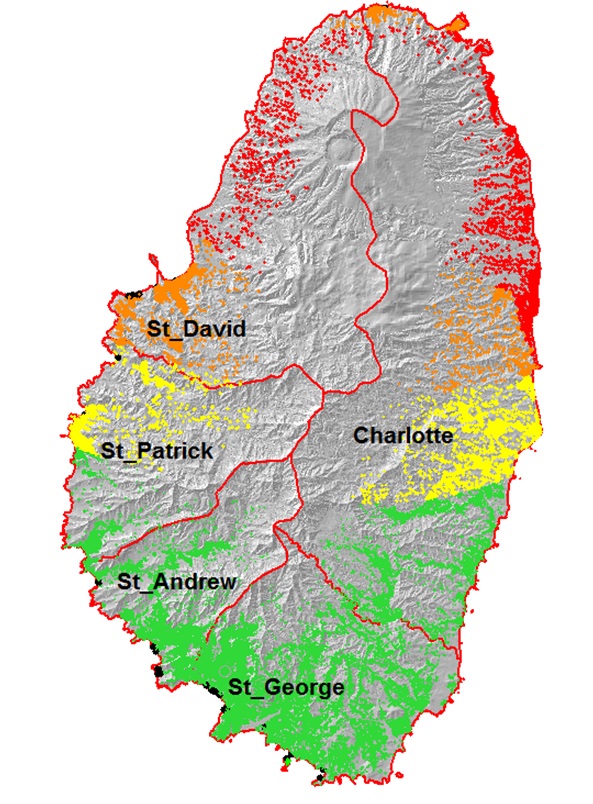
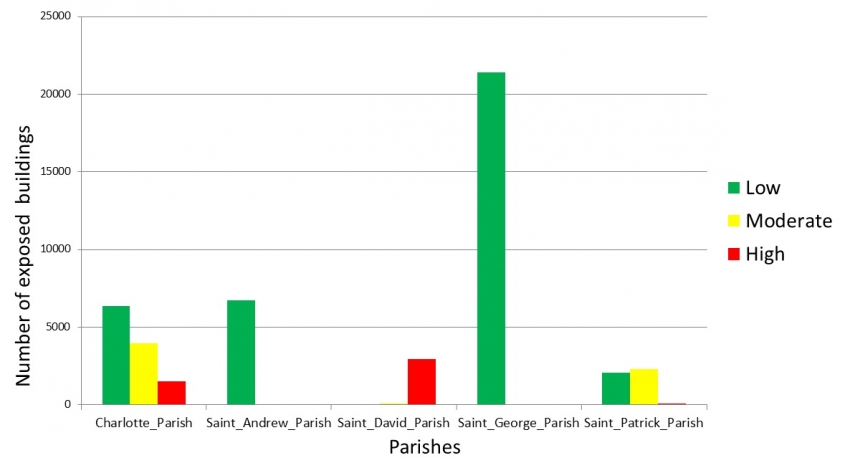
The figures below show the results for exposed buildings within the various parishes to volcanic hazards.
 |
 |
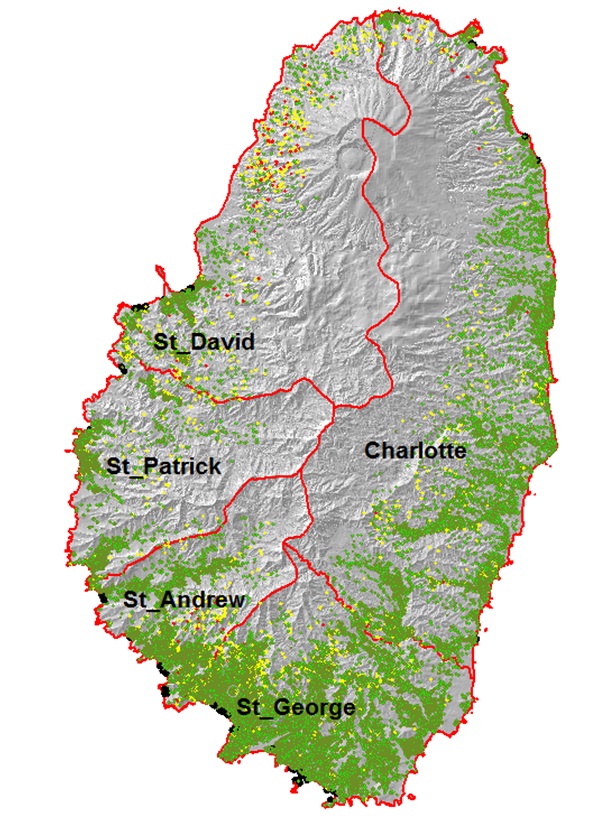
The figures below show the results for building exposure per parish for landslides.
 |
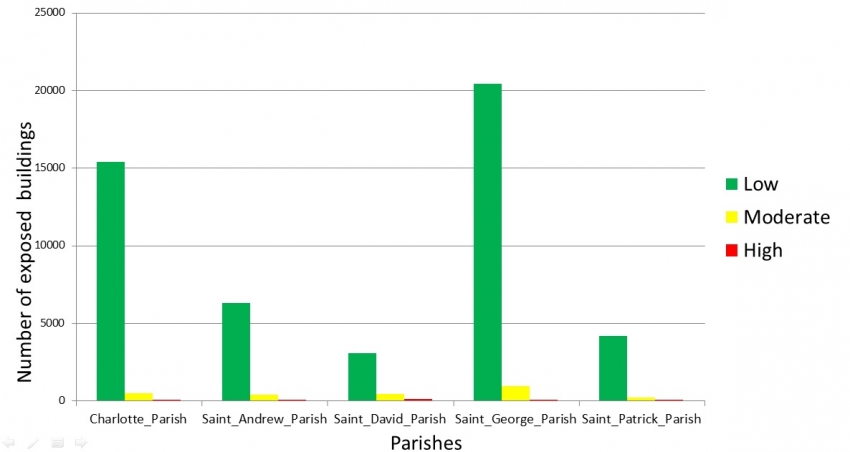 |
The tables below show the number of buildings exposed to the various types of hazards and their classes.
|
Parish |
Area susceptibility to volcanic hazards |
Tsunami susceptible area |
Storm surge hazard area |
|||||
|---|---|---|---|---|---|---|---|---|
|
|
Low |
Moderate |
High |
10 years |
25 years |
50 years |
100 years |
|
|
Charlotte_Parish |
6347 |
3924 |
1506 |
298 |
493 |
660 |
792 |
958 |
|
Saint_Andrew_Parish |
6695 |
0 |
0 |
219 |
265 |
305 |
328 |
356 |
|
Saint_David_Parish |
0 |
25 |
2900 |
126 |
188 |
233 |
259 |
282 |
|
Saint_George_Parish |
21394 |
0 |
0 |
604 |
861 |
988 |
1074 |
1154 |
|
Saint_Patrick_Parish |
2021 |
2285 |
50 |
140 |
273 |
352 |
390 |
457 |
|
total |
36457 |
6234 |
4456 |
1387 |
2080 |
2538 |
2843 |
3207 |
|
Parish |
Landslide susceptible area |
Forest fire susceptible area |
Flood hazard area |
|||||
|---|---|---|---|---|---|---|---|---|
|
|
Low |
Moderate |
High |
5 years |
10 years |
25 years |
50 years |
|
|
Charlotte_Parish |
15382 |
472 |
18 |
0 |
297 |
687 |
955 |
1113 |
|
Saint_Andrew_Parish |
6290 |
374 |
27 |
533 |
307 |
431 |
527 |
602 |
|
Saint_David_Parish |
3043 |
433 |
87 |
301 |
32 |
178 |
243 |
291 |
|
Saint_George_Parish |
20421 |
933 |
23 |
184 |
841 |
934 |
1059 |
1309 |
|
Saint_Patrick_Parish |
4146 |
199 |
10 |
661 |
208 |
429 |
540 |
594 |
|
total |
49282 |
2411 |
165 |
1679 |
1685 |
2659 |
3324 |
3909 |
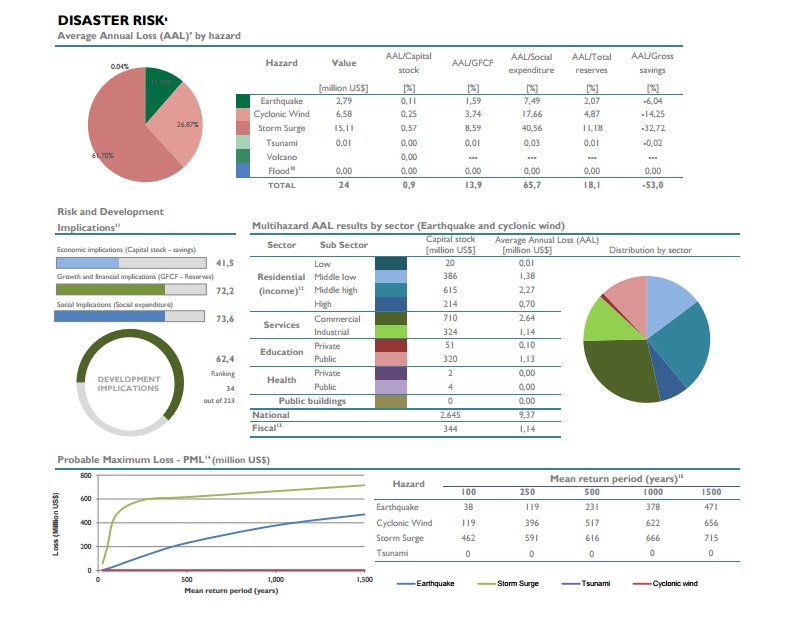
These results can be compared with those resulting from the study of the Global Risk Data Platform. This software was developed by UNISDR in collaboration with the World Bank, CIMNE, ERN and Ingeniar, with the generous financial support of the European Commission, and it is free, open source, under the Apache 2 license. It is conceived to be a module of the CAPRA (Comprehensive Approach to Probabilistic Risk Assessment) software suite of products (see www.ecapra.org), but it can be used in standalone form as a Spatial Data Infrastructure (SDI) and web mapping service for a wide range of applications.
Figure: Risk results for Saint Vincent from the above mentioned study. Click to access site for downloading results (also for other countries)
Conclusions:
The analysis of building exposure shows that a significant number of buildings are exposed to one or more natural hazards within the example country (Saint Vincent). More than 4400 buildings are located in areas that are designated as high volcanic hazard areas, 1300 in areas susceptible to tsunamis, 2000 to 3000 in coastal flood hazard areas, and 1600 to almost 4000 depending on the frequency. Less buildings are located in areas with high landslide susceptibility (around 165) but many more (around 2400) in areas with moderate landslide susceptibility. These relatively large number of exposed buildings are a source of concern, and attempts should be made to reduce these numbers through better planning and mitigation. One can argue that the six hazard and susceptibility maps are national level maps created with low quality input data, and that the maps are not adequate to make decisions with such immense socio-economic impact. Nevertheless, even though the maps may not be actual hazard maps in most cases (as they do not show frequency and magnitude) and may often also overestimate the hazard zones, they do certainly give clear indications where in future hazardous events may be expected, and that planners should be aware of this, in order to avoid more loss of lives and properties.
Similar exposure analysis can be carried out using other elements-at-risk data, such as population, roads, agriculture etc.
References:
Boruff, B.J. and Cutter, S.L. (2007). The Environmental Vulnerability Of Caribbean Island Nations. The Geographical Review 97 (1): 24-45,
CDMP [Caribbean Disaster Mitigation Project]. 1999. The TAOS/L Storm Hazard Model and CDMP TAOS/L Applications. Implemented by the Organization of American States, Unit of Sustainable Development and Environment for the USAID Office of Foreign Disaster Assistance and the Caribbean. Regional Program. http://www.oas.org/CDMP/hazmap/taos/taosdoc/taosfull.htm
CDMP (Caribbean Disaster Mitigation Project ) 2000. Atlas of Probable Storm Effects in the Caribbean Sea. Implemented by the Organization of American States, Unit of Sustainable Development and Environment for the USAID Office of Foreign Disaster Assistance and the Caribbean Regional Program.
DeGraff, J. (1988). Landslide hazard on St. Vincent, West Indies. Fresno, California.
DeGraff, J.V., Bryce, R., Jibson, R.W., Mora, S., and Rogers, C.T. 1989. Landslides: Their extent and significance in the Caribbean. In E.E. Brabb and B.L. Harrod (eds), Landslides: Extent and Economic Significance. p. 51-80. Rotterdam: A.A. Balkema
Lindsay, J.M., Robertson, R.E.A., Shepherd, J.B. and Ali, S. (2005) Volcanic Hazard Atlas of the Lesser Antilles. University Of The West Indies
NGDC [National Geophysical Data Center]. 2003. Tsunami Data at NGDC. Boulder, Colo.: National
Geophysical Data Center. www.ngdc.noaa.gov/seg/hazard/tsu.shtml
Parsons, T. and Geist, E.L. 2009. Tsunami Probability in the Caribbean Region. Pure appl. geophys. 165 (2009) 2089–2116. Available from : http://woodshole.er.usgs.gov/project-pages/caribbean/pdf/Parson_Geist_PAGeoph2009.pdf
Richardson, B. C. 1989. Catastrophes and Change on St. Vincent. National Geographic Research 5 (1): 111-125.
Richardson, B. C. 2004. Igniting the Caribbean’s Past: Fire in British West Indian History. Chapel Hill: University of North Carolina Press.
Robertson, R. E. A. 1995. An Assessment of the Risk from Future Eruptions of the Soufriere Volcano of St.Vincent, Natural Hazards 11 ( 2 ) : 163-19
Smith, M. S., and J. R. Shepherd. 1993. Preliminary Investigations of the Tsunami Hazard of the Kick
'em Jenny Submarine Volcano. Natural Hazards 7 (3): 257-277.
SRU [Seismic Research Unit]. (2005). Volcanoes. University of the West Indies, Seismic Research Unit.
SRU [Seismic Research Unit]. (2007). Earthquakes. University of the West Indies, Seismic Research Unit.
Last update: 01-04-2016