

Summary
In this use case, an evaluation of automated building footprint extraction versus manual digitizing is made. Guidelines are offered as to developing a digitizing strategy and building attribute population options are discussed.
Use case intended for: Spatial analist
Keywords:
Building Footprints, Digitizing, Attributes
| Before you start: | Use case Location: | Uses GIS data: | Authors: |
|---|---|---|---|
|
To carry out some of the analysis in this Use Case, it would be useful to have some basic GIS skills. |
Dominica | Yes. Go to GIS exercise | Tarick Hosein |
Introduction:
Building footprints constitute a foundational dataset for the definition of elements at risk in the prediction and management of disaster mitigation, preparedness and response. The base dataset is generally shown by polygons representing the outline of the building roofline. These starting blocks can be complimented with engineering and/or population information representing the structure, the use of the structure, land use and demographic information. As physical development is not static, it is important that the dataset be frequently updated. While some countries are able to incorporate development planning and cadastral surveys applications as mechanisms to updating GIS data, many of the small island developing states (SIDS) cannot. SIDS are often faced with problems in unplanned, unregulated and undocumented development.
For many SIDS, modern technology offers an opportunity for large area mapping in a timely and feasible manner. Such methods may include photography from drones, aerial surveys and satellite imagery. While each method has its advantages their limitations must be carefully assessed, especially as photography and imagery based projects must fulfill the needs of many stakeholders. Similarly, social participation using mobile technology and social services such as Open Street Map (OSM) can be of great benefit in mapping, especially for building attribute and demographic information.
Objectives:
The extraction of data from images is a well-established methodology in GIS. Depending on the image - its spectral, spatial and temporal resolution - interpretation of features/objects can be done automatically or manually. The purpose of this use case is to provide users with:
- Guidelines for base data selection.
- Guidelines for image preparation.
- Guidelines for choosing automatic vs manual building extractions.
- Guidelines for manually digitizing buildings.
- Guidelines for feature interpretation.
- Suggestions for attribute collection
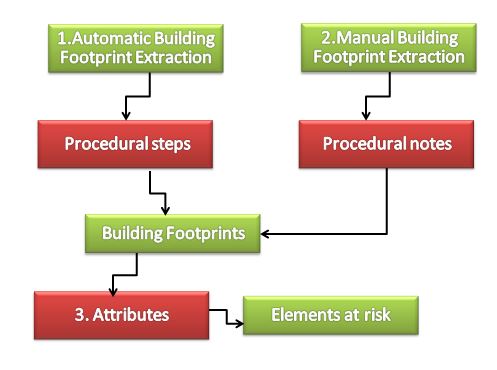
Flowchart:
Problems definition and specifications:
Built-up areas are constantly changing and expanding. This poses a challenge to those responsible for mapping and maintaining building definition layers in GIS databases, especially when confronted with informal settlements. Clear distinction should be made between features used for measuring and locating purposes versus features that may be used in reference GIS analysis. It is generally accepted that data used for GIS purposes may lack the rigors of meeting accuracy standards, as such, data would be used for referencing purposes. The ASPRS notes the difference between the two data usages and suggests clear disclaimers regarding how the data should be used:
Vector and feature data extracted solely for referential purposes, not represented as surveying information or data and not expected to comply with a specific accuracy standard. Includes referential GIS layers such as inventory maps, resource management boundaries, GIS centerline data and similar applications; must be accompanied by an appropriate disclaimer stating that the mapping should not be used for measuring or locating features. ASPRS 2009.
It becomes important that expected use of the data be clearly defined prior to the acquisition of suitable data and use of the data. This distinction and subsequent recommendations should be covered in NSDI policies. As most SIDS do not have functional NSDIs, the mapping agency is responsible for determining the needs and appropriate methodologies for data collections, especially building footprints.
Data requirements:
While there are varying methodologies for mapping, the end decision is based on; the finance; available data; software; and human capacity. Table 1 shows a comparison of the different methodologies that can be used. In this use case high resolution satellite imagery or an orthophoto derived from aerial photos is required.
|
Methodology |
Costs |
Accuracy |
Data Required |
Software requirements |
Skills requirements |
Remarks |
|---|---|---|---|---|---|---|
|
Field Surveys |
+++++ (V. High) |
++++
|
|
|
Surveying Technical |
Not suitable for large areas |
|
Aerial Photogrammetry - Digital mapping of aerial photographs captured by light aircrafts using a metric cameras |
++++ |
+++
|
Stereo overlapping Vertical aerial photographs |
Digital Stereoplotter |
Experienced stereoplotting operators |
Suitable for large areas. High costs associated with acquiring photos, software and operators. |
|
UAV Mapping - Digital mapping of aerial photographs captured by UAV cameras |
++ |
++++
|
Stereo overlapping Vertical aerial photographs |
UAV processing software Digital Stereoplotter |
Experienced stereoplotting operators |
Not suitable for large areas. High costs associated with software and operators. |
|
Aerial Photogrammetry Mosaics - Digital mapping of aerial photographs captured by light aircrafts using a metric cameras |
+++ |
+++
|
Mosaics |
Basic GIS software, including open source can be used for mapping. |
Basic GIS skills |
Suitable for large areas. High costs associated with acquiring photos and developing mosaics. |
|
UAV Mapping Mosaics - Digital mapping of aerial photographs captured by UAV cameras |
+ |
++++
|
Stereo overlapping Vertical aerial photographs |
Low cost cloud processing is available for processing images and generating mosaic. Basic GIS software, including open source can be used for mapping. |
Experienced stereoplotting operators |
Not suitable for large areas. High costs associated with software and operators. |
|
Satellite Imagery |
++ |
++ |
Satellite Imagery |
Basic GIS software, including open source can be used for mapping |
Basic GIS skills |
Suitable for large areas. Low cost of data. Pre-mapping processing of the data may be required to improve accuracy. |
Table 1: Comparison of various mapping methodologies
Analysis steps:
General Application
Procedure for Footprint Extraction Preparation
1. Pre-processing and Adjustment of Data
As with any dataset, before using the data should be checked. In addition, the geometric and radiometric properties may be improved to facilitate building extraction. It is important to ensure that the data is georeferenced correctly and adjusted using control data. Satellite imagery may be reprocessed using a national DEM, as most image suppliers would use the SRTM DEM. As this would require additional resources, some adjustment using rubber sheeting may be applied as an alternative. An accuracy assessment of the data should also be independently made by the client or their independent consultant. Subsequently all this information should be documented in the metadata of the data.
2. Digitizing of Building Footprints
There are various options for digitizing building footprints from photographs or imagery. These methods include automated extraction using object oriented analysis (OOA) software; automated extraction using multispectral classification; and manual digitizing. The use of OOA software will require specialized software and image manipulation skills. Multispectral classification is another automated method that require image manipulation skills but can be done using a number of open source software applying the same methodology as land use classifications. For many operators, manually digitizing buildings is a valid option. For most small islands, such work can be completed by 5 operators within 1 month (based on an average digitizing rate of 75 buildings per hour).
3. Metadata
As with the creation of any GIS dataset, the metadata information should be updated. It is important that users know the source of the data; the person or agency that created it; the method used; expected accuracy; and dates of creating and last updating among the security, distribution and other pertinent information. If the digitizing work is contracted, then the contractor should be required to deliver the data with ISO standard metadata formats, unless a local standard is defined as part of an NSDI.
4. Attribute Information
As previously discussed, building attribute information should ideally be populated. This can be done using different methodologies either directly using field visits or crowd sourcing or indirectly using secondary data such as demographic information from census statistical divisions.
Digitizing Building Footprints and Populating Attribute Data
There is no one data methodology/type that is absolutely suitable. Field surveys are unsuitable for large areas, but may be appropriate for site development and subsequent maintenance of data. Traditionally, aerial photogrammetry has been and continues to be the most sought-out method of obtaining aerial photography. Besides the use of the high quality imagery for mapping, the stereo photography is often used in court cases for land disputes. However, aerial photogrammetric projects are costly and are usually done every 10-20 years. UAV photography offer low cost solution to aerial photography. With the costs of drones as low as $1500 USD, the system offers great potential especially for photography and GIS dataset maintenance. However, drones are not suitable for large area mapping; poses a number of health and safety risks; and requires specialized image processing to extract DEMs and orthophotos. Alternatively, the cost of UAV image processing can be reduced using online cloud applications allowing for processing at a fraction of the cost of specialized software and processing hardware. For large area mapping, remote sensing imagery offers the most economical solution; high resolution, 30cm multispectral imagery costs less than $25 USD per sq.km for archive data (>90 days).
The preparation of imagery depends on the nature of data. Besides the geometric correction required of satellite imagery, radiometric correction can enhance the imagery to improve visual and digital interpretation of the data. Data manipulation such as pan-sharpening can improve the "resolution", allowing 2m resolution spectral information to appear as 30cm resolution data (depending on the satellite data). Combined with the use of filters to enhance and highlight features, the interpretability of the data is improved. Preparation can also include comparing temporal images and highlighting changes, making updating easier.
For most small islands, manual digitizing is a feasible and economical solution. Manual digitizing can be accomplished in a matter of weeks without the need for specialized software or skills. It also allows for more interpretability of the features leading to some possibility of building use interpretation especially when digitized by those with local knowledge. Automated methods may not suitable because of the following reasons:
- Building patterns in the small islands are generally irregular in shape, size and layouts.
- Close buildings and vegetation proximity complicate automatic interpretation.
- Buildings usually appear as tilted features, complicating the interpretation of edges; tilts are more profound for lower flights such as UAV photography and taller buildings.
- Automatics extraction not a one button process, it usually requires interactive, iterative tweaking of parameters and applied over small areas; a function of skill and time.
- Automatic extraction usually still requires cleaning-up after processing.
Although manual digitizing has been suggested, automatic tools, especially cognitive algorithms can be considered. Vinci et al. (2014) provided a detailed technical document on building extraction using open source plugin tools within QGIS and Grass. The two sections below outline the use of a proprietary software: Erdas Imagine Objective; and guidelines for manual digitizing.
Automated building extraction using Erdas Imagine Objective
Objective offers automated workflows, data integration; use of multiple remote sensing imagery including panchromatic, multispectral and LiDAR; while allowing for fine-tuning of the processing. The procedural steps involve: image preparation; pixel classification; object clustering; building object structures; raster to vector polygon conversion; shape refinement and vector clean-up.
1. Image preparation
This stage of the process is all about preparing the images for use. This includes homogenization of the images, and improving the radiometric and spatial resolution of the image bands. Strategies may include the application of contrast stretches, filters and pan-sharpening.
2. Pixel based classification
The first step in this process is to undertake a pixel based classification based on input training samples. The software does a single feature probability analysis.
3. Object clustering
Clustering of pixels into distinct groups, followed by segmentation of the image based on pixel value and locations.
4. Build object structures
Using filters, the Raster Objects can be manipulated to closely resemble the raster feature of interest.
5. Convert raster object clusters to vector polygons
Converts the raster object to vectors polygons.
6. Improve the shape of vector polygons
Applies filters to the converted vectors to further shape the vectors to the desired feature representation.
7. Refine the shape of vector polygons
Classifies the vector objects via cues based on some property of the input vector and assigns a probability to each object in a group of vector objects resulting in Geometry- Rectangularity.
8. Vector clean-up
The final manipulation to the vector dataset- cleaning up the vectors to produce the most accurate representation of the desired raster feature.
Manual Building Extraction
This methodology is considered rudimentary and basic GIS skill. While some information is given here, it is given as a guide and will not be part of the worked out use case.
1. Image preparation
This stage of the process is all about preparing the images for use. This includes homogenization of the images, and improving the radiometric and spatial resolution of the image bands. Strategies may include the application of contrast stretches, filters and pan-sharpening.
2. Heads-up digitizing
This is standard on screen digitizing of features from the imagery. This process can be done in almost all GIS software including IlWIS and QGIS. The following should be noted as guidelines for digitizing:
- An ergonomic work environment should be maintained.
- A policy documented should be done to ensure that the expected standards, procedures and responsibilities are clearly defined and agreed upon before staring. This will include examples of: what features should be digitized; the smallest size of features to be digitized; comfortable viewing scales; feature styles specifications including colours and linework. If needed, training should be provided.
- Base data (imagery) should be divided into smaller blocks so as to reduce duplication, and define production outcomes.
- Feature Layers should be clearly defined at the start: layers created; coordinate system configured; metadata populated; and appropriate feature colour and linetype defined.
- An appropriate zoom scale of the base image should be set. This will affect the interpretability of feature edges, ensures that relative accuracy of buildings is maintained to same standard. The zoom level should be visually comfortable to the operator, but higher than the anticipated production scale of the information.
- Typically, the smallest features to be digitized should represent a minimum of 3 pixels.
- Building roofs should be digitized as closed polygons. If the displacement/tilt of the building is large, then the polygon should be move to the base of the feature.
- Where the displacement is large due to tall features, then an adjustment that includes, a translation, rotation and scaling may be required.
- Depending on the purpose and accuracy required; buildings partially covered by trees should be approximated if the work is for GIS referencing; if the work must meet positional and measurement standards then the building should be highlighted and checked with field surveys.
- If the software permits, post digitizing squaring of the buildings should be done. This will ensure that for a given building, each building corner is orthogonally connected.
- If possible, some attributes may be inferred and attached to the building during digitizing.
- Operators are encouraged to take frequent breaks during digitizing so as not to become fatigued thus reducing digitizing accuracy.
- At the end of each section, the work should be reviewed within the block and in relation to the bigger scene to ensure conformance.
- Once the block is approved, the data should be integrated with other blocks and all metadata updated.
- All partial works and smaller temporary blocks should either be discarded or clearly separated from the database.
- All partial and uncertain building information
- All work should be saved in duplicate.
3. Inferred Attributes
A benefit of the manual method, especially when done by individuals with local knowledge, is the ability to include inferred information about the buildings based on their visual characteristics as shown in Table 2.
|
Visual Characteristics relevant to buildings |
Interpretation |
Example |
|---|---|---|
|
Shape |
Features can be interpreted based on their shape |
|
|
Size |
Distinguish between the land use of features |
|
|
Colour / Tone |
Distinguish between the land use of features
Highlight building additions |
|
|
Location / Association |
Allows for association of buildings types and location.
In this example the coastline is visible. By associating between the land and sea we can interpret the feature as a jetty, not a building. Most automatic interpretations would define it as a building. Knowing it"™s a jetty we can associate the region on the land side as a port based on its location and size. |
|
|
Shadow / Lean |
Gives an indication of height and orientation.
In this example the number of building floor can be counted, which is a useful attribute. However, the example also shows the possible error in mapping the building footprint. |
|
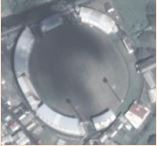
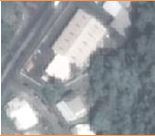
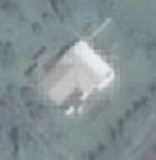
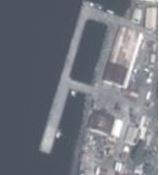
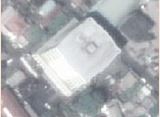
Table 2: Building Interpretation Cues
Capture Building Attributes
Building attributes are an important aspect of risk assessments. Simple attributes such as building height/floor count, occupants at day/night, and ownership can be used to define elements at risk, vulnerability and feasibility of mitigation. Table 3 shows a list of attributes that would consist of an ideal collection of attributes, and potential sources within an open source inventory data capture tool developed by the GEM foundation. While the tool was developed primarily for meeting the expectation of earth quake vulnerability assessments, it database meets the expectation for multi-hazard assessment; as needed for high risk communities including SIDS. The drawback of the mass attribute data collection is usually financial constraints and time taken to populate such a database, especially when only a small section of the database may be of interest for a particular hazard. Alternatively, social participation may be key alternative or complement to field interviews.
Social/Public participation has become a valid methodology for data collection, especially when there is public "buy-in" for its need. Technology/Software such as Open Street offers a platform whereby the public can add street level information, including information on buildings. This media has the potential of increasing the productivity of building attribute population by having home and public inputs. However, there is a number of problems associated with this method, these includes:
- False reporting of information
- Misinterpretation and misunderstanding of the required attribute information
- Open sharing of "sensitive" material
- Lack of participation due to digital divide; economic circumstances; fear and mistrust; and, other reasons
In addition to these considerations, critical facilities require additional consideration. Facilities such as hospitals, schools, and shelters are considered to be highly vulnerable resources. As they are expected to remain operational or serve multiple functions during a disaster, their evaluation will require more detailed information and is considered to be important in the assessment of risk.
|
Attribute |
Source |
|---|---|
|
Structural Types |
As-built/proposed design; field observations |
|
Construction materials |
As-built/proposed design; field observations |
|
Building code applied |
As-built/proposed design |
|
Age |
As-built date; interview |
|
Maintenance |
Interviews; maintenance records |
|
Roof Type |
As-built/proposed design; field observations |
|
Building Height |
As-built or proposed designs; LiDAR; Photogrammetry; field measurements |
|
Floor Space |
As-built/proposed design; building footprint; field observations |
|
Building Volume |
As-built/proposed design; building footprint and height; field observations |
|
Shape |
As-built/proposed design; building footprint; field observations |
|
Location/Proximity to features including water courses and other buildings |
Footprint and topographic maps; field observations |
|
Number of Floors |
Can be computed based on average floor height; as-built/proposed design; field observations |
|
Building use |
Field observations; possible visual interpretation |
|
Walls and other flood prevention mechanism |
Field observations |
|
Building Spacing |
From footprint and topographic maps; field observations |
|
Connections |
As-built/proposed design; field observations |
|
Damping |
As-built/proposed design; field observations |
|
Weight Distribution |
As-built/proposed design; field observations |
|
Building Configuration |
As-built/proposed design; field observations |
|
Location of openings |
As-built/proposed design; field observations |
|
Building Tenure |
Field interviews |
|
Building Ownership |
Cadastral information; field interviews |
|
Demographic: household population; ages; ethnicity; sex; income |
Statistical office; field interviews |
Table 3: IDCT Input Data and Potential Sources (GEM Foundation)
Example applications
For the examples utilized in this Use Case, we use the following data:
- Pleiades 2014 satellite image. Pleiades was deemed appropriate for this study due to its high spatial resolution. The multispectral bands are 2m with a panchromatic band of 50cm. The multispectral bands are blue, green, red and near infrared. The infrared band allows for band combinations outside the visible region to enhance the feature extraction capabilities of algorithms in image interpretation software.
Dominica - Pleiades Satellite Imagery
The imagery consists of Red, Green Blue and Infrared multispectral bands of 2m resolution and a 0.5 m panchromatic. As part of the data preparation, the contrast is improved and pan sharpening of the multi-spectral imagery is done. The pan sharpening process improved the spatial resolution of multispectral data by fusing the data with the panchromatic data as shown in Figure 1. As a result of the pan-sharpening, the multispectral data will have resolution of 0.5m. For the purpose of the analysis, the infrared band is used to enhance the feature extraction capabilities of algorithms in the image interpretation software.
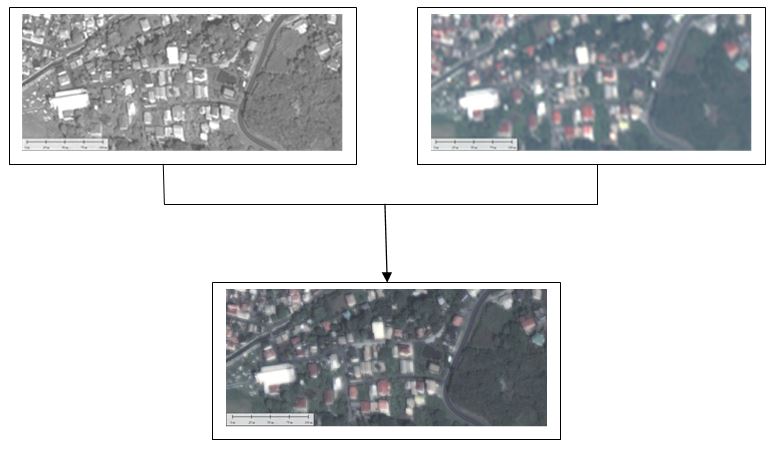
Figure 1: Pan sharpening the image
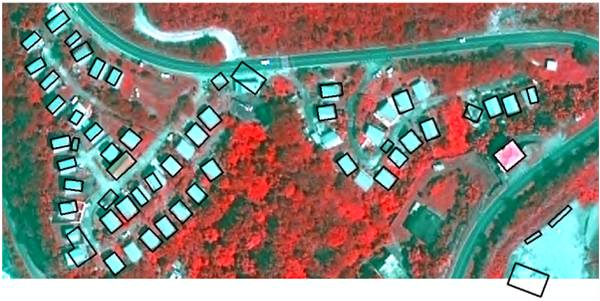
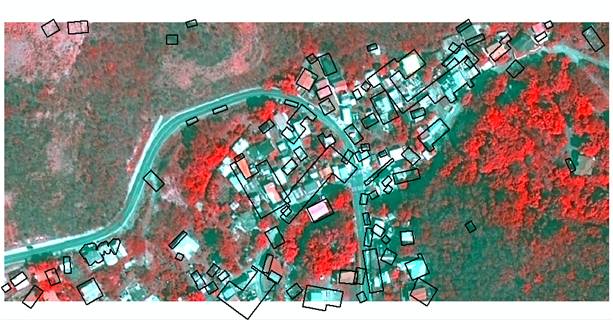
In practice automatic extraction should not be done over a large non-homogenous areas, as the parameterization required for different densities and distributions would change based on the physical and spectral expression of the settlements and their surroundings. To demonstrate the success and problems under different conditions the examples will demonstrate the extraction for two sample areas consisting of a low-density residential development and a higher density settlement, as shown in figure 2. The first consist of low density housing with somewhat regular developments as represented by the building footprints and spacing between them. The second development represents an irregular high density distribution of housing.
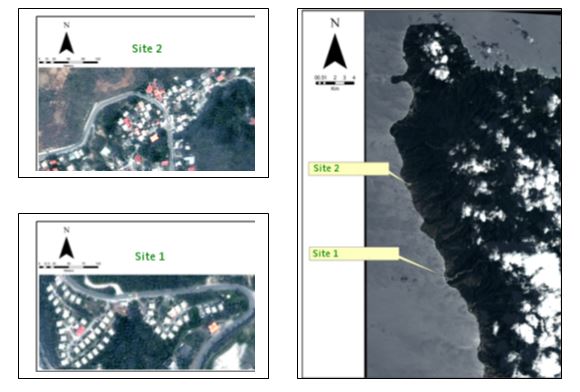
Figure 2: Study area
The procedural steps used for site 1 were applied to the site 2 portion of the imagery, illustrating that the same method will not be accurate for the entire island of Dominica. Parameters were modified to give the best output for the site 2. Details of the parameterization is not specified here as they are not standard between software and usages. In most cases, the processes must be done iteratively to refine the results at each stage. Figure 3 illustrates the temporary results of each procedural stage.
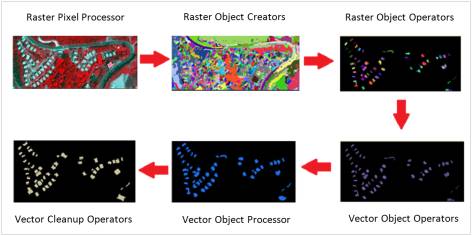
Figure 3: Procedural steps
Results:
The top most figure represents the lower density area. The buildings are of a much bigger size with setbacks from neighboring buildings. The black represents the extracted features. Almost all buildings have been accurately captured with minor cleaning up to be done to the dataset. There are few misrepresented buildings and even fewer omitted buildings.
The middle figure shows the same parameterization applied to a higher density, less regularly structured development. The results of which is erroneous with many errors.
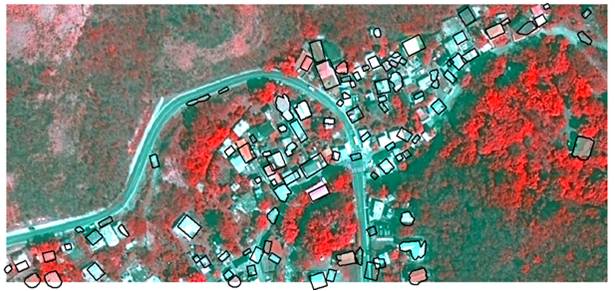
When the parameters are tweaked, a much better result is obtained. However, there are misrepresented buildings edges, shape and sizes, incorrectly placed building vectors, and omitted buildings.
Conclusions:
For many small island states, the traditional method of on screen digitizing is a more feasible methodology to mapping building footprints. Although automated methods are available, the use, skills needed, the parameterization time and cleaning-up required can be substantial. The skills needed for on screen digitizing is relatively low and can be done using basic GIS software. Although some care will be required by the operators, the project can be done in-house with little resources and completed in a reasonable time.
On screen digitizing by local operators also creates the opportunity to populate some of the building footprint attribute information based on inferred properties and local knowledge. The possible use of social media, such as open street map, also offers some prospects to the building footprint attribute population, however there may still be the need for onsite visits, for validation and completion. The IDCT offers field collection capacity for onsite attribute collection and database building without the need for GPS enabled devices.
References:
ASPRS 2009 Guidelines for Procurement of Professional Aerial Imagery, Photogrammetry, Lidar and Related Remote Sensor-Based Geospatial Mapping Services. http://www.asprs.org/standards-activities.html
Global Earthquake Model (GEM) Building Footprint Extraction Guidelines and Procedures Http://www.globalquakemodel.org/resources/publications/technical-reports/user-guide-geospatial-tools-building-footprint-and/
GEM Inventory Data Capture Tools http://www.globalquakemodel.org/resources/use-and-share/tools-apps/
Last update: 07 - 04 - 2016