

What is a hazard?
The earth is shaped by endogenic processes, caused by forces from within the earth, resulting in hazardous events like earthquakes or volcanic eruptions, and exogenic processes, caused by forces related to the earth’s atmosphere, hydrosphere, geosphere, biosphere and cryosphere and their interactions. Anthropogenic activities have had a very important influence on a number of these processes, especially in the last two hundred years, for instance through the increase of greenhouse gasses, leading to global warming, but also through dramatic changes in the land cover and land use, and overexploitation of scarce resources. The above mentioned processes from endogenic, exogenic and anthropogenic nature may lead to potentially catastrophic events, even in locations that may be far away. For instance earthquakes might trigger landslides which may lead to landslide- dammed lakes that may break out and cause flooding downstream. Or the dams of large reservoirs in mountains, constructed for hydropower, irrigation or drinking water, may fail under an earthquake or extreme rainfall event and cause a similar flood wave.
These potentially harmful events are called hazards. The term “Hazard” has been used with different implicit meanings. In this Handbook we will use the following definition of hazard of the UN-ISDR as “A dangerous phenomenon, substance, human activity or condition that may cause loss of life, injury or other health impacts, property damage, loss of livelihoods and services, social and economic disruption, or environmental damage. This event has a probability of occurrence within a specified period of time and within a given area, and has a given intensity.”
Hazards can be classified in several ways. A possible subdivision is between:
- Natural hazards are natural processes or phenomena within the earth's system (lithosphere, hydrosphere, biosphere or atmosphere) that may constitute a damaging event (such as earthquakes, volcanic eruptions, hurricanes);
- Human-induced hazards are modifications of natural processes within the earth's system (lithosphere, hydrosphere, biosphere or atmosphere) caused by human activities which accelerate/aggravate damaging events (such as atmospheric pollution, industrial chemical accidents, major armed conflicts, nuclear accidents, oil spills);
- Human-made hazards or technological hazards: dangers originating from technological or industrial accidents, dangerous procedures, infrastructure failures or certain human activities, which may cause the loss of life or injury, property damage, social and economic disruption or environmental degradation (Some examples: industrial pollution, nuclear activities and radioactivity, toxic wastes, dam failures; transport, industrial or technological accidents (explosions, fires, spills).
Another classification is according to the main origin of the hazard in geophysical, meteorological, hydrological, climatological, biological, extraterrestrial and technological (See Table 1, from Guha-Sapir et al., 2016). Such classification are always a bit arbitrary, and several hazard types could be grouped in different categories, e.g. landslides could be caused by earthquakes, extreme precipitation and human interventions.
Table 1: Classification of hazard types as used by the International Disaster Database EM-DAT (Guha-Sapir et al., 2016), which is based on and adapted from the he IRDR Peril Classification and hazard Glossary (IRDR, 2014)
|
Main Group |
Main Sub-group |
Main Type |
Sub-Type |
|---|---|---|---|
|
Natural |
Geophysical: A hazard originating from solid earth. This term is used interchangeably with the term geological hazard. |
Earthquake |
Ground shaking, tsunami |
|
Mass movement |
|
||
|
Volcanic |
Ash fall, lahar, pyroclastic flow, lava flow |
||
|
Meteorological: A hazard caused by short-lived, micro- to meso-scale extreme weather and atmospheric conditions that last from minutes to days. |
Storm |
Extra-tropical storm, tropical storm, convective storm |
|
|
Extreme temperature |
Cold wave, heat wave, severe winter conditions |
||
|
Fog |
|
||
|
Hydrological: A hazard caused by the occurrence, movement, and distribution of surface and subsurface freshwater and saltwater. |
Flood |
Coastal flood, riverine flood, flash flood, ice jam flood. |
|
|
Landslide |
Avalanche (snow, debris), mudflow, rockfall |
||
|
Wave action |
Rogue wave, seiche |
||
|
Climatological: A hazard caused by long-lived, meso- to macro-scale atmospheric processes ranging from intra-seasonal to multi-decadal climate variability. |
Drought |
|
|
|
Glacial Lake outburst |
|
||
|
Wildfire |
Forest Fire, land fire (bush, pasture) |
||
|
Biological: A hazard caused by the exposure to living organisms and their toxic substances or vector-borne diseases that they may carry. Examples are venomous wildlife and insects, poisonous plants, and mosquitoes carrying disease-causing agents such as parasites, bacteria, or viruses (e.g. malaria). |
Epidemic |
Viral , bacterial, parasitic, fungal, prion disease |
|
|
Insect infestation |
Grasshopper, locust |
||
|
Animal accident |
|
||
|
Extraterrestrial: A hazard caused by asteroids, meteoroids, and comets as they pass near-earth, enter the Earth’s atmosphere, and/or strike the Earth, and by changes in interplanetary conditions that effect the Earth’s magnetosphere, ionosphere, and thermosphere. |
Impact |
|
|
|
Space weather |
Energetic particles, geomagnetic storm |
||
|
Technological |
Industrial accident |
|
Chemical spills, collapse, explosion, fire, gas-leak, poisoning, radiation, other |
|
Transport accident |
|
Air, road, rail, water |
|
|
Miscellaneous accident
|
|
Collapse, explosion, fire, other. |
Another classification is used by UN-ISDR (2009)
Table 2: Classification of hazard types as used by the UN-ISDR (2009): https://www.unisdr.org/we/inform/terminology
|
Hazard type |
Explanation |
|---|---|
|
Biological hazard |
Process or phenomenon of organic origin or conveyed by biological vectors, including exposure to pathogenic micro-organisms, toxins and bioactive substances that may cause loss of life, injury, illness or other health impacts, property damage, loss of livelihoods and services, social and economic disruption, or environmental damage. |
|
Geological hazard |
Geological process or phenomenon that may cause loss of life, injury or other health impacts, property damage, loss of livelihoods and services, social and economic disruption, or environmental damage |
|
Hydro-meteorological hazard |
Process or phenomenon of atmospheric, hydrological or oceanographic nature that may cause loss of life, injury or other health impacts, property damage, loss of livelihoods and services, social and economic disruption, or environmental damage. |
|
Technological hazard |
A hazard originating from technological or industrial conditions, including accidents, dangerous procedures, infrastructure failures or specific human activities, that may cause loss of life, injury, illness or other health impacts, property damage, loss of livelihoods and services, social and economic disruption, or environmental damage |
This handbook focuses on hydro-meteorological hazards and specifically on flooding and landslides. Flooding can be either fluvial flooding affecting large watershed (e.g. in Belize) or flash flooding in smaller watersheds (like in Dominica, Saint Lucia, Saint Vincent and the Grenadines and Grenada).
Hazard Characteristics
Hazards have a number of characteristics that should be understood in order to be able to analyse them and subsequently reduce their potential damage.
- What? Hazard types. It is of course very important to know what type of hazard may occur, as each hazard type has different characteristics (See below). Each hazard type, as indicated in the tables above, may also have different techniques for analysis and different input data needed to analyse it. The methods for flood hazard assessment are explained in chapter 3 and for landslide hazard in chapter 4. Hazards may occur as individual events (single hazards), or several types of hazards might occur in the same area. In such case multi-hazard assessment is important which is a difficult task (See section 5.4). The Caribbean islands are affected by multi-hazards, like flashfloods, coastal storm surges, windstorms, landslides, volcanic eruptions, earthquakes, tsunamis, wildfires and drought.
- Where? Hazards are spatially different. Hazard levels are different for different locations, so it is important to indicate zones that might have a similar level of hazards. That is why many hazard types need to be analysed spatially, using Geographic Information Systems, which are computerized systems for the collection, visualization, analysis, management, sharing and communication of spatial information. The data management book deals with many aspects related to spatial data for hazard and risk assessment relevant for the Caribbean region. The result of a hazard analysis is therefore often a hazard zonation, which subdivides the land into more or less homogenous zones with the same level of hazard. Maps that display zones with the relative likelihood of hazards, without providing information on hazard frequency and/or intensity are also called susceptibility maps. Such maps may also indicate how likely it is that a certain hazard might occur at a certain location. This is called spatial probability. For example a landslide susceptibility map might have three classes (high, moderate and low), and for each class the density of past landslides can be calculated as an indication of the spatial probability of landslide occurrence.
- How often? Temporal probability. Hazards with certain sizes may occur with certain frequencies, as small events may occur often, and large events seldom. The magnitude of the hazard gives an indication of the size of the event, or the energy released. In order to be able to establish a magnitude-frequency relationship for hazard events, it is generally necessary to collect historical data (e.g. from seismograph, meteo-stations, stream gauges, historical archives, remote sensing, field investigations etc.) and carry out statistical analysis (e.g. using extreme event analysis such as Gumbel analysis). The frequency of hazard events is often indicated with the term return period, which is the statistically derived average time period between two events of the same magnitude. The annual probability is the inverse of the return period, and indicates the chance that a hazard event with a certain magnitude may occur within one year. The collection of historical information on past events will be discussed in section 2.2, and the statistical analysis of rainfall return periods in section 2.3.
- How severe? Hazard intensity. The intensity of a hazard refers to the spatially varying effects. For example earthquake magnitude refers to the energy released by the ruptured fault (e.g. measured on the Richter scale) whereas the intensity refers to the amount of ground shaking which varies with the distance to the epicenter (e.g. measured on Modified Mercalli scale). The magnitude of floods may be measured as the discharge in the main channel at the outlet of a watershed before leaving the mountainous area, whereas the intensity may be measured as the water height or velocity which is spatially distributed, and depends on the local terrain. Therefore hazard intensities should be analysed spatially. This can only be done if the available data is good enough, for example if the topographical data is detailed enough to model the variation in water depth over an area. If the intensity cannot be modelled it will also be more difficult to quantify the expected losses, as we do not know how much buildings or other objects would be damaged.
- How much area? Hazard footprints. The areas that may be affected by hazards differ in size, from square meters to many square kilometres, depending on the hazard type and magnitude of the hazard. The area that is likely to be affected by a hazard event during a single event is called a hazard footprint. For instance the area that might be inundated during a flood event that happens once every 100 years, or the area that is covered by a landslide. In the hazard and risk assessment it is important to be able to model these hazard footprints, and characterize them with the expected intensity, in order to be able to estimate the expected losses.
- How long does it last? Duration. The time that a hazard event may last may also vary, from seconds (e.g. earthquake) to years (e.g. pollution). The length of exposure to the hazard and the type and severity of the hazard will determine to a great deal the degree of damage caused by the hazard. For instance, the time that agricultural areas or buildings are exposed to flooding is very important, as longer time periods of flood will cause more damage to them. In this handbook we therefore make a differentiation between the alluvial flooding as occurs in Belize (which affects large areas for time periods up to days) and flash floods as they happen in many of the Caribbean island, with floods that occur rapidly in the order of minutes.
- How long before do we know? Warning time. Hazardous events may occur instantaneously, without any clear measurable signs or they might develop over a period of time, ranging from seconds to days. The longer the time it takes to develop, the more possibilities there are to forecast (general indication) and predict (precise indication) the hazard location and severity and to develop an early warning system. For instance, it tropical storms develop over a period of days, and their paths can be forecasted within a certain range of uncertainty. However, prediction the rainfall amount and the related flooding or landslides is much more complicated due to the highly variable nature of precipitation with exposure and altitude on Caribbean islands, in relation to small variations in the path of tropical storms. More information on Early Warning is given in chapter 9, and in use case 5.1.
Table 3 gives a summary of the hazard characteristics of the hydro-meteorological hazards that are part of the Charim project.
Table 3: Hazard characteristics of alluvial flooding, flash flooding and landslides in the Caribbean target countries.
|
|
Belize |
Windward Islands |
||
|---|---|---|---|---|
|
What? |
Coastal flooding |
Alluvial flooding |
Flash flooding |
Landslides |
|
Where? |
Along the coast, extending a considerable distance inland. |
Along rivers and low lying areas covering large part of the country |
River valleys all around the islands. |
Sloping areas, coastal cliffs, road cuts, valleys. |
|
How often? |
. |
|
Linked to high rainfall events and tropical storms. Large events roughly every 25 year, smaller events every few years. |
Linked to high rainfall events and tropical storms. Large events roughly every 25 year, smaller events every few years. |
|
How severe? |
|
|
Water heights may not be extremely high but velocities can be important, also tree trunks may be devastating. |
Major rainfall events may cause over 1000 landslides in one island |
|
How much area? |
|
|
During one extreme rainfall event more than 50% of all valleys may experience flash floods. |
Major event may cover more than 100 hectares of land, disrupting roads. |
|
How long lasting? |
|
|
Flash floods happen rapidly in the order of minutes, but they may be coming in different waves, and may also be linked to debris flows. |
Landslides are single events which become overgrown within a year or two, unless new rainfall events occur (e.g. after Thomas in St Lucia, Dec 2013 event) |
|
How long before? |
|
|
Flood Early Warning is possible with automatic rain gauges & flow sensors (see example from Grenada) |
Only general warning can be given, no prediction possible, due to large variation of rainfall. |
Characteristics of flood hazard analysis
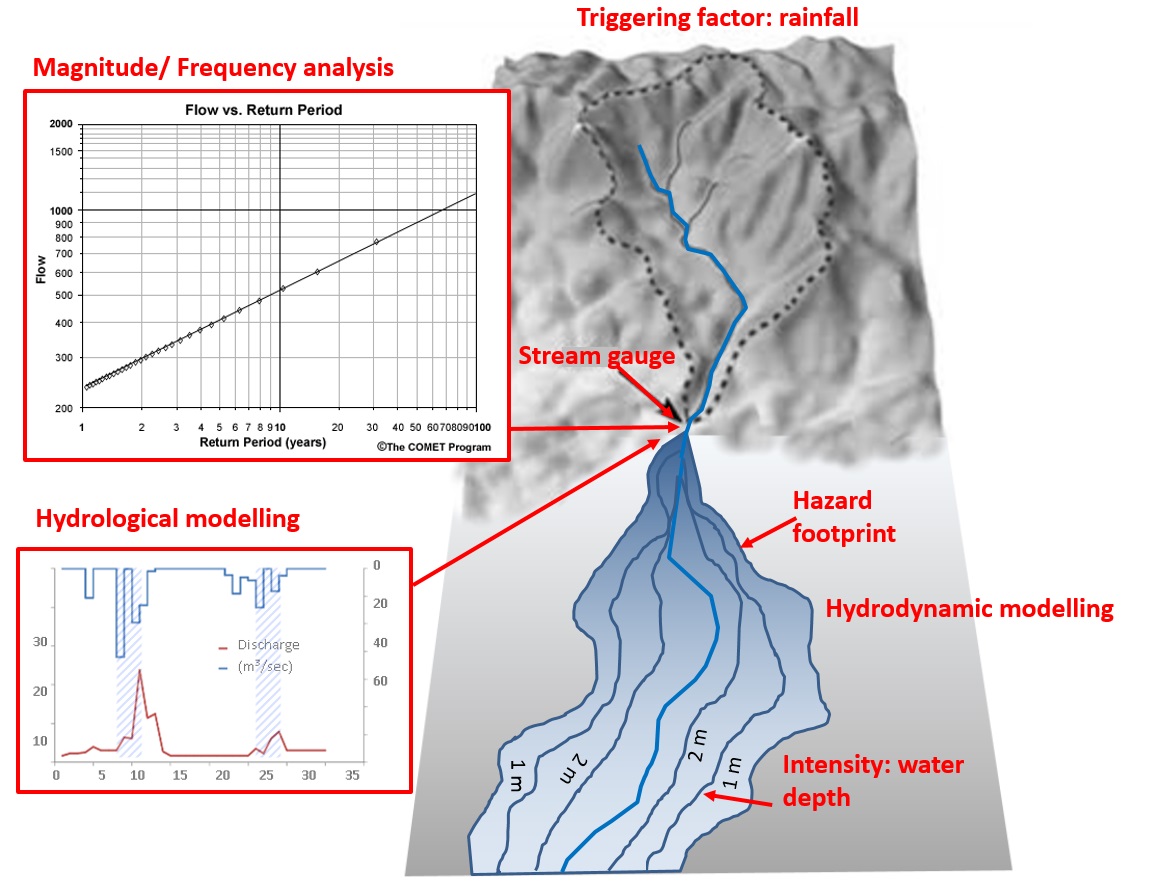
Figure 1 gives a schematic overview of the various components involved in flood hazard assessment. The analysis is subdivided into the following main components:
- Rainfall magnitude - frequency analysis to determine specific rainfall scenarios with a certain return period. Depending on the available types of rainfall data, this could be done with intensity-duration data or using daily rainfall data. For most of the Caribbean islands there are only daily records available.
- Hydrological modeling. The rainfall scenarios are used in hydrological modeling to derive flood discharge scenarios for the different return periods. The modeling requires Digital Topographic Data of medium to high quality, soil maps with related hydrological parameters (infiltration, saturated conductivity) and land use (with Manning's coefficients). If there are also stream flow data for some events, these are required to validate the modeling results. During a tropical storm, the soils on the slopes quickly saturate and literally overflow, or the rainfall intensity can be so high that the infiltration capacity of the soil is not sufficient. Hence severe overland flow and erosion may take place, leading to flooding along the river channels. The water level can rise from 0.5m to more than 4 m at given locations, within 2 hours’ time (sometimes much less) from the start of the rainfall. Since many valleys are inhabited, especially near the coastline, these flash floods can cause great damage and casualties. The shape and condition of the river channel has a large influence of the flood behavior: small and narrow channels quickly overflow, or channels that have a decreased size because of sediment may overflow much more quickly.
- Hydro-dynamic modeling. Based on the modeled flood discharge for specific scenarios, the spreading of the flood water is modeled and intensity maps of waterdepth and/or flow velocity are calculated. Detailed Digital Elevation Models are essential to represent small changes in elevation required for the flood inundation modeling. Also detailed profile information of the flood channel is needed, and cross sections of bridges and other obstructions.
Figure 1: Schematic representation of flood modeling. See text for explanation.
The resulting maps are flood intensity maps for different return periods, which form the input for flood risk assessment. If the topographic data is not sufficiently detailed, or when there is no cross section data available, the flood inundation maps will not be accurate enough. In that case it will be better to only represent flooding as flood extend maps, without the depth or velocity information. When the DEM is too coarse or too general, water depth information is not accurate enough to make a hazard classification combining depth and extent. For example when the map is produced on a scale of 1:50,000 based on GIS raster data layers used in the flood model with a gridcell resolution of 20x20m. This effectively means that the map can only be used as an indication of where flood may occur, and be used to check which settlements and areas are exposed to floods. Flooding circumstances can be aggravated by man-made decisions or behavior such as:
- channels that are blocked by debris (e.g. at bridge locations) and are not regularly cleaned;
- channels that are diverted to circumvent habitation, leading to unnatural bends and flow paths that cannot handle extreme discharges;
- culverts and bridges at road crossings may be under-dimensioned, leading to backflow and rising water levels;
- Individuals extend their property into the river channel flood plain, thus narrowing the potential flow path.
Characteristics of landslide hazard assessment
Figure 2 gives a schematic representation of a landslide hazard assessment procedure. the analysis is subdivided into the following components:
Landslide Inventory mapping. It is very important to collect landslide information, in order to know which location have been affected by what type of landslides, and how frequent landslide happen in a certain area. In the case that many landslides are triggered by the same triggering event (like an extreme rainfall or earthquake) it is important to map the landslides soon after this event, and generate a so-called event-based landslide inventory.
- Rainfall frequency analysis. The dates of the triggering events are important, because the rainfall data can be used in a magnitude-frequency analysis to estimate the return period of the rainfall causing the landslides. this can be done with daily rainfall, but ideally should be done using intensity-duration- frequency (IDF) curves. However, these require long term continuous rainfall records, which are often not available for the Caribbean islands. Individual landslide events can also be used in combination with rainfall data to establish rainfall thresholds: minimum rainfall amounts required to trigger landslides in an area. These can be useful for Early Warning Systems.
- Landslide initiation modeling. The most important component is to model the locations where landslides are likely to occur. this can be done using different types of models. In direct mapping experts map the susceptibility zones based on their experience and knowledge of the terrain. Indirect expert-based assessment use a series of factor maps that are weighted by experts to derive a susceptibility map, with zones that have a different likelihood that landslides may occur. If enough historical landslide information is available it is also possible to use bivariate or multivariate statistical analysis. When geotechnical information is available also physically-based modeling approaches can be used to model the slope stability using limit-equilibrium models, that can also take into account the effects of groundwater, earthquake acceleration, vegetation and landslide mitigation structures.
- Landslide runout modeling. Based on the results of the landslide initiation modeling potential sites may be identified that can be the source zones for landslides that will move downslope. The modeling of this extent, and sometimes also the velocity, and impact pressure of mass movements is called runout modeling. this can be done for individual sources, where many parameters are needed related to volume of materials, rheological characteristics and entrainment , to regional empirical approaches, using models that are based on an angle-of-reach approach.
- Hazard assessment. The hazard assessment combines the above components. For the susceptibility zones identified in the landslide initiation modeling, the density of landslides that are triggered by a given event with a certain return period are analyzed. When this is done for a number of events, it is possible to make a relation ship between the expected landslide density (or spatial probability) and frequency. If physically-based models are used, the failure probability can be calculated for different return periods, and if physically-based runout modeling is also applied, it is also possible to generate landslide intensity maps (e.g. depth or impact pressure) for different return periods.
Whether it is possible to calculate landslide hazard (how frequent and how much) , or only landslide susceptibility (where relatively higher) depends on the availability of geotechnical, topographical data, and landslide data.
Figure 2: Schematic representation of landslide hazard modeling. See text for explanation.
