

Keywords: Flood hazard, risk analysis, loss estimation
| Before you start: | Use case Location: | Uses GIS data: | Authors: |
|---|---|---|---|
|
You will need an appreciation of what flood hazard information is and how it is generated. Please see 8.6 national flood hazard methodology for more information. Some basic GIS spatial analysis skills will be useful if you wish to follow the analysis method for yourself or apply it to your own data. |
The Use Case location is at the Belize national scale. Note, the analysis applies equally at smaller scales (e.g. District) and for other areas, provided the data at that level of detail is available to carry out the analysis. |
Yes, indicative flood hazard layers for Belize, road vector layers and population density raster data, see table in Data Requirements section below. All are projected in WGS84, UTM Zone 16N. |
Mark Trigg, Mark Brussel |
Introduction:
At a national level, a government must make many decisions that require a balanced understanding of multiple issues, and therefore needing specific and reliable information on those issues. One issue which is integral to many planning decisions is that of flood risk. For example, a government may need to know what part of the population is exposed to potential flood hazard and where that risk is most serious. Having this data can guide investments in disaster preparedness, in terms of shelter location and their capacity, as well as evacuation plans and event response procedures. Infrastructure at risk of flooding can also be identified, and the evaluation of potential losses that may occur can help in decision making, in terms of protecting valuable and strategic assets, or upgrading structures. Indeed, “the value of vulnerability assessment and reduction” is recognized as one of the guiding principles of the National Hazard Mitigation Policy of Belize.
Even in areas where good flood hazard information does not exist in a formal sense, it is likely that responsible government personnel will use experiential and historical knowledge to guide their plans to some extent. However, this knowledge is often lost when the experienced person retires, therefore affecting future planning decisions such as failing to include all potential hazards. It is also difficult to integrate this informal knowledge into an increasingly data-rich world, making flood risk analysis difficult, and potentially inconsistent.
Many governments now use national flood hazard information which has been formally defined for different return periods (probability of occurrence), sometimes simplified into low, medium, and high hazard categories (see definitions in the Methodology Book, for instance, sections 3 flood hazard assessment and section 5 Risk Assessment. Traditionally, this information is provided in map form, but it is at its most useful in digital GIS format. A computerized digital format allows cross-analysis of the flood hazard information against many other digital datasets that are now available. This analysis can be carried out rapidly and more accurately, and is consistent and repeatable.
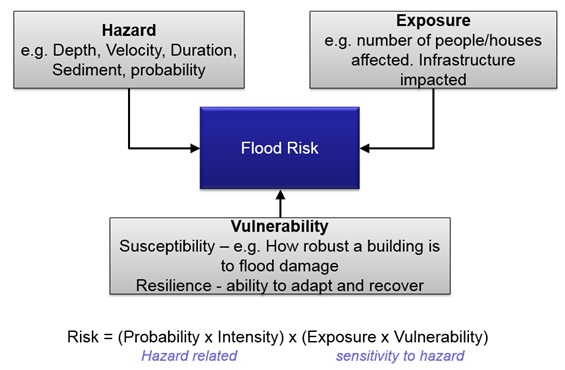
Below is a schematic which illustrates the definition of flood risk (see section 5.1 of the methodology book for more detail). This Use Case focuses on using the flood hazard information defined in Use Case 8.6 national flood hazard method to identify exposure at a national scale. The vulnerability element is not explicitly included in the analysis due to a lack of data, although it is discussed so that appropriate data can be collected for future work.
While this Use Case focuses on providing a pre-disaster assessment of flood risk, it should be noted that these methods are similar to and closely tied to post-disaster assessments. In Belize, these assessments are coordinated by the National Emergency Management Organization (NEMO) and are called Damage Assessment and Needs Analysis (DANA) reports. Many government agencies contribute to these reports providing valuable analysis of losses arising from a natural disaster. An example can be found on the Belize NEMO website.
The main difference of a pre-disaster assessment from a post-disaster one is that ituses predicted hazard outputs from modeling exercises, while the latter uses information from an actual event, collected in the field by survey teams or by satellite/airplane.
Objectives:
The overall objective of this Use Case is to demonstrate, using two example analysis categories, how to carry out a flood risk analysis at a national scale by using QGIS Geoprocessing tools and InaSAFE, a plugin for damage assessment that is also available in QGIS . This use case uses national indicative flood hazard maps and national level data to identify what and who may be at risk during floods, i.e. exposure. Population and roads are used as example categories in this Use Case analysis, but the method can be applied to other categories as well. The exposure information is then analyzed with InaSAFE to demonstrate how this can provide further value in a planning context. Finally, it outlines how further analysis of the vulnerability of the flood exposure can be used to provide an estimate of the actual losses that might occur.
Flowchart:

Figure 1. Flow chart for damage analysis
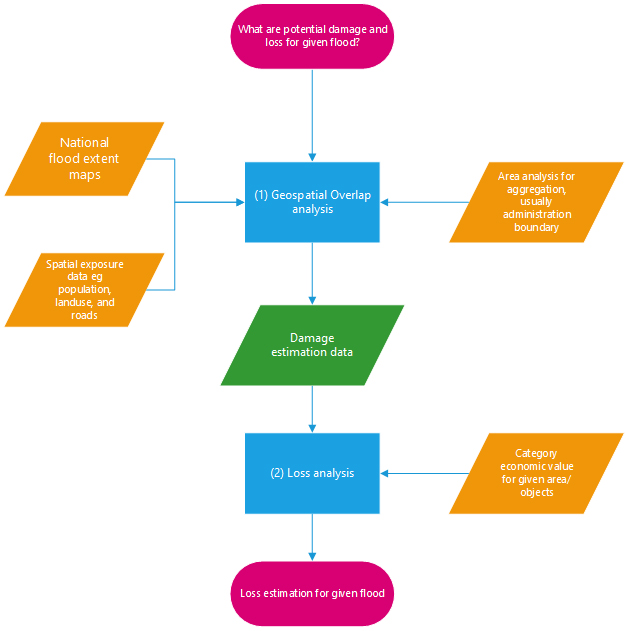
Figure 2. Flowchart for damage and loss analysis
Problem definition and specifications:
A national government (we use Belize as an example for this Use Case) wishes to identify what or who may be at risk for a given flood hazard. This can be further quantified in terms of losses that may arise if such an event occurs. The resulting information needs to be as accurate and spatially detailed as possible in order to make informed decisions at a national level.
For this particular Use Case, we assume that the government wants to know where the largest population at risk of floods is located in the country, and what length of roads in the country may be affected by floods under the 1-in-100 year return period hazard (1% probability).
Data requirements:
This Use Case requires the national indicative flood hazard extent data for the return period (probability) of interest in raster or vector form. For only exposure estimates, flood extent is sufficient, but for vulnerability assessment, some measure of flood magnitude (i.e. depth or velocity as a measure of intensity) is required.
Spatially detailed category information is required to estimate the category exposure to flood. This needs to be sufficiently detailed such that when compared to the flood location, it is accurate enough to place the category correctly inside or outside the flood extent. It is possible to disaggregate coarse data to a finer scale using assumptions of how that category is distributed (as is the case for the population data we use here)however, the results will have limited accuracy.
If available, vulnerability information for the category of interest can also be used to assess the full flood risk for the category. However, this level of data is rarely available and even if general information is available, it may not be locally relevant if for example, construction methods are different.
For the population example below, we will use population density data from the High Resolution Settlement Layer (HRSL) by Facebook (https://data.humdata.org/). This data is created based on publicly available census data and high-resolution (0.5 m) satellite imagery from DigitalGlobe. Moreover, the High Resolution Settlement Layer data were developed by the Connectivity Lab at Facebook using computer vision techniques to classify blocks of optical satellite data as settled (containing buildings) or not. For damage analysis in this use case, we will use the High-Resolution Settlement Layer (HRSL) population data and OpenStreetMap road data. Both population and road data are freely available in the Humanitarian Data Exchange (HDX) platform. Please download the data first before you move to the next section, by using the following link:
For loss analysis in this use case, we use national road data layer with details of road type and unit replacement cost per mile.
Table 1. List showing the descriptions of GIS data used
|
|
Layer name |
Type |
Description |
|---|---|---|---|
|
1 |
enumeration areas.shp |
Vector shapefile |
Enumeration areas of Belize |
|
2 |
population_blz_2018-10-01 |
Geotiff raster |
2018 population density raster (30 m) from High Resolution Settlement Layer (http://data.humdata.org/) |
|
3 |
hotosm_blz_roads_lines_shp.zip |
Vector shapefile |
Road line vectors data from OpenStreetMap highway data |
|
4 |
Belize_Survey_Road_Nov15_V4.0.shp |
Vector shapefile |
Road vectors surveyed as part of the BCRIP project |
|
5 |
FP_flood_1in100_GtZ.tif |
Geotiff raster |
Fluvial and pluvial flood hazard (no coastal) for 1 in 100 year return period (water depth). National Flood Hazard Map (NFHM) output |
|
6 |
FP_flood_1in100_GtZ.tif |
Geotiff raster |
Fluvial and pluvial flood hazard > 0 depth for 1 in 100 year return period. Binary food = 1, dry = 0. Derived from (4) |
|
7 |
FP_flood_1in100_GtZ_Poly.shp |
Vector shapefile |
Fluvial and pluvial flood hazard > 0 depth for 1 in 100 year return period. Only flood polygons. Derived from (5) |
|
8 |
population_exposed_100y.tif |
Geotiff raster |
OUTPUT: Example result of population exposed from analysis |
|
9 |
roads_100y_clip.shp |
Vector shapefile |
OUTPUT: Example result of population exposed from analysis |
|
10 |
EnumArea_100y_flood_pop.shp |
Vector shapefile |
OUTPUT: Example result of population exposed aggregate by enumeration area |
Analysis:
The analysis can be divided into two primary analysis, damage analysis for population and road in Belize, and loss analysis for the roads of Belize. The analysis will use 1-in-100 year fluvial and pluvial hazard data (but not coastal storm surge). Furthermore, two geoprocessing analysis will be covered in this use case: geoprocessing analysis using QGIS and using the InaSAFE plugin. The process of both analysis are provided for you to understand the difference between the tools covered in this use case.
General analysis applicable to all categories
1. Damage analysis of flood extent against a category of interest.
An analysis category can be any subject of interest for which flood risk is important, e.g.,population, roads, or agricultural farm land. In order to identify what in the analysis category is exposed to the flood extent, the national flood hazard map for a given return period has to be spatially intersected with the spatial data for the analysis category. The analysis needs to be restricted to a given area of interest to be meaningful (e.g. national area), and the two datasets in the analysis need to be complete for this to be accurate. You may want to subdivide this analysis by sub areas, e.g. districts or elevation categories, to understand the spatial distribution better, or provide the output in a particular context for the user. The more spatially detailed the data of the category is to be analyzed, generally, the better the analysis will be. However, there will always be a limit to the quality and level of detail possible in the analysis, constrained by limitations in data and methodology. This step of analysis will yield details of what in the category is at risk, and where it overlaps with the defined hazard area.
2. Loss analysis
If you have further information on a category, such as the economic value of a particular land use, you can continue the analysis and calculate the potential loss, if that actual location was subject to flood losses. This can be as simple as multiplying the area flooded for a given category in step (1) with the value per area of that category.
Obviously, the reality of flood damage to a particular piece of infrastructure or property is not as simple as the complete loss or damage of the object, rather, it actually involves increasing loss based on how severe the flood is at that location, and how vulnerable that object is to the flood. Therefore, the ultimate goal of this analysis is to identify possible losses for a given flood intensity (e.g. flood depth or velocity). This requires high quality information on the flood intensity and also, locally valid vulnerability information related to that intensity (commonly known as vulnerability curves). See definitions in chapters 3.1 Flood Hazards and 5.3 Risk Assessment of the Methodology Book, for instance. This level of analysis requires accurate and detailed information to be valid, hence it was not undertaken in this Use Case. However, as the information collated by a government on actual flood losses and flood hazard data improves, this type of analysis will become more possible in the future.
Geoprocessing Analysis using InaSAFE
InaSAFE is free and open-source software (FOSS) that produces realistic natural hazard impact scenarios to support planning, preparedness, and response activities. InaSAFE was developed jointly by the Indonesia National Disaster Management Agency (BNPB), the Australian Government, and the World Bank (GFDRR). InaSAFE is a QGIS plugin, meaning if you want to use InaSAFE, you need to install QGIS first and search the keyword InaSAFE in QGIS plugin managers.
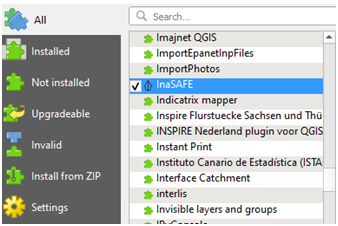
Figure 3. InaSAFE as part of QGIS plugin
InaSAFE combines one exposure data layer (e.g. location of buildings) with one hazard scenario (e.g. the footprint of a flood) and returns a spatial impact layer along with a statistical summary and action questions. InaSAFE can also divide the impact results by administrative boundary, and provide a breakdown of information about the gender and age of affected people.
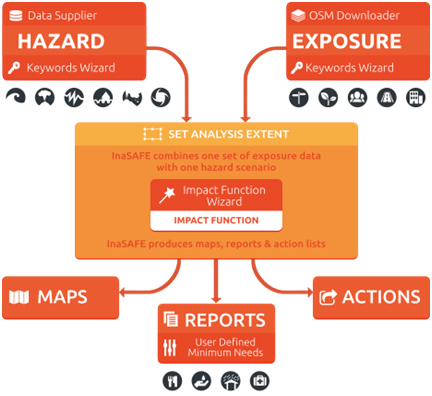
Figure 4. The concept of InaSAFE (source: InaSAFE.org)
Based on Figure 4, we know that InaSAFE requires two main types of data, namely hazard data (for example, floods, earthquakes, or tsunami) and exposure data (population, roads, or buildings). InaSAFE will process both data through a function called impact function. An Impact Function is a software code in InaSAFE that implements a particular algorithm to determine the impact of a hazard on the selected exposure. The impact function will model the effect of a disaster on the user's exposure layer.
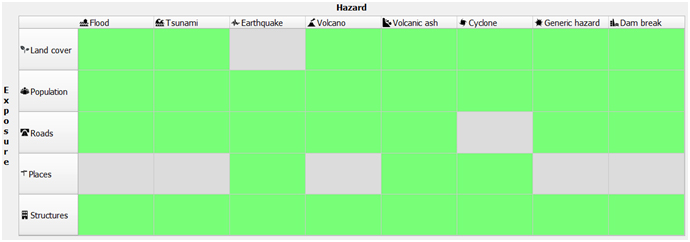
Figure 5. Current supported type of hazard and exposure in InaSAFE (Source: InaSAFE Function Centric Wizard)
Currently, InaSAFE supports impact functions for several hazards such as floods, tsunami, earthquakes, volcano, volcanic ash, cyclones, dam breaks, and generic hazard data. Generic impact functions are useful when your data does not conform to the a priori expectations of InaSAFE. An example is if you wish to produce a report on buildings affected by a landslide, drought, smoke haze, or any other hazard that does not have an explicit Impact Function in InaSAFE, then the generic impact functions will be of better use
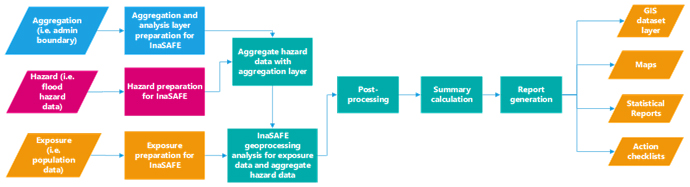
Figure 6. Simplified overview of the InaSAFE analysis workflow (Source: InaSAFE.org)
Be it a hazard, exposure, or aggregation data, InaSAFE will not automatically recognize each data. You need to run data preparation in InaSAFE so that InaSAFE can find out whether the data you entered is exposure, hazard, or aggregation data. The process of identifying data for InaSAFE is done using the Keyword Creation Wizard feature in InaSAFE. This function helps InaSAFE to know what impact function to run later.
Each impact function produces outputs that include ready-to-use maps, reports, and action checklists. Aside from that three outputs, the user can also get a new GIS dataset produced from running an impact function analysis. The GIS dataset layer already has symbology from the InaSAFE itself to clarify the location affected and not affected by the hazard layer. The GIS dataset layer is categorized as a temporary layer, meaning the data are not saved by default, and you still need to save the dataset by yourself if you want to use it for other purposes. The reports summarize all the analysis results in the form of tabular and textual data. The action checklists generated are also the list of questions disaster managers should consider when implementing their disaster management plan.

Figure 7. From left to right - map, statistical reportm and action checklist - the different types of outputs generated from InaSAFE analysis.
The limitation of InaSAFE is you can only analyze one hazard for each run. Meaning if you have multi-hazard data, you cannot run various hazards simultaneously in InaSAFE. InaSAFE is also not a GIS modeling tool, meaning if you have a specific analysis that requires a particular scenario (for example a landslide that will occur if the rain intensity above 70%), you might need to explore other tools that have the capability to solve the problem.
Example Application for Geoprocessing Analysis with InaSAFE
Now you have understood what InaSAFE is and how InaSAFE works, now we will try to run a geoprocessing analysis using InaSAFE for several scenarios.
1. Application to population exposure to flood hazard in Belize
In the first scenario, you will run a geoprocessing analysis using population and flood data in Belize. This illustrates an analysis based on raster data.
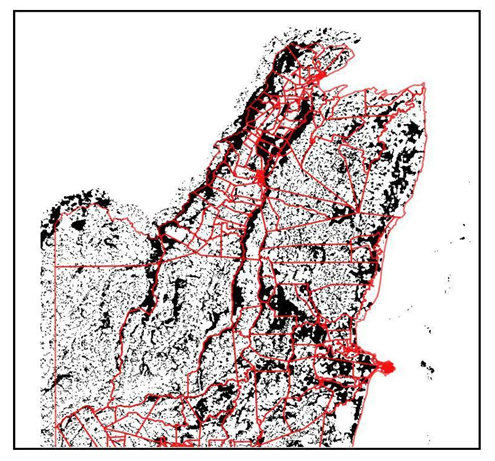
(i) Start with 1-in-100 year flood raster (90 m), with flooded areas shown in black. Enumeration area polygons are shown with red edges. Only the northern part of Belize is shown and only fluvial and pluvial hazards are shown (ignoring storm surge on the coast).
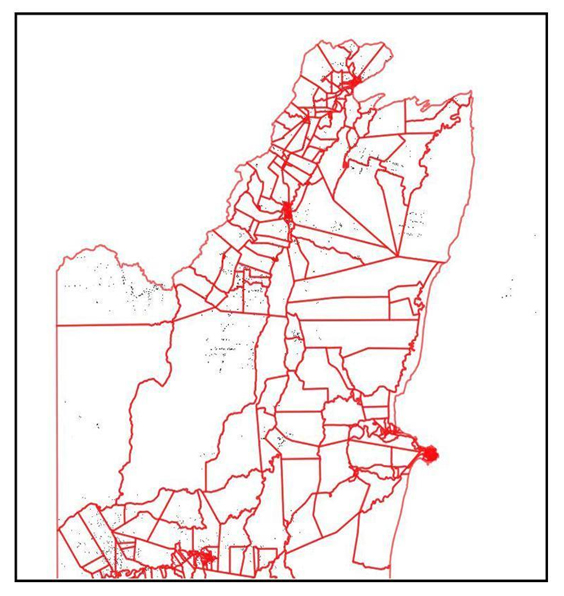
(ii) Use a spatially discrete raster of population data such as the 2018 population density raster (30 m) from the High-Resolution Settlement Layer (HRSL) data set. Red edges are enumeration areas and black areas show the population density.
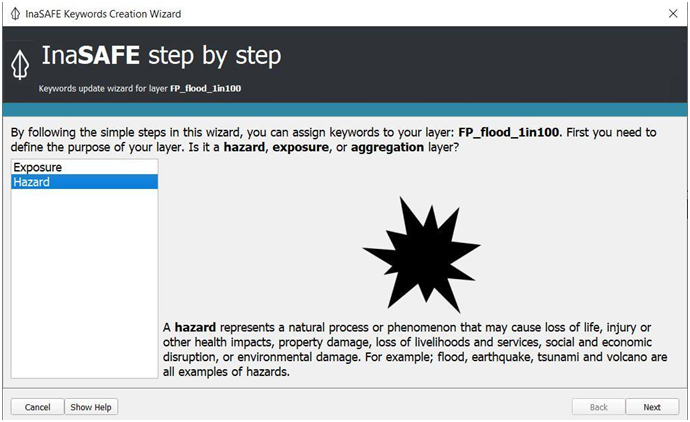
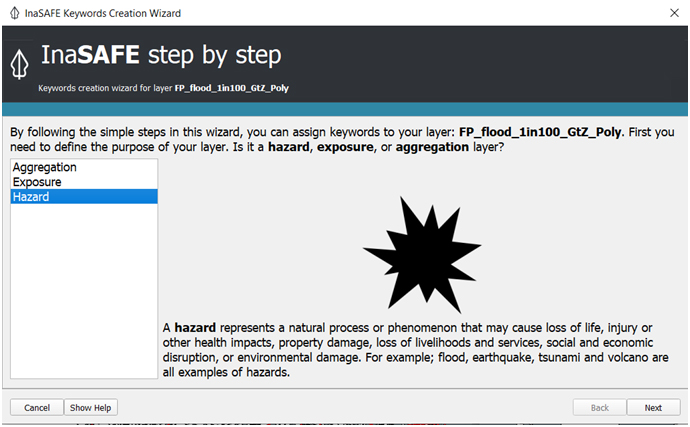
(iii) Now we are going to use InaSAFE to run an impact scenario on flood for population density. As mentioned in the section before, InaSAFE cannot recognize the dataset that you load for the first time. You need to run Keyword Creation Wizard for every layer that you are going to analyze. First, select the FP_flood_1in100 layer and click on Plugin 🡪 InaSAFE 🡪 Keyword Creation Wizard to identify the hazard layer as a flood layer in InaSAFE.
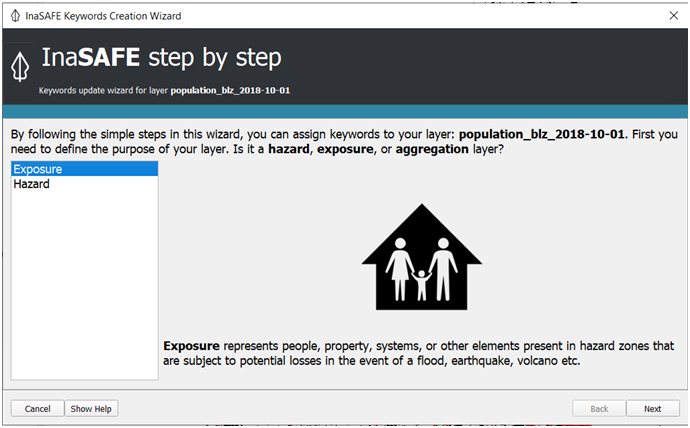
(iv) Similar to the hazard layer, we need to use Keyword Creation Wizard to help InaSAFE recognize the dataset as an exposure layer. Click on population_blz_2018-10-1 first then select Plugin🡪 InaSAFE 🡪 Keyword Creation Wizard.

(v) If you see a warning message from InaSAFE that says “The requested is not overlapping your layer”, that is because you haven’t set the analysis extent for InaSAFE. To do this, go to Plugin 🡪 InaSAFE 🡪 Set analysis area. If you want to set your custom extent for InaSAFE, you can select “Use intersection of hazard, exposure, and bounding box” and click on the Drag on Map button. Otherwise, you can just select “Use intersection of hazard and exposure layer”
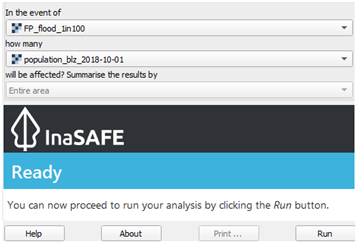
(vi) Now, you already defined FP_flood_1in100 as hazard layer, and population_blz_2018-10-01 as exposure layer. You are now ready to run the analysis with InaSAFE. On the InaSAFE panel in QGIS, click the Run button to run the geoprocessing analysis with InaSAFE.
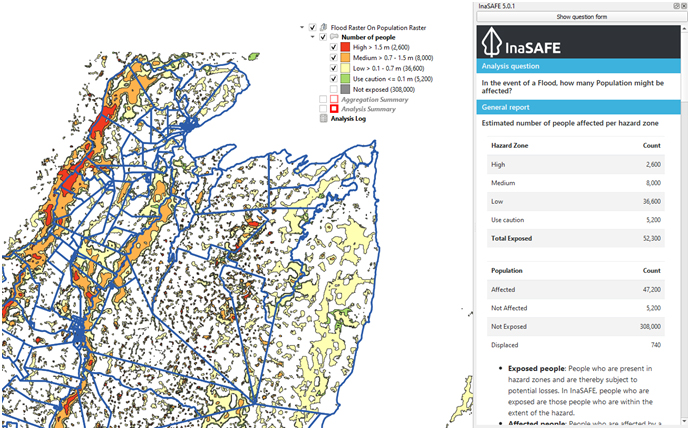
(vii) This shows the result of the flood impact analysis with InaSAFE for population and flood hazard data. Red area shows the highest number of people affected by floods.

(viii) As mentioned in the section before, InaSAFE provides pre-configured maps, statistics report, and infographics to help disaster risk managers figure out the next action for hazard impact analysis. If you look at the infographic resulting from the InaSAFE analysis, you might notice two terms used in the InaSAFE, affected and displaced. Affected shows the predicted number of people who might get affected by the hazard (i.e., flood) for each category (i.e., low, medium, high). Displaced, on the other hand, refers to the predicted number of people who must leave/evacuate their residence for various reasons. InaSAFE has different displacement rates for each hazard impact function. In this flood impact function, InaSAFE has a default number of people displaced for each hazard class category, i.e. 5% for high, 3% for medium, and 1% for low. You can change the displacement rate for each hazard impact function by clicking on the InaSAFE Option 🡪 Population parameters.
InaSAFE also provides demographic scenarios to exhibit people potentially displaced by the impact of the disaster. These demographic scenarios are useful to inform the disaster risk managers how many people who belong to vulnerable groups are displaced by the impact of disaster. InaSAFE breaks down these vulnerable groups into several categories such as gender, age, and disability vulnerability. If you want to create a better demographic scenario, you need to have an access to the national demographic ratio for each population group. You can change the ratio by clicking on the InaSAFE Option 🡪 Demographic Defaults.
In InaSAFE, the total number of minimum needs is also generated based on the number of displaced/evacuated people. The items provided in the minimum needs are based on Sphere Standards with a modification that suits Indonesia's context. If you have access to the list of minimum needs that need to be prepared for displaced people based on your country specifications, you can create your minimum needs profile by accessing the InaSAFE Minimum Needs Manager.
Lastly, all the results generated by the InaSAFE plugin can assist disaster risk managers in considering every action needed to be prepared in case of the flood with return period of 100 years occur in the future, especially in consideration of how many people might get affected and displaced by the flood, and how much minimum needs must be prepared for the displaced people.
2. Application to road length exposed to flood hazard in Belize
This illustrates an analysis based on vector data.
(i) This analysis uses 1 in 100 years flood raster data.
(ii) We use highway data from OpenStreetMap. We get road vectors as part of the OpenStreetMap highway data. It is downloaded from Humanitarian Data Exchange (HDX) platform for free with the attribute highway classification.
(iii) Before we run the analysis using InaSAFE, we need to make sure that all the dataset are already recognized by InaSAFE. Use the InaSAFE Keyword Creation Wizard to define a flood impact scenario disaster.
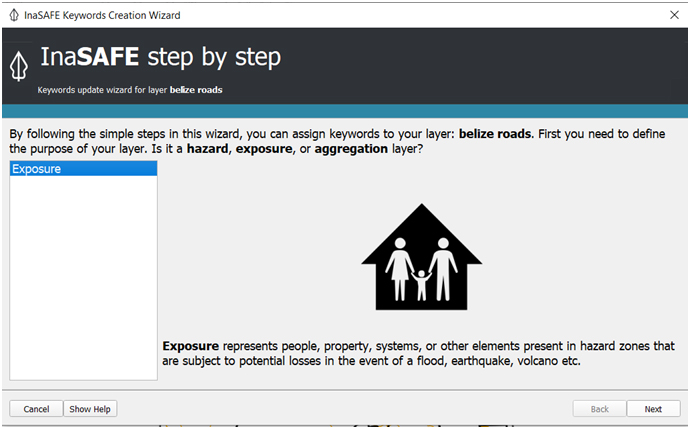
(iv) After we set the hazard layer, we need to define the road data from OSM as exposure layer in the InaSAFE analysis. Use InaSAFE Keyword Creation Wizard for the road data.
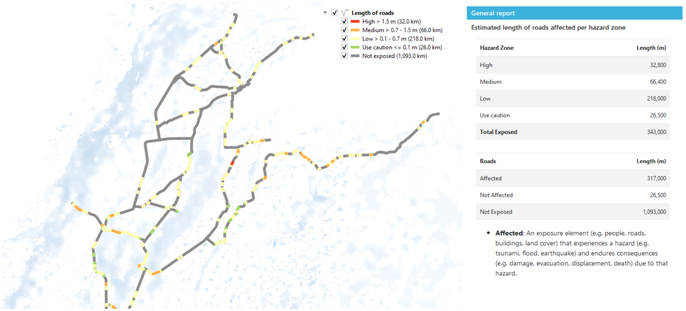
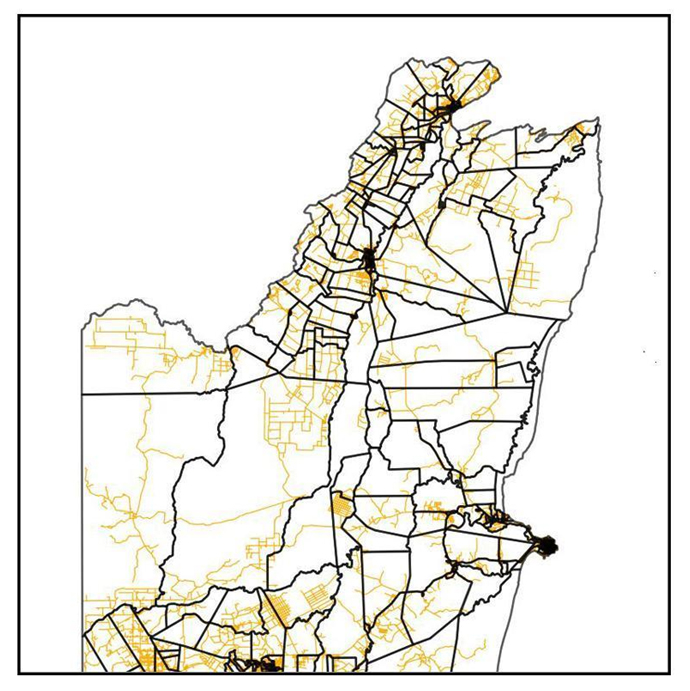
(v) This is the result from the InaSAFE analysis showing the roads affected by the impact of flood with 100 years return period. Lines with colors show the roads that will be affected by the flood, and the gray lines show dry roads that are not affected by the flood with 100 years of return period.
Example of geoprocessing application using QGIS
1. Application to population exposure to flood hazard in Belize
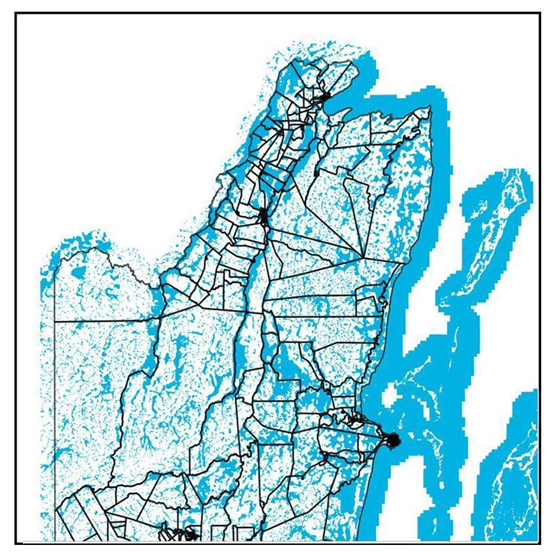
(i) Load 1-in-100 year flood raster data to QGIS. Flooded areas are shown in blue. Enumeration area polygons are also shown with black outline. Only the northern part of Belize, along with only the fluvial and pluvial hazards are shown (ignoring storm surge on the coast).

(ii) Load High-Resolution Settlement Layer data to QGIS. Darker areas show higher number of people.
(iii) First, we are going to reclassify the flood hazard layer into four classes: very low, low, medium, and high. The minimum and maximum value are depending on your need, in the example, we set very low for flood depth between 0-0.1 meters, and we reclassify those value as 1.
(iv) Second, convert the newly reclassified hazard layer into a vector layer
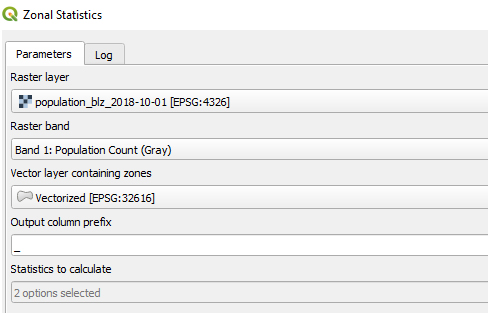
(v) Use zonal statistics in QGIS to calculate the number of populations affected in each hazard classes.
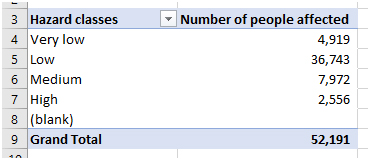
(v) Now, it is possible to use a spreadsheet to know how many people are affected for each hazard class.
The use of High-Resolution Settlement Layer data is important as we need to understand how flood with 100 years return period will affect the population, andhow many people might get affected from the flood with 100 years return period. This analysis can help prepare better contingency plans to save more lives.
2. Application to road length exposed to flood hazard in Belize
After you learn how to run geoprocessing analysis between raster flood hazard data and raster population data, now we are going to run analysis between raster flood hazard data with vector road data from Belize which already have information about replacement cost per mile.

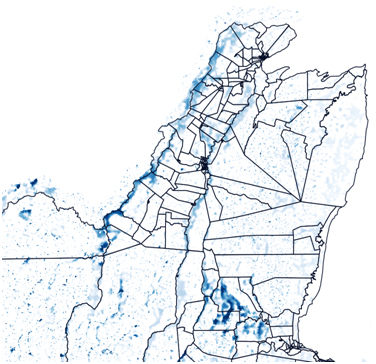
(i) Load 1-in-100 year flood raster data to QGIS. Flooded areas are shown in blue. Enumeration area polygons are also shown with black outline. Only the northern part of Belize, along with only the fluvial and pluvial hazards are shown (ignoring storm surge on the coast).

(ii) We will use national road data shown as double lines.

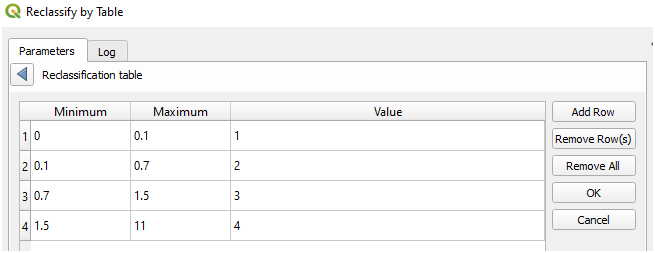
(iii) First, we are going to reclassify the flood hazard layer into four classes: very low, low, medium, and high. The minimum and maximum value are depending on your need, in this example, we set very low for flood depth between 0-0.1 meters and we reclassify those value as 1.

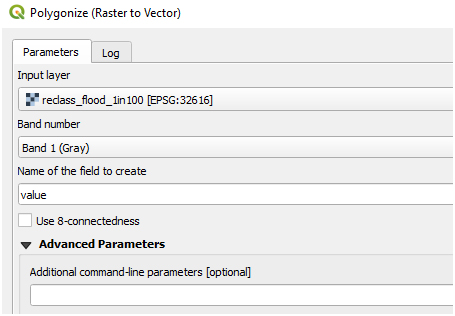
(iv) Second, convert the newly reclassified hazard layer into a vector layer

(v) Intersect road data with newly reclassified hazard vector data to create roads affected by the flood only

(vi) This result is the new vector layer which shows sections of roads that are affected by the flood

(vii) Now, it is possible to calculate the length of these sections of roads and add length field to the attributes
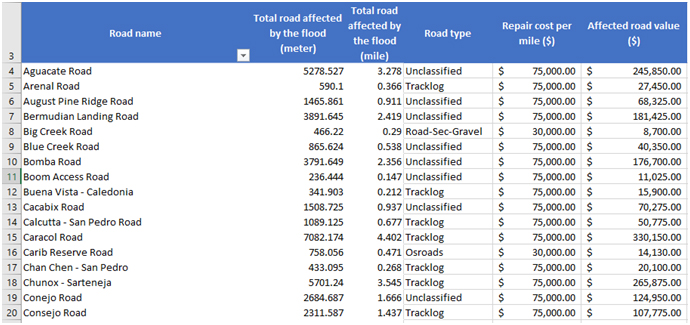
(viii) We can use a spreadsheet or GIS analysis to calculate each road value affected by flood with 100 years return period. With the unit cost for repair of the road, we can calculate the value of roads exposed to the hazard.
Results:
We now have an estimate of population and road exposure in Belize to the 1-in-100 year flood hazard by using InaSAFE and geoprocessing analysis in QGIS. This exposure assessment has value in terms of identifying which areas will be affected by the flood with 100 years return period. This analysis can be used to prepare contingency plans to reduce the impact of disaster if the flood with 100 years return period occurs in the future. However, it has not been possible to carry out the risk assessment examples to a full conclusion, as vulnerability data for Belize is not currently available.
For roads, for example, we know that the entire length of road affected by the flood hazard is unlikely to be destroyed completely, and that the damage will actually depend on depth and velocity of flooding as well as duration in some cases (for more details, see Use Case 3.3.4 Flood mitigation for roads). However, we cannot run complex scenarios with InaSAFE, even if we had locally relevant data on road vulnerability to different magnitudes (intensity) of flooding. The current limitation of InaSAFE is you can only analyze one hazard and one exposure for each run. Meaning, if you have multi-hazard data or have multi criteria exposure data, you cannot run data simultaneously with InaSAFE. InaSAFE is also not a GIS modeling tool, meaning if you have a specific analysis that requires a particular scenario (e.g., a road that will get affected if the rain intensity is above 70% and causes a flood with its velocity depending on terrain type), you might need to explore more in QGIS geoprocessing analysis or use another tool that is capable of solving the problem. The purpose of InaSAFE is to help disaster risk managers and practitioners who do not have extensive experience in GIS to run a quick, yet robust analysis to understand the impact of disaster.
Similarly, with more detailed population demographics, it would be possible to identify risks to population groups based on flood depth. For example, some groups such as the children and elderly would be more vulnerable to shallower flooding than healthy adults, and this could be considered in the risk analysis.
It is possible to undertake this form of analysis with any spatially distributed data, for example agricultural land use. Some data such as how crop types are affected by different flood depths, and at what point in the growing season a flood occurs, are important data that can be included in afull flood risk analysis for agriculture.
It should also be remembered that the indicative flood hazard map represents the same probability hazard in all locations, and will not occur all at the same time. However, this is important when comparing risk nationally, in a consistent manner.
Conclusions:
In making a disaster risk reduction plan, the government needs reliable and detailed data in order to make the appropriate decisions. Usually, the data used is in the form of tables and printed maps, but it would be preferable if digital data were also available, especially in GIS format. Detailed spatial data, both hazard data and exposure data, can help support decision making. For example, data related to the detailed distribution of the vulnerable age population at the scale of building footprint level will make it easier for the government to determine an evacuation plan. The more accurate and detailed a spatial data is, the easier it will be for disaster risk reduction managers to make risk reduction or contingency plans that are accurate and in accordance with existing conditions in the field. Geoprocessing analysis using good data will produce an accountable analysis and is used for the purposes of making disaster risk reduction plans. This means that investing at the national level in the production of accurate and detailed spatial data will help develop accurate and relevant disaster risk reduction plans.
InaSAFE is a free and open-source plugin available within QGIS. InaSAFE helps users who do not have extensive experience in the field of GIS to carry out fast and detailed analysis for planning needs. However, InaSAFE is not a modeling tool that can be used to analyze several disaster scenario events. The analysis carried out by InaSAFE can assist in the preparation of contingency planning documents and disaster risk assessments, provided that each analysis process carried out is only focused on one scenario in one analysis. Performing analysis using geoprocessing tools in QGIS can be used as an alternative if you want to run an analysis consisting of several related scenarios.
Last update:
26-01-2021