

This Use Case discusses the procedure that could be followed for the use of census data for the characterization of buildings and population. The use case is illustrated with an example from Grenada.
Keywords:
census data; population data; building footprint data; Grenada
| Before you start: | Use case Location: | Uses GIS data: | Authors: |
|---|---|---|---|
| Read Methodology book, section 5.2 on Assests, and Data Management Book, section 5.2 on buildings and 5.3 on population. This Use Case is also related to Use Case 7.1 on National vulnerability assessment | This use case is related to Grenada | Yes this use case uses GIS data , related to Enumeration Districts, and Building footprints. | Mujeeb Alam and Cees van Westen |
Introduction:
Census data are one of the main sources of information for generating elements-at-risk maps. This data has widely been used by experts in vulnerability assessment related to natural hazards (see chapter 5.3 of the methodology book). It is the main source of demographic and socio-economic data in most countries. However, the type, scope, and level of detail may vary from country to country. Census data is usually collected at the household level and due to its confidential nature, it is usually aggregated to a higher level (for instance census tracts, or enumeration districts) and census information is generally only shared at that aggregated level. In some of the countries (e.g. Dominica) census data is not shared at all, as the statistics office is not willing to share this sensitive data with other government organizations.
As it is very costly to make a national census, in most of the countries census data is collected every 5 or 10 years. This means that the information based on a census from many years ago might be outdated, especially when major events (such as the occurrence of a Hurricane have taken place). The last census in Grenada for instance was in 2011, which is still not so long ago, and in the period after the last census no major event had occurred. This would have been quite different if a census before the occurrence of Hurricane Ivan (in 2004) was only available. The damage resulting from that event and the changes that occurred after that event in terms of demographic, physical and socio-economic conditions would make the use of a pre-hurricane census quite useless.
In the Caribbean censuses are carried out using a large number of enumerators, which go from household to household in their assigned enumeration district, without indicating the spatial location of the inquiries on their forms. This means that it is basically not possible afterwards to geo-locate the census to specific buildings, and to use the census information also for local scale vulnerability and risk assessment. There are plans to change this, for instance in Saint Lucia, where a new census is planned with the held of mobile devices including the positioning of the households.
Objectives:
The objective of this use case is to show how census data can be geo-located and can be used to characterize elements-at-risk and rework the format of the national census database into a format that is useful within a GIS environment.
Flowchart:
Use case study area description:
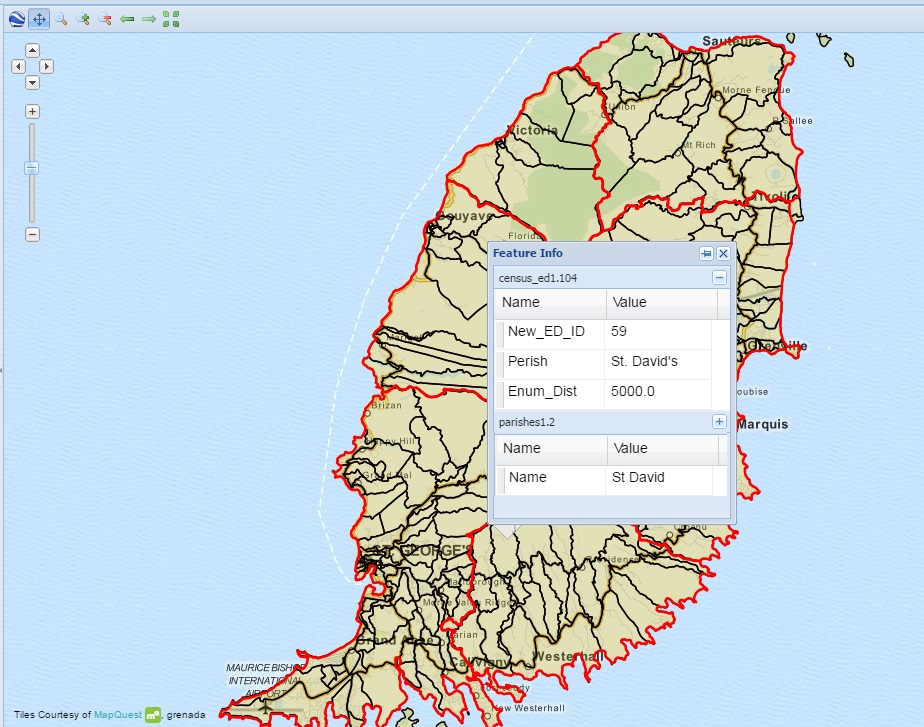
The use case study area is Grenada (main Island). Grenada is subdivided administratively into 8 Parishes of which 6 are on the main island (St. George, St. John, St. Mark, St. Patrick, St. Andrew and St. David) and two on the island of Carriacou and Petite Martinique. For the purpose of the census, the main island is subdivided in to so-called Enumeration districts. An Enumeration District (ED) is a polygon consists of a certain number of houses that is specially established to facilitate census survey. Grenada is sub-divided into 287 EDs including two small islands. However, an ED is not similar to an administrative unit, and the boundaries of the E$Ds are not directly compatible with those of the Parishes. Furthermore, there is fixed number of households in each ED. The minimum number of households in a ED based on available data varies between 3 and 467, with an average of 126 households per ED. Figure 1 shows the enumeration districts in Grenada.
Figure 1: Enumeration Districts in Grenada, combined with Parish boundaries. Click to access the map in GeoNode
In this use case we will use the town of Gouyave in Grenada as examples. It is located in the north-west of Grenada, and is regularly affected by flash flooding. The town is located in Gouyava watershed. Downstream population in this watershed is vulnerable to flooding. They are also threatened by coastal flooding, and there is also a risk of tsunami related to the submarine volcano Kick-em-Jenny. This town was affected in 2011 by severe flash flooding (See figure). It washed away part of one house and damaged household items of many houses in the town. The flood height raised over 1 meter in some places
Data requirements:
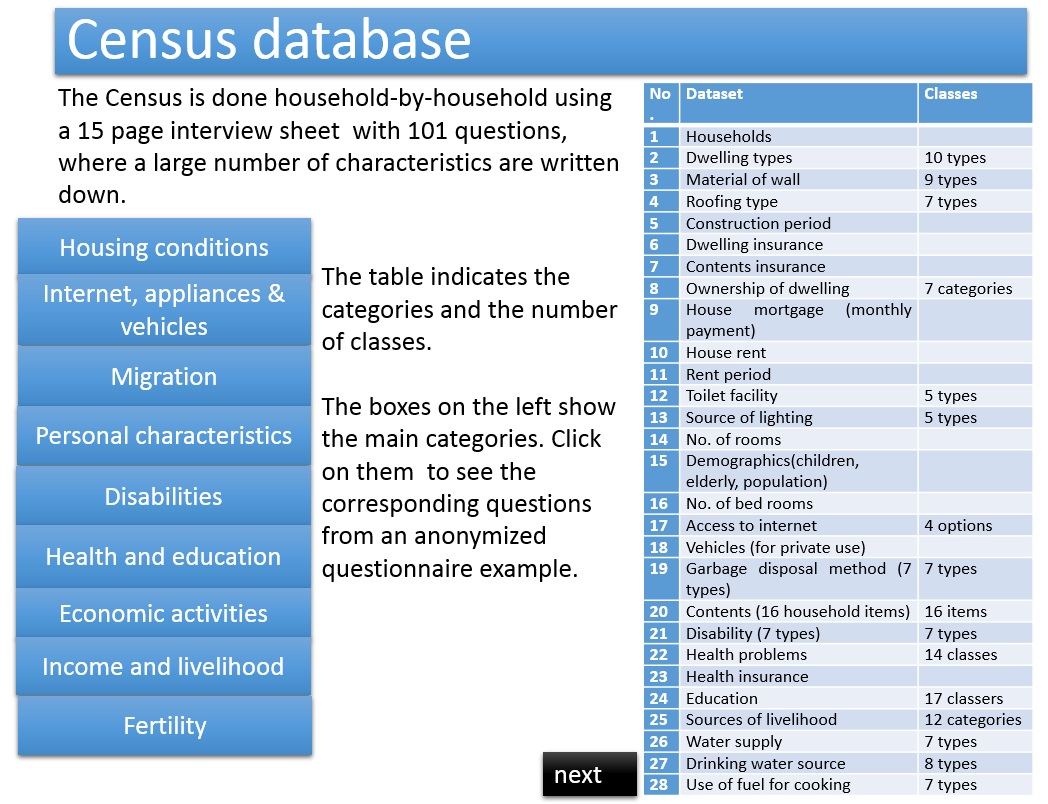
The Census is done household-by-household using a 15 page interview sheet with 101 questions, where a large number of characteristics are written down. In the table below an overview of the census data is presented that was shared by CSO. The main drawback in this data was that it was not spatially located. No building coordinates were collected during the census survey. For, instance, it is not clear, how the population is spatially distributed over the island.
|
No. |
Dataset |
Classes |
|---|---|---|
|
1 |
Households |
|
|
2 |
Dwelling types |
10 types |
|
3 |
Material of wall |
9 types |
|
4 |
Roofing type |
7 types |
|
5 |
Construction period |
|
|
6 |
Dwelling insurance |
|
|
7 |
Contents insurance |
|
|
8 |
Ownership of dwelling |
7 categories |
|
9 |
House mortgage (monthly payment) |
|
|
10 |
House rent |
|
|
11 |
Rent period |
|
|
12 |
Toilet facility |
5 types |
|
13 |
Source of lighting |
5 types |
|
14 |
No. of rooms |
|
|
15 |
Demographics(children, elderly, population) |
|
|
16 |
No. of bed rooms |
|
|
17 |
Access to internet |
4 options |
|
18 |
Vehicles (for private use) |
|
|
19 |
Garbage disposal method (7 types) |
7 types |
|
20 |
Contents (16 household items) |
16 items |
|
21 |
Disability (7 types) |
7 types |
|
22 |
Health problems |
14 classes |
|
23 |
Health insurance |
|
|
24 |
Education |
17 classers |
|
25 |
Sources of livelihood |
12 categories |
|
26 |
Water supply |
7 types |
|
27 |
Drinking water source |
8 types |
|
28 |
Use of fuel for cooking |
7 types |
Table 1: List of census data provided by the Central Statistics Office
The latest census data for the study was provided by the Central Statistical Office (CSO), Ministry of Finance, government of Grenada. The statistics office collects a large set of data related to demographic characteristics, housing, health, education, income, crime etc. which is stored it in a relational database for analysis and reporting. The census office provided visitation records for two EDs in Gouyave town. These EDs were selected because they are particularly vulnerable to flooding and they were also affected in 2011 flood. In a notepad laptop with ILWIS software building footprints and pan-sharpened Pléiades high resolution satellite images of these ED were loaded. Small size maps with the image and the building footprints were also printed for easy reference in geo-locating buildings. For the characterization of buildings, some attributes (use type, occupancy type, no. of floors, construction type, flood proofing, building code, household code) were added in the building footprint map.
Analysis steps:
Step 1. Geo-locating census data
The geographical coordinates of the buildings were household surveys were carried out were not recorded during the census that was carried out in Grenada in 2011. In order to apply census data for risk analysis and determine vulnerability directly at household level, census data was geo-located in two enumeration districts by combining building footprints and census data.
Census in Grenada has basically two parts; one part consists of population data and the second part is related to housing. In the housing census, the enumerators record buildings and then record information on dwellings and households. Buildings are the main structures where dwellings and households are physically located and a dwelling is a specific building or part of a building (attached or within the building), which is specifically being used for living purpose (i.e. occupancy type is residential). Whereas, a household is (a) person (s) living (usually together and share one daily meal in case of more than one persons) in that particular dwelling.
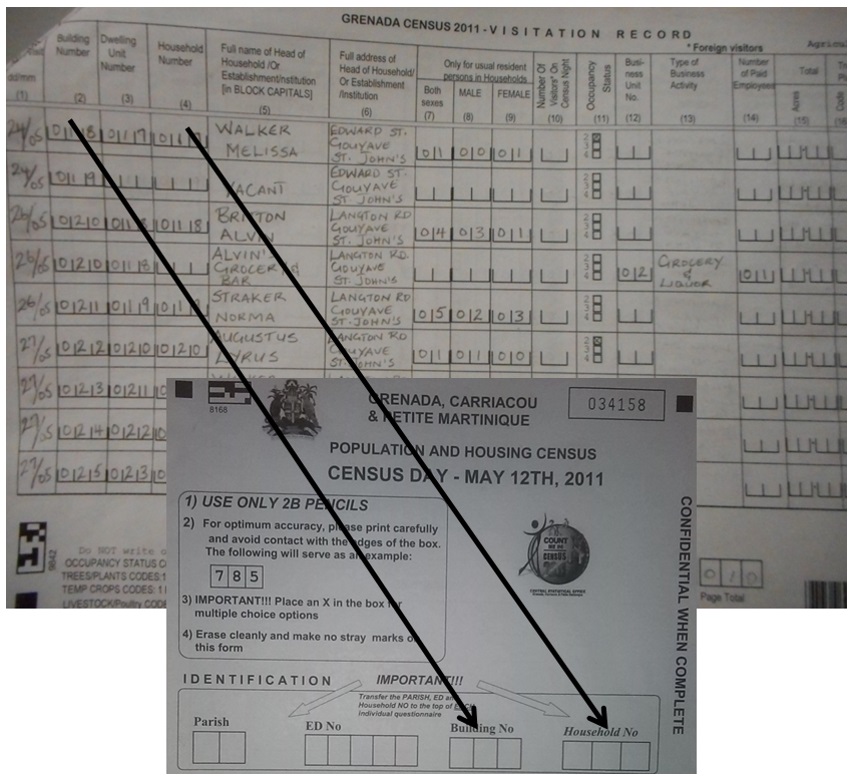
Prior to the start of the population census the Central Statistics Office (CSO) conducted housing census and recorded the requisite information in what is called a " Visitation Record" (Figure 2). They record building number, dwelling number, household number, name of head of household, address, and other information related to one building. When assigning these numbers the enumerators are neither collecting building coordinates nor physically marking buildings with respective to building code they put in their visitation record. The only possibility of locating a building is with enumeration district number, street name, and possibly head of household. And if occupants of a household shift to another place, the name of head of household becomes less relevant. Tracing of buildings and household is only possible with the support of same enumerators who were involved in the census in that particular ED.
The support of two local residents was secured for guidance and to identifying respective buildings. One of them was earlier involved in the census in the same area. The primary task was to link building and household codes from visitation record to respective building footprint with the support of satellite imagery and local knowledge of local guides. With the help of street name and name of household head, the local guides were able to locate the house of that person in that particular street from where building numbers were potentially started as per visitation record. Once we found the starting point physically for ED with respective visitation record, from there on, we had to reconstruct survey path of Enumerators they may have taken in 2011 for housing census. For each physically identified building on a particular street with respect to visitation record, same building and household numbers were entered in the corresponding building footprint table directly in the laptop. By assigning same building number from housing census to corresponding building footprint from physical planning unit, we were able to link two datasets and geo-locate census data with buildings. The enumerators in the course of population census use the same building and household numbers to collect population information on specially designed data collection forms as shown through arrows in the Figure .
Step 2 Data preparing and processing
The original census data was provided in SPSS format. This data was converted into MS Excel format to be able to analyse it and use with ArcGIS and ILWIS. Even the exported data in Excel was not in a suitable shape (due to specified reporting format used in SPSS) that could be analysed easily and linked with GIS. Therefore, all exported tables were re-arranged and adjusted in Excel for their use in the assessment. The data was then checked for quality and suitability for its use in the study. A new unique enumeration ID was assigned to each Enumeration District polygon and subsequently, all related census data was linked with respective EDs accordingly.
Results:
Figure 2 shows how the code that is given to the buildings during the visitation record that contains a code for each building, a code for the dwelling, and a code for the household. The name of the household is recorded, as well as the address of the head of the household. Not that the exact address is not indicated, not the X,Y location, which makes it later quite difficult to reconstruct which building is the one indicated.
The link with the population and housing census survey sheet is also indicated, which has information on Parish, Enumeration District, and the same building code and household code as the visitation record.
Figure 2: Example of the link between the visition record and the census survey sheet.
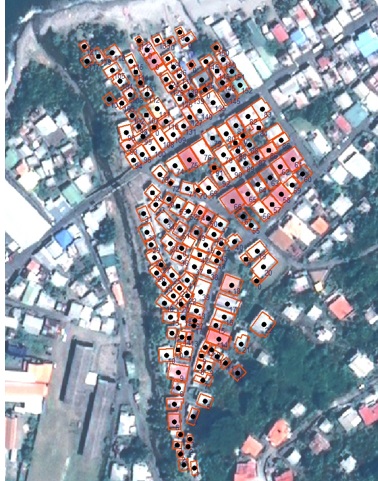
The location of the individual census survey records of household and buildings is a very time consuming activity, and requires assistance of the original enumerators. Figure 3 shows the buildings in the Enumeration District in Gouyave for which the census data was geo-located.
Figure 3: Buildings in the ED in Gouyave for which the census survey sheets were geo-located.
Conclusions:
The Central Statistics Office of Grenada conducted survey in 2011 but they didn" ™t collect geographical coordinates of buildings where the households live. This makes that the use of census data becomes limited in local exposure, vulnerability and risk assessment. The data can only be used at an aggregated level of Enumeration districts, and only serves for generating national scale vulnerability indexes, as shown in Use Case 7.1.
For the next census it is imperative that enumerators also collect building coordinates, using GPS. Alternatively, through a joint effort of all concerned organizations in the country, they should generate building footprints with better quality and in the time of census the field enumerators can assign the unique codes from the building footprint to the respective household. The third option could be for the census department to geo-locate buildings in each ED afterwards using the method which was shown for Gouyave. However, this is the worst alternative, as it takes a lot of time and effort to reconstruct the location where a household was surveyed. Besides, before taking such an initiative it is important to improve the quality of existing building footprints or freshly digitize buildings with recent high resolution satellite imageres.
Obviously the best approach is to carry out the census using tablets or small laptops with GPS, where also the survey sheets are digital, thereby avoiding the tedious digitizing operation which now still has to take place.
References:
Most of the references have a link where you can access a pdf opf the document.
Birkmann, J. (2006). Indicators and criteria for measuring vulnerability: theoretical bases and requirements. In J. Birkmann (Ed.), Measuring Vulnerability to natural hazards: Towards disaster resilinet socities. United Nations University Press. Link
Birkmann, J. (2007). Risk and vulnerability indicators at different scales:Applicability, usefulness and policy implications. Environmental Hazards, 7(1), 20- 31. Link
Catherine, J. L. (2010). Analysing Vulnerability to Volcanic Hazards: Application to St . Vincent. University Collecge London. Link
Cutter, S. L. (1996). Vulnerability to environmnetal hazards. In Progress human geography (pp. 529- 539). Link
Cutter, S. L., Boruff, B. J., & Shirley, W. L. (2003). Social vulnerability to environmental hazards. Social Science Quarterly, 84(2). Link
Cutter, S. L., Burton, C. G., & Emrich, C. T. (2010). Disaster resilience indicators for benchmarking baseline conditions. Journal of Homeland Security and Emergency Management, 7(1). Link
Dewan, A. M. (2013). Floods in a megacity: Geospatial techniques in assessing hazards, risk and vulnerability. (A. M. Dewan, Ed.)Floods in a Megacity: Geospatial Techniques in Assessing Hazards, Risk and Vulnerability (p. 219). Dordrecht: Springer. Link
MOVE. (2011). Assessing vulnerability to natural hazards in Europe: From Principles to Practice A manual on concept , methodology and tools (p. 48). Bonn. Link
Müller, A., Reiter, J., & Weiland, U. (2011). Assessment of urban vulnerability towards floods using an indicator-based approach - a case study for Santiago de Chile. Natural Hazards and Earth System Science, 11(8), 2107- 2123. Link
Papathoma-Köhle, M., Kappes, M., Keiler, M., & Glade, T. (2010). Physical vulnerability assessment for alpine hazards: state of the art and future needs. Natural Hazards (Vol. 58, pp. 645- 680). Link
Papathoma-Köhle, M., Keiler, M., Totschnig, R., & Glade, T. (2012). Improvement of vulnerability curves using data from extreme events: debris flow event in South Tyrol. Natural Hazards, 64(3), 2083- 2105. Link
Reliefweb. (2004). Grenada Hurricane Ivan Flash Appeal Oct 2004 - Mar 2005 - Grenada | ReliefWeb. Retrieved February 04, 2015. Link
Sagara, J., & Saito, K. (2013). Risk assessment and hazard mapping. Washington, DC: The World Bank. Link
Tate, E. (2012). Social vulnerability indices: a comparative assessment using uncertainty and sensitivity analysis. Natural Hazards, 63(2), 325- 347. Link
World Bank. (2004). Grenada preliminary assessment of damages of Hurricane Iva (p. 12). Link
World Bank. (2005). Grenada: A nation rebuilding - An assessment of reconstruction and economic recovery one year after Hurricane Ivan (p. 70). Link
Last update: 07 - 04 - 2016