

Dominica
The CHARIM project has generated a number of thematic maps for Dominica. On this page you can download the high-resolution PDF version of the maps, with complete cartographic representation. The digial maps can be consulted on the CHARIM Geonode.
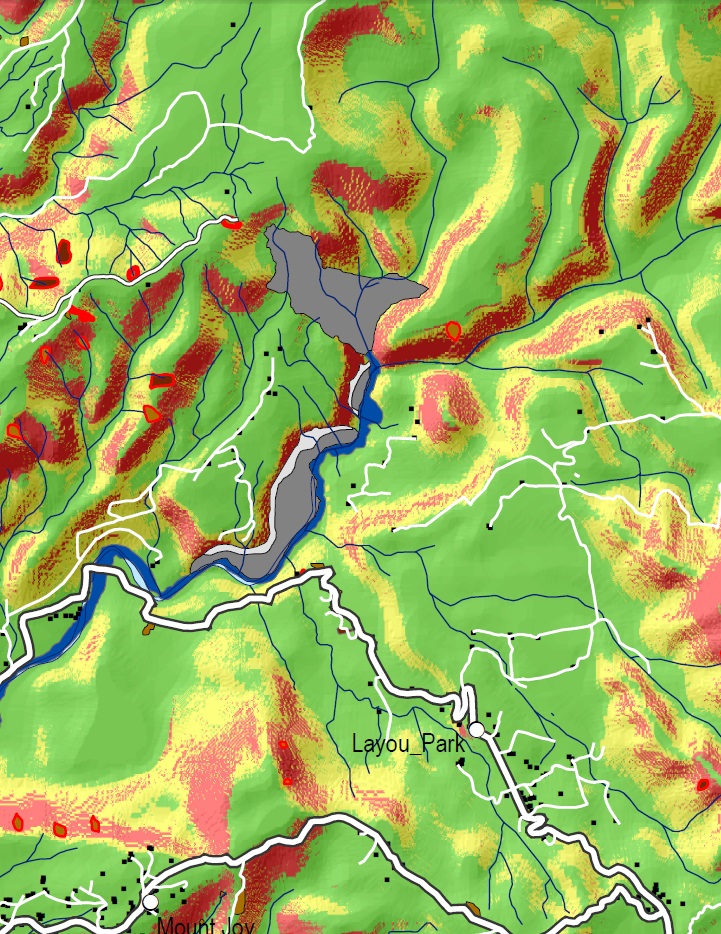
Detailed topographic map
|
|
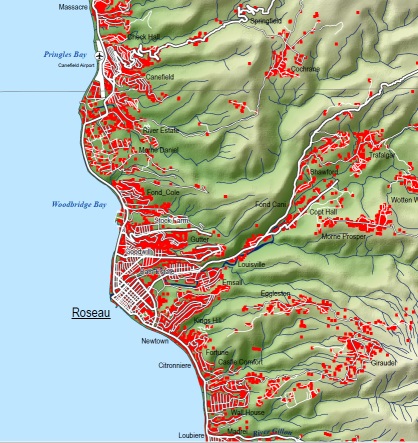 |
Summary of the procedure to make the map:
The available road map was adjusted based on a very high resolution satellite image (Pleiades, with spatial resolution of 2 meters multi spectral and 0.5 meter panchromatic). Screen digitizing was done to map the road and make a road classification. Building information was initially only available for Roseau. In order to obtain building data for the entire country, the very high resolution satellite image was used, and thresholds were made for the individual bands. The resulting building mask was converted to polygons, and subsequently to points. The points were edited subsequently manually through screen digitizing using the very high resolution satellite image, and each building in Dominica was digitized using a point. Drainage lines were generated from the Digital Elevation Model and through editing. Place names in Dominica were obtained from an existing dataset, and through available maps and Google Earth. Airports, and other landmarks were digitized using the very high resolution images. Quarries were also mapped from these images.
Land Cover Map
|
|
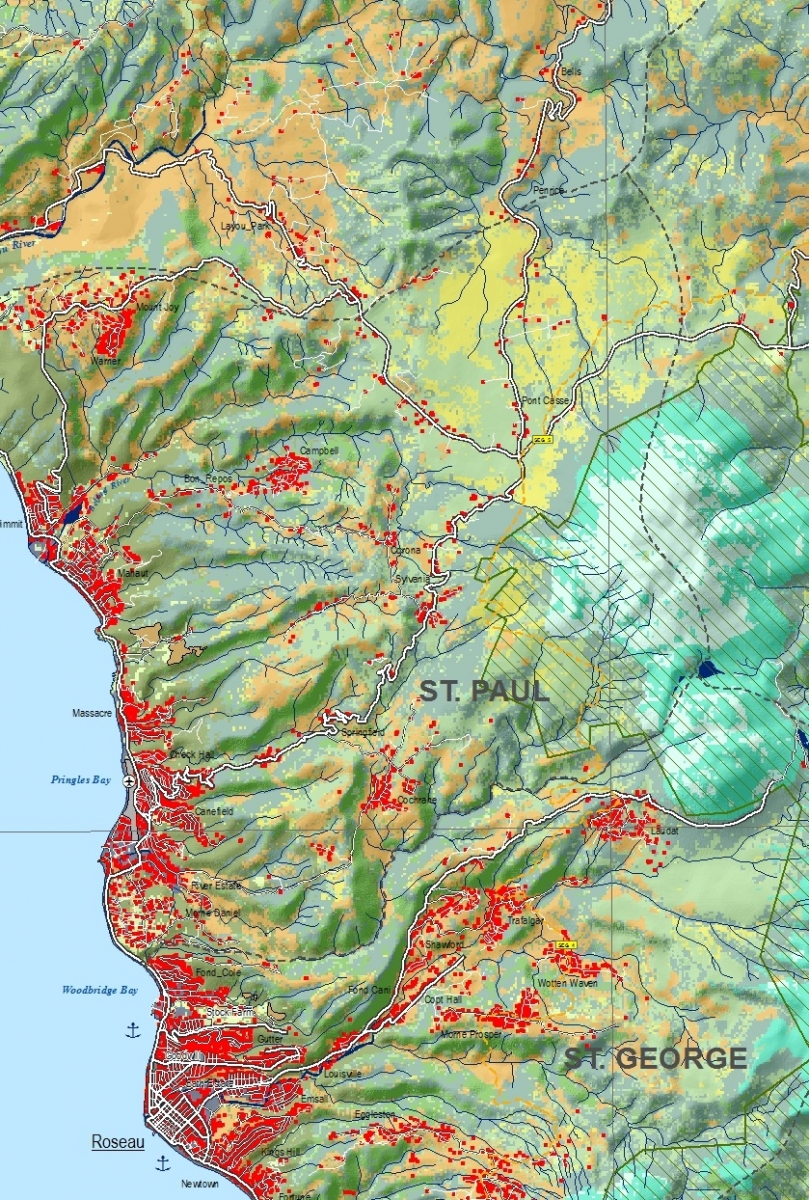 |
Summary of the procedure to make the map:
Initially we only obtained a vector-based land cover map without any metadata, so it is not clear how old this map is, who made it, using which techniques. This map is very general when comparing it with a satellite image. The land-use map consists of 18 units. Later on we obtained another land cover map from developed from satellite imagery as part of a multi-organization project. For Dominica, Landsat and SPOT images acquired between 1996 and 1999. A preliminary unsupervised classification was generated to identify areas of distinct spectral characteristics to guide field inspections and the collection of training data (Arces et al., 1999; Coan et al., 2007).
Flashflood hazard map
- Download the PDF version
- Download the report on flood hazard assessment for Dominica
- Go the GeoNode to view and download the map
|
|
 |
Summary of the procedure to make the map:
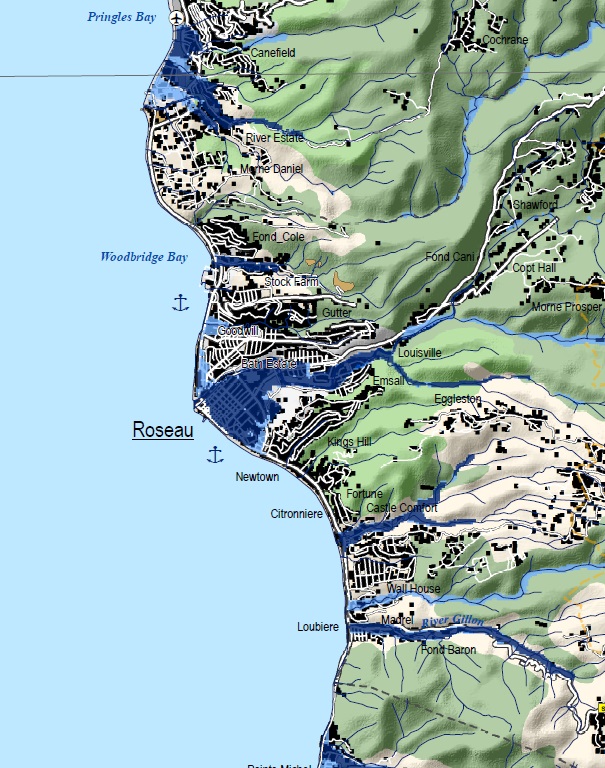
The flood hazard assessment was based on flash flood modelling of the entire island (all watersheds in one simulation). The following steps were used:
- Analyze the long term records of daily rainfall data of each island to determine the rainfall depth for 5, 20 and 50 years. These record are often measured at the national airports or capitals of the islands. The daily maxima are combined in a Gumbel probability density analysis for the return periods. If more than one station exists, average values are used based on expert judgement.
- Design events are created with 5 or 10 minute intervals for each island, which have the total rainfall depth (in mm) from step 1. The shape of these events is based on an analysis of detailed rainfall data of Saint Lucia (1 minute intensities data approximately fifteen stations for 12 years of rainfall). The analysis method is similar to the one used by the US meteorological service to construct 4 types of rainfall for the US. Each island has its own series of four design events (different magnitudes) but a shape that is based on the probability density analysis of St. Lucia detailed rainfall.
- Construct a model dataset based on DEM, digitized rivers, roads and buildings, a soil map and a land use map for each island.
- Simulate the flood dynamics for each design event using the LISEM modeling software
- Combine the four flood extent maps into one flood hazard map. Areas that are flooded with a frequency of 5 years or less are marked as very high hazard while areas that are flood once every 50 years or more are classified as low hazard.
- Make a cartographic product of these hazard maps for each island (on a scale of 100,000).
Landslide inventory map
|
|
 |
Summary of the procedure to make the map:
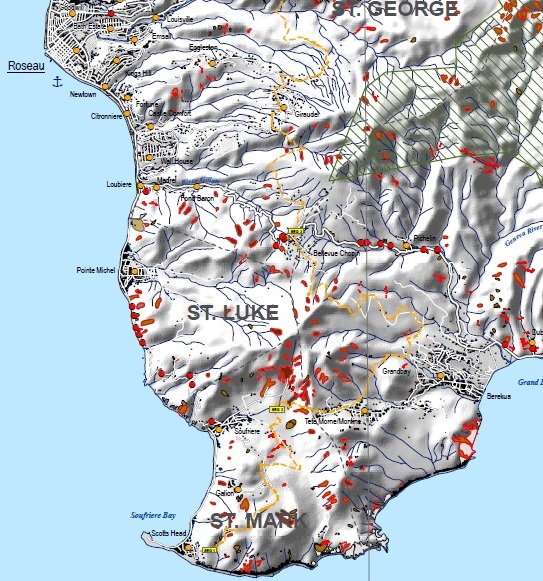
We generated a new database of disaster events for Dominica, making use of many different sources. This is the most complete inventory to our knowledge. It is quite clear from this database that the landslide reporting became more frequent in recent years, and less information on landslides is available when going back in time, whereas the data on tropical storms and hurricanes seems to be much more constant over time. The underreporting of landslides is a big problem in trying to evaluate landslide frequency/magnitude relations. We also compiled all available landslide occurrence data from different sources. We had to digitize some of the older inventories which were only available in paper format. Eventually we compiled landslide inventories for 1987, 1990, 2007 and we generated a completely new landslide inventory using multi-temporal visual image interpretation, and generated an extensive landslide database for Dominica. The resulting landslide database contains 980 landslides from 1987, 183 from 1990, 161 from 2007 and 986 new landslides were mapped representing the situation in 2014. We also compiled landslide inventories along the road network for five recent events from the maintenance records of the Ministry of Public Works. These contained 27 landslides for September 2009, 20 for October 2010, 84 for September 2011, 74 for November 2011 and 44 for April 2013. After completing the first version of the report a large number of landslides were triggered by tropical storm Erika in August 2015. We decided to include these data in this second version of the report, and also update the landslide inventory and susceptibility map. UNOSAT mapped a total of 1554 new landslides as polygons using semi-automatic image classification and BRGM mapped 89 landslides as points in the field.
For more information on how this map was made, see use case 9.3 Landslide inventory mapping
Landslide susceptibility map
|
|
 |
Summary of the procedure to make the map:
Landslide susceptibility assessment was carried out in two steps. First the importance of the various causal factors was analyzed using statistical modelling with Weights of Evidence (WOE) Analysis. This was done in an iterative process, and new factors were generated and tested. The final landslide susceptibility maps were generated using Spatial Multi-Criteria Evaluation (SMCE), where the weights form the statistical analysis were used as a basis, but were modified when considered appropriate. Also the effect of different weighting between the factor maps was evaluated. The quality of the resulting landslide susceptibility maps was tested using success rate curves, which were also used to classify the final susceptibility maps.In order to use SMCE, the factor maps need to be ordered, and standardized inside of a criteria tree. In order to decide the final criteria tree to be used to produce the final maps, several scenarios were tried as a sensitivity analysis to find out the best combination and ordering of the factor maps, and to compare how different methods of standardization can affect the results. in order to do this to main stages will be made.
Links: