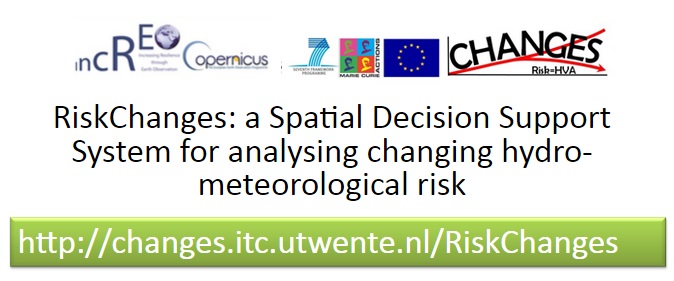
Within the framework of the EU FP7 Marie Curie Project CHANGES (www.changes-itn.eu) and the EU FP7 Copernicus project INCREO (http://www.increo-fp7.eu) a spatial decision support system was developed with the aim to analyse the effect of risk reduction planning alternatives on reducing the risk now and in the future, and support decision makers in selecting the best alternatives. The Spatial Decision Support System is composed of a number of integrated modules.
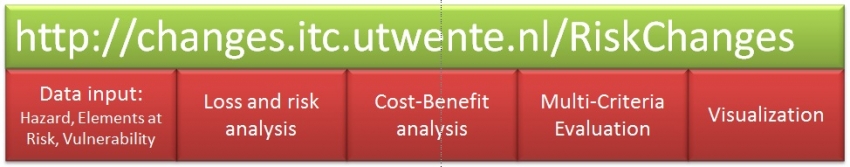
The system is online, and can be accessed through the following URL:
Keywords:
Risk; changes; Spatial Decision Support System; SDSS; Web-based; Open Source
| Before you start: | Use case locations: | Uses GIS data: | Authors: |
|---|---|---|---|
| In order to understand better the procedures described in this use-case we recommend you to first follow the training use case earlier in this chapter (4.1 to 4.5) | The use cases in this chapter are related to a hypothetical situation on one of the small Caribbean islands | Yes, this use case uses an online Spatial Decision Support System, RiskChanges, which contains a demo data set, that is similar to the one used in the previous exercises. | Cees van Westen, Kaixi Zhang, Wim Bakker, Vera Andrejchenko, Julian Berline, Roya Olyazadeh and Irini Cristal. |
Introduction:
Objectives:
There are different possible uses of the system, which are illustrated in the animation below:
Analyzing the current level of risk (both physical and population) for multi-hazards, (See use case 4.2)
This is done by integrating hazard intensity and spatial probability maps for different hazards and multiple return periods, elements-at-risk maps (building footprints, land parcels, lines or points) with associated attributes (type, value, number of persons), vulnerability curves, and administrative units. First losses are calculated for each combination of hazard return period and elements-at-risk, and then multi-hazard risk is calculated by considering all return periods and all hazard type. Also the interdependency of the hazards is taken into account. The system also allow to calculate the uncertainty by using average and standard deviation values for all parameters.
Analyzing the best risk reduction alternative (See use case 4.3)
Different risk reduction / planning alternatives can be defined in the system in the form of projects. For each of these alternatives the user can define whether this alternative requires new hazard maps, elements-at-risk maps , and./or vulnerability data. New data can be uploaded, and the losses and risk can be re-analyzed. The difference between the average annual risk before and after the implementation of the alternative gives the annual benefit which can be used in a cost-Benefit analysis, together with information on the investment and management costs of the alternatives. The cost-Benefit analysis provides several indicators to determine the most cost-effective alternative. Also other indicators can be incorporated which are not directly risk based or based on cost-benefit, such as social, environmental and political indicators, and the users can use a Multi-Criteria tool to determine the optimal alternative.
Analyze how risk could change under possible future scenarios (See use case 4.4)
Another type of use of the system is the evaluation how the physical and population risk might change given one or more possible future scenarios. These scenarios are defined by experts, and could incorporate the effects of climate change , land use change, demographic change and/or socioeconomic change. New status maps have to be produced for one or more future years. This means that hazard maps and elements-at-risk maps have to be updated for these specific scenarios and future years. The system allows to re-analyze the risk for these combinations and make a comparison of the changing risk under different scenarios.
Determine the best "change-proof" risk reduction alternative (See use case 4.5)
The most complicated use of the system is to combine the above uses into one, that determines which of a set of possible risk reduction would produce the lowest risk under different possible future scenarios. Here , specific combinations of risk reduction alternatives, possible future scenarios and future reference years are defined and for each combination the expert should upload the expected hazard intensity maps and elements-at-risk maps. The system then allows to calculate the difference between the current level of risk and the risk for a given combination of alternatives and scenarios for a given year. This benefit which is changing in the future is then used ni a cost-benefit analysis to determine the best risk reduction alternative. Also other indicators can be incorporated in the Multi-Criteria Evaluation.
Each of these fours possible uses of the system were worked out in detail in the previous use-case
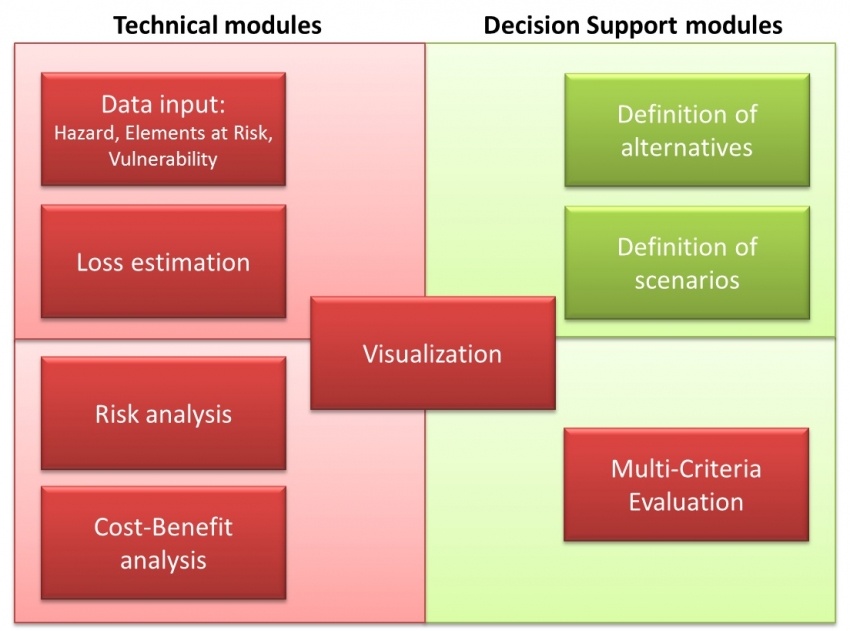
Flowchart:
The Risk Assessment module allows to carry out spatial risk analysis, with different degrees of complexity, ranging from simple exposure (overlay of hazard and assets maps) to quantitative analysis (using different hazard types, temporal scenarios and vulnerability curves) resulting into risk curves. The system does not include a module to calculate hazard maps, and existing hazard maps are used as input data for the risk module. The second module of the SDSS is a data input and management module. This module includes the definition of risk reduction alternatives (related to disaster response planning, risk reduction measures and spatial planning) and links back to the risk assessment module to calculate the new level of risk if the measure is implemented. The third module is a cost-benefit module to compare the alternatives and make decision on the optimal one. The fourth module of the SDSS is a multi-criteria evaluation module that uses the risk data and cost-benefit data in combination with user defined criteria in order to make the selection of the optimal risk reduction measure.. The fifth module is a communication and visualization module, which can compare scenarios and alternatives, not only in the form of maps, but also in other forms (risk curves, tables, graphs). The envisaged users of the system are organizations involved in planning of risk reduction measures, and that have staff capable of visualizing and analysing spatial data .
Problems definition and specifications:
System architecture
The system is designed using a Three-Tier Client-Server Architecture. The top tier or presentation layer constitutes the user interface, the middle tier is the core of the system for business logic and the bottom tier handles the data storage. One of the advantages of this architecture is easier to make changes in the layers without influencing the other layers.
The SDSS is developed using open source and geospatial technologies. Open source software is freely available for public use and users are free to modify and customize the software. For instance, OSGeo (Open Source Geospatial foundation, http://www.osgeo.org/). The SDSS is an open source platform that comprises of a Geoserver, PostGIS and Javascript client side (OpenLayers and GeoExt based on ExtJS). The SDSS employs HTML, JavaScript and CSS on the client side with a combination of Python/PHP scripting language and a PostGIS database on the server side. All the maps and all the data are stored in the PostGIS database. Analytical components for risk are implemented using SQL in the spatial database and decision analysis calculations are carried out in JavaScript on the client side. Finally, all the results are stored into the database.
System components
Data requirements:
Documentation
Here you can download more detailed documentation on the different modules. click on one of the buttons to download the related document
.


Analysis steps:
Demonstration of the Data Input Module.
This video guides you through the data input module.

Demonstration of the Loss and Risk Analysis Module
This video guides you through the loss and risk assessment module.

Demonstration of the Cost-Benefit Analysis Module
This video guides you through the cost-benefit analysis module.

Demonstration of the Multi-Criteria Analysis Module
This video guides you through the multi-criteria analysis module.

Demonstration of the Visualisation Module
This video guides you through the visualisation module.