

This chapter discusses the various sources for population distribution maps. It also provides an example from Grenada on the generation of population distribution at building level, by combining building footprints and census data at enumeration district level.
Keywords: Population distribution, Dasymetric mapping, Gridded population data, GPW, GRUMP, LandScan, WorldPop, High Resolution Settlement Layer (HRSL) Population Data
Authors: Manzul Kumar Hazarika, Syams Nashrrullah, Mujeeb Alam, Cees van Westen, Adityo Dwijananto,
and Ma Louisen Roxas
Links:
- Methodology Book, section 5.2
- Use Case 7.5 Using census data for characterizing elements-at-risk at local scale
- http://sedac.ciesin.columbia.edu/data/collection/gpw-v3
- http://web.ornl.gov/sci/landscan/
- http://www.worldpop.org.uk/
Introduction
High resolution and spatially accurate data on population distribution are very important for disaster and risk management. Rapid urbanization and population growth over the past decade has brought population distribution to forefront from a risk perspective. Census is the only consistent source for demographic data with a wide geographic scope. It is the most reliable information for describing households, neighborhoods, cities, and countries. They are also used as benchmark data for studying population changes (trend/direction), and are a key input for making population projections including gender, poverty, labor force, employment etc. Census data is the basis for governments for policy development, management and evaluation of development programs. However, collection of census data is a costly affair and resource intensive and it is normally completed once in a decade in most countries. Furthermore, census data are often only available at an aggregated level.
Population distribution maps are mainly based on population count from census data which used administrative units as basic map units. Since the 1990s, a spatially gridded population distribution map has also been developed by incorporating land use information and other ancillary data relevant to the distribution of population. In the following sections, the concept of population distribution model is explained and the current global gridded population datasets including Gridded Population of the World (GPW) database , Global Rural Urban Mapping Project (GRUMP), Land Scan, WorldPop, and HRSL population data are introduced. An example of local level population data is also described to demonstrate the application for small island countries of the Caribbean.
Objectives
- Understand the concept of population distribution models.
- Familiarize the reader with the available global population distribution maps.
Description
Population distributions are commonly displayed using choropleth maps of decennial census data. Choropleth maps aggregate population data with administrative units (census tracts or block groups) whose boundaries do not always reflect the natural distribution of human populations. Meanwhile, dasymetric mapping is a method for mapping the distribution of population relative to land use or other ancillary data, such as building footprints, locations of roads, slope and elevation etc. Dasymetric mapping depicts quantitative distribution of population using boundaries that divide an area into zones of relative homogeneity. In dasymetric mapping, a source layer or population data is converted into a surface and an ancillary data layer is added to the surface with a weighting scheme applied to cells coinciding within the zonal boundaries of ancillary data. Dasymetric maps are closely related to choropleth maps, however, they are difference in several ways:
- Zonal boundaries on choropleth maps demarcate by administrative units, while zonal boundaries on dasymetric maps are based on changes in the statistical zones derived from ancillary information.
- Choropleth zones have varying levels of internal homogeneity, while dasymetric zones are designed to be internally homogeneous.
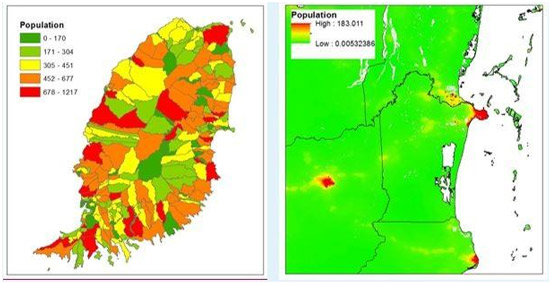
Figure 1: (Left) Choropleth map of population distribution in part of Grenada, (Right) Dasymetric map of population distribution in part of Belize taken from WorldPop
A gridded population distribution transforms population data from their native spatial units, which are usually administrative units of varying resolutions, to a global grid of quadrilateral cells at a certain spatial resolution. The idea to grid population distribution is not new, though the earliest population grids showed little or no improvement over data available by administrative boundaries. Currently, the most widely known global population grids include the Gridded Population of the World (GPW), the Gridded Rural-Urban Mapping Project (GRUMP), LandScan, WorldPop, and High Resolution Settlement Layer (HRSL) population data. GPW provides population estimates at roughly a 5.0 km resolution, while GRUMP and LandScan offer the gridded dataset at roughly a 1.0 km resolution. WorldPop provides an open access archive of spatial demographic datasets for Africa, Asia, Central and South America at a resolution of 100 m. Newly developed regional and country-specific models, HRSL Population data, provide free access to demographic datasets for 140 countries (and more countries will be available in the future) at a resolution of 1 arc-second (approximately 30m).
Because these various datasets (i.e., GPW, GRUMP, etc.) vary in their modeling techniques and the types of input data used for their construction, it is important to note that the dataset that is most useful for Caribbean countries at the moment is the HRSL population datasets, considering the small size of area in comparison with the resolution of the maps. For example, GPW dataset cannot show the population distribution very well for Grenada which has only around 310 square kilometers of total area. On the other hand, Belize has a larger area compared to other Caribbean countries and WorldPop datasets as well as HRSL population datasets can be used to describe the population distribution in this country (Figure 1b). Therefore, it is necessary to further develop the population model for small island countries of the Caribbean by taking examples from the existing global population distribution models. The following briefly explains the methodologies on how the population distribution datasets are used to make population distribution maps:
Gridded Population of the World (GPW)
The GPW v3 is the most recent version of GPW that provides some improvements over the earlier versions, especially in the production input and methods, and the quality of output to allow identification of anomalies and errors introduced during the processing. The basic method for the development of GPW v3 is more or less the same with the method used for GPW v1 and GPW v2. A proportional allocation algorithm (also known as areal weighting) is applied on the highest spatial resolution census or the most recent survey data available with their smallest administrative units, to produce a global grid of quadrilateral cells at a resolution of 2.5 arc-minutes or approximately 4km at the equator. The algorithm works on the assumption that the variable being modeled – in this case population – is distributed evenly over the administrative unit. Grid cells are assigned a portion of the total population for the administrative unit they fall within, dependent on the proportion of the area of administrative unit that the grid cell takes up. The main drawbacks of the GPW dataset are lack of or no ancillary data used for the population distribution model, that unlikely provide a realistic output, especially within large units with significant variation in characteristics of land cover.
Gridded Rural-Urban Mapping Project (GRUMP)
The first version of GRUMP population distribution builds on the GPW v3 datasets, but incorporates urban areas based on the observations of satellite night-lights collected from a series of NOAA’s satellites over several decades. The night-light data and other ancillary data are used to develop an urban-rural “mask,” or urban extents grid, which identifies those areas that appear to be urbanized. GRUMP v1 also includes a geo-referenced database of urban settlements with populations greater than 5,000 persons. A mass-conserving algorithm called GRUMPe (Global Rural Urban Mapping Programme) was developed to produce the population distribution model, which reallocates people into rural and urban areas within each administrative unit. The final stage is to convert the output coverage from GRUMPe into a grid cell at a resolution of 30 arc-seconds or approximately 1km at the equator.
LandScan
The LandScan population distribution used a multi-layered, dasymetric, spatial modeling approach that is also referred to as “smart interpolation” technique. In LandScan models, the typical dasymetric modeling is improved by incorporating and employing multiple ancillary or indicator data layers. The modeling process uses sub-national level census data for each country and ancillary datasets, including land cover, roads, slope, urban areas, village locations, and high-resolution imagery analysis. Cells are preferentially weighted for the possible occurrence of population during a day based upon the spatial data and the socioeconomic and cultural understanding of an area. A “likelihood” coefficient for each cell is calculated within each country and applied to the census counts, then the total population for that area is allocated to each cell proportionally at 30 arc-seconds or approximately 1 km spatial resolution. The resultant of population count is an ambient or average day/night population count.
WorldPop
The WorldPop project was initiated in October 2013 to combine the AfriPop, AsiaPop and AmeriPop population mapping projects. The gridded population distribution model uses dasymetric modelling methods, a local high resolution census data combined with detailed satellite imagery-based mapping of settlements and land cover information. The new population distribution model of WorldPop follows the dasymetric methodologies with an improved random forest regression tree-based mapping approach. In brief, a new semi-automated dasymetric modeling approach known as "Random Forest'' estimation technique has been built that integrates census data and a wide range of open access geospatial datasets in a flexible manner. A combination of remotely-sensed and ancillary datasets (e.g. settlement locations, land cover, roads, building maps, health facility locations, VIIRS night lights, vegetation, and topography) contribute to the modeled dasymetric weights. The “Random Forest'' model is used to generate a gridded prediction of population density at 3 arc-seconds or approximately 100m spatial resolution, which then used as the weighting surface to calculate census counts at a country level.
High Resolution Settlement Layer (HRSL) Population Data
The High Resolution Settlement Layer (HRSL) provides estimates of human population distribution at a resolution of 1 arc-second (approximately 30m) for the year 2015. The population estimates are based on recent census data and high-resolution (0.5m) satellite imagery from DigitalGlobe. The population grids provide detailed delineation of settlements in both urban and rural areas, which is useful for many research areas—from disaster response and humanitarian planning to the development of communications infrastructure. The settlement extent data were developed by the Connectivity Lab at Facebook using computer vision techniques to classify blocks of optical satellite data as settled (containing buildings) or not. The Center for International Earth Science Information Network (CIESIN) used proportional allocation to distribute population data from subnational census data to the settlement extents. There are two datasets provided by HRSL, the population data surfaces that is stored as GeoTiFF files provided the population grids data, and the settlement layers. They use machine learning to identify buildings from commercially available satellite images and then overlay general population estimates based on publicly available census data, other population statistics and gridded population of the world data. More information about their methodology can be found here.
List of widely available global population distribution maps and their specific characteristics is summarized in the table below.
Table 1: Summary of global population distribution maps
|
|
GPW, v3 |
GRUMP, v1 |
LandScan |
WorldPop |
HRSL |
|---|---|---|---|---|---|
| Website |
|
||||
|
Resolution |
2.5 arc minute (~4km at the equator) |
30 arc second (~1km at the equator) |
30 arc second (~1km at the equator) |
3 arc second (~100m at the equator) |
1 arc second (~30m at the equator) |
|
Scope |
Global |
Global |
Global |
Africa, Asia, and America |
Global |
|
Products License |
Free of charge |
Free of charge |
Free of charge for U.S. Federal Government agencies. License fees for all others requests, humanitarian organizations, educational research and commercial organizations are determined on a case-by-case basis. |
Free of charge |
Free of charge |
|
Input data |
Census data Administrative boundaries Coastlines |
Census data Administrative boundaries Coastlines Satellite night time light-derived urban extents |
Census data Administrative boundaries Land Cover Coastlines High resolution imagery Elevation and slope Roads Populated areas (urban boundaries) and populated points (towns and villages) |
Census data Administrative boundaries Land Cover Detailed settlement information from sources such as high resolution imagery, OpenStreetMap (OSM), and GRUMP |
Machine learning, |
|
Products |
Population count grids (1990, 1995, 2000) Population density grids (1990, 1995, 2000) Population count grid future estimates (2005, 2010, 2015) Population density grid future estimates (2005, 2010, 2015) National boundaries (2000) Subnational boundaries (1990, 1995, 2000) National identifier grids (1990, 1995, 2000, 2005, 2010, 2015) Coastlines (2000) Centroids of administrative units (1990, 1995, 2000, 2005, 2010, 2015) |
Population count grids (1990, 1995, 2000) Population density grids (1990, 1995, 2000) Urban settlement points (1990, 1995, 2000) Urban-extents grids (1995) Land/geographic unit area grids (1990) National boundaries (1990) National identifier grids (1990, 1995, 2000) Coastlines (2000) |
Population count grids (most recently for 2011) |
Population count grids (2010, 2015, 2020) Available only for selected regions and countries: Numbers of live births per grid square (2010, 2012, 2015, 2020, 2025, 2030, and 2035) Numbers of pregnancies per grid square (2010, 2012, 2015, 2020, 2025, 2030, and 2035) Estimates of proportion of people per grid square living in poverty (2008) Estimates of number of people in each 5-year age group per grid square (2014) |
Population count grids, |
|
Authors/ Developers |
Center for International Earth Science Information Network (CIESIN), Columbia University |
Center for International Earth Science Information Network (CIESIN), Columbia University |
Oak Ridge National Laboratory (ORNL) |
Dr. Andrew Tatem (University of Southampton, UK / Fogarty International Center, National Institutes of Health, USA ) Dr. Catherine Linard (Universite Libre de Bruxelles, Belgium) Dr. Andrea Gaughan (University of Louisville, USA) |
Center for |
|
Selected publications |
Balk et al., 2001; Balk et al., 2004 |
Balk et al., 2005; Balk et al., 2010 |
Bhaduri et al., 2002; Bhaduri et al., 2007; Dobson et al., 2000 |
Linard et al., 2011; Gaughan et al., 2013; Tatem et al., 2007 |
Comparing Grenada Census Data with HRSL and Worldpop’s Population Data
National census data for Grenada were collected from the Central Statistical Office (CSO), Ministry of Finance, and government of Grenada. To understand more about gridded population data compared with national census data, we will use gridded population data from Worldpop and HRSL data. Both data can be used for local-level analysis if you don’t have detailed population data because they have smaller resolution compared to the GPW, GRUMP, and LandScan.
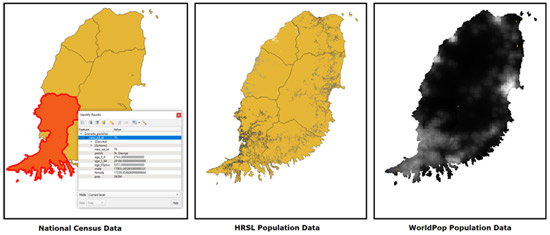
Figure 2: Population data for Grenada from government, HRSL, and WorldPop
To see the difference between two gridded population data, we compare parish-level population data from census data with HRSL and WorldPop gridded population data using zonal statistics in QGIS and integrate it with parish-level administration boundaries shapefile data. From the zonal statistics analysis in QGIS, we can get the sum of population data for each parish and integrate it with the administration boundary vector data (which contain national population data from census).
Figure 3. The result from comparing HRSL and WorldPop gridded population data with national census data
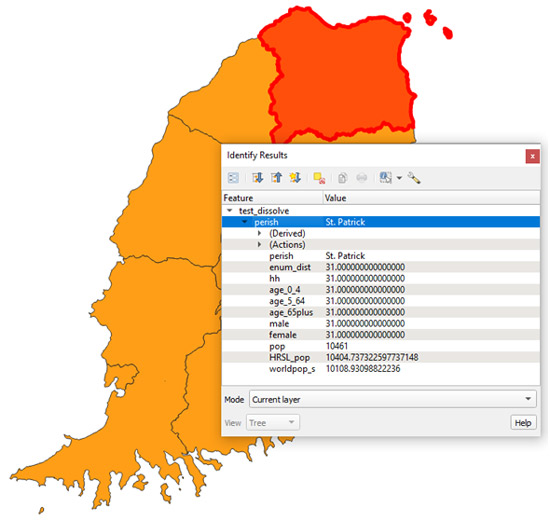
As seen in the figure above, the difference between national census data with gridded population data is small, and therefore the latter can be used as an alternative dataset if you do not have access to national population data. Each of the two gridded population data uses settlement data gained from high resolution satellite imagery and uses large-scale open data from OpenStreetMap to help generate the population distribution analysis.
However, if you want to have more comprehensive population data compared to the data generated from gridded population data, then you need to conduct an enumeration survey for each building in Grenada or use an estimation approach which will be explained next.
Local Level Population Data in the Caribbean: The Example of Grenada
The above-mentioned examples of global population data (i.e., GPW, GRUMP, LandScan, etc.) are not very relevant for most of the Caribbean islands, as they would be covered by only a few cells of the general population distribution maps. Population information should be available at a much larger resolution. This type of data has to come from a national census, where a lot of information is collected at household level, which is then generalized to enumeration districts. However, the data at the household level are not generally not available due to privacy reasons. On the other hand, information at the Enumeration district level may be available, although in some countries there is a lack of willingness to share even this level of data with other organizations. In this example, we will show the situation in Grenada, where census data was shared.
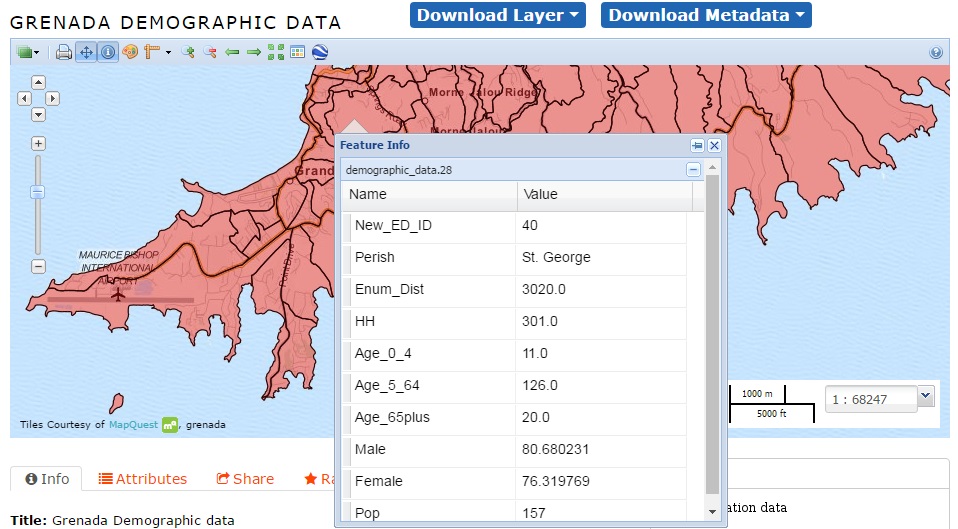
The latest census data for the study was provided by the Central Statistical Office (CSO), Ministry of Finance, and government of Grenada. The statistics office collects a whole range of data including, demographic, housing, health, education, income, crime etc. (See Use Case 7.5) and stores it in a relational database for analysis and reporting. In general, a comprehensive database is available with the CSO. They collect data at the household level which is relationally linked with Enumeration District and Parishes (administrative boundary - there are 8 Parishes in Grenada). An Enumeration District (ED) is a polygon consisting of a certain number of houses that is specially established to facilitate census survey. Grenada is subdivided into 287 EDs (See Figure 4) including two small islands. However, an ED is not an administrative unit. Further, there is no such fixed number of households in each ED. The minimum number of households in an ED based on available data are 3 and maximum is 467 (average 126 households).
Figure 4. Enumeration Districts in Grenada with population information. Click to open in GeoCRIS.
To be able to make a proper exposure and risk analysis, it is important to change this information to building level. Exposure analysis is an important step in risk analysis. It is basically a spatial relationship of hazard footprints and elements-at-risk such as buildings. It is usually carried out to locate vulnerable populations and to identify elements that are exposed to a particular hazard and subsequently determine the physical vulnerability of exposed elements. Results of such analysis are used in risk management and planning.
Therefore, we prepared a population distribution map to model how population is spatially distributed over the island. We generated a population distribution map by using census data as the main source of population data, and building footprint as auxiliary source employing basic concepts of dasymetric mapping. The principal concept of dasymetric mapping involves the process of disaggregating spatial data to a finer unit of analysis, using supplementary (ancillary) data to help refine locations of population or other phenomenon being mapped (Maantay & Andrew, 2009). To use both census data (population) and building footprints to produce a population distribution map for exposure analysis, it was imperative to combine both datasets. In other words, the task was attaching household populations with building footprints. The workflow for the preparation of the population distribution map based on the 2011 census data is presented in Figure 5.
Figure 5. Flowchart illustrating the procedure for generating a detailed population map for Grenada
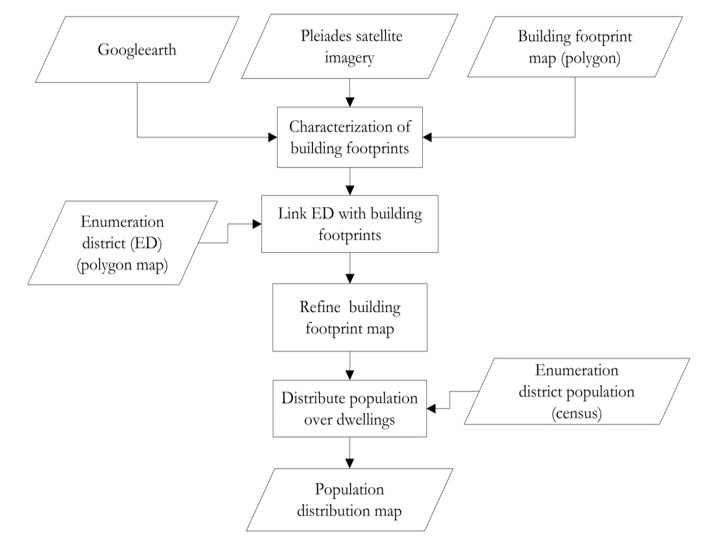
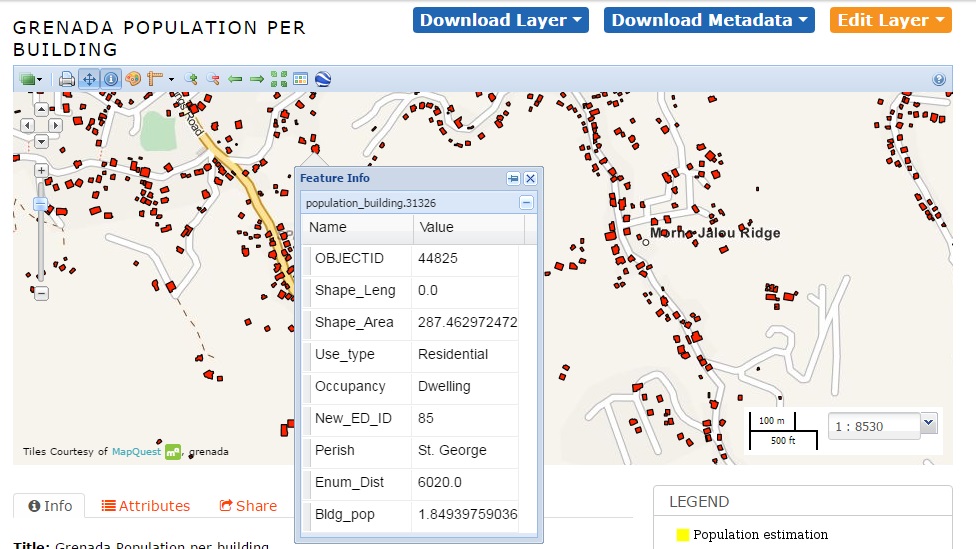
After the characterization of buildings illustrated in Data Management Book section 5.2, it was essential to geographically link all the buildings with Census Enumeration Districts. In ArcGIS, using spatial overlay techniques, all buildings located inside the boundary of a particular ED were selected one by one for each ED and assigned a unique Enumeration District ID respectively. This way, a relation was built between census data and building footprint maps. However, we discovered that the number of dwellings in each ED was higher than actual households reported through the census. The reason was that the quality of the building footprint map was not very good. Many buildings were digitized in several small pieces (polygons) and one single building was sometimes composed of several polygons, with some very small ones, representing sheds etc. To establish some kind of relation between the number of households in each ED as reported in the census data and residential houses from the building footprint map, it was imperative to clean multiple small polygons and other temporary small structures from the database without deleting main polygons. With careful observation on sizes of buildings on the satellite imagery in each ED and analyzing the average polygon size from the building footprint map for each ED, thresholds were set to remove small polygons from each building. Polygons smaller than 10m2, 17m2 , 26m2 , 37m2, 50m2, and 100m2 were removed depending on the average size of buildings in each ED. A separate file was created for the residential buildings (dwellings) only. The objective was to assign population with each dwelling. It was impossible to determine the exact number of persons living in each residential building since there was no common attribute between household information from the census data and building footprint map from the physical planning unit. Making any rule based on the size of the residential building was not practical as well, because buildings were not very well digitized. The obvious choice was to distribute (equally) the population of each ED from the census to the total number of dwellings in the same ED. Therefore, finally, the population distribution map for Grenada was generated by dividing the total ED population with the total number of residential buildings in the respective ED. The resulting map is shown in Figure 6.
Figure 6: Resulting population map at building level generated by integrating census data and building footprints. Click to open the file in GeoCRIS.
Obviously, these population maps are only the first estimation, as they assume equal population numbers per dwelling, and do not consider population in other occupancy types. Also, the temporal variation of population is not taken into account (e.g., daytime-nighttime variation or seasonal variation). More work is needed to be able to generate such data for the target countries. It starts with the willingness of governments to share existing data (e.g., census data), and to integrate the surveys that are carried out by different agencies into a single shareable database, and for the organizations requesting these data to be more forthcoming in signing sharing agreements that also guarantee the respective governments fair use of their data. The Central Statistics Office of Grenada conducted the survey in 2011 but they did not collect geographical coordinates of buildings where households live, therefore limiting the utility of census data to other applications such as risk assessment. In the next census, it is recommended to collect building coordinates as well. Alternatively, through a joint effort of all concerned organizations in the country, they can recollect building footprints with better quality, and in the time of census, the field enumerators will just assign unique code from the building footprint to the respective household. The third option could be the census department geo-locating buildings in each ED. However, before taking such an initiative, they must improve the quality of existing building footprints or freshly digitize buildings with the latest high resolution satellite imageries such as the 20cm aerial imagery of the entire island of Grenada obtained in 2017.
References
Balk D., Deichmann, U., Yetman, G. (2001). Transforming Population Data for Interdisciplinary Usages: From census to grid.
Balk D., Yetman, G. (2004). The Global Distribution of Population: Evaluating the gains in resolution refinement. Center for International Earth Science Information Network (CIESIN), Columbia University
Balk, D., Brickman, M., Anderson, B., Pozzi, F., Yetman, G. (2005). Mapping global urban and rural population distributions: Estimates of future global population distribution to 2015. FAO Working Paper: Environment
and Natural Resources.
Balk D., Yetman, G., de Sherbinin, A. (2010). Construction of Gridded Population and Poverty Data Sets from Different Data Sources. E– Proceedings of European Forum for Geostatistics Conference, 5-7 October 2010, Tallinn, Estonia.
Bhaduri, B., Bright, E., Coleman, P., & Dobson, J. (2002). LandScan: Locating people is what matters. Geo
Informatics, 5(2), pp 34–37.
Bhaduri, B., Bright, E., Coleman, P., & Urban, M. L. (2007). LandScan USA: A high-resolution geospatial and temporal modeling approach for population distribution and dynamics. GeoJournal, 69(1), pp 103–117.
Dobson, J. E., Bright, E. A., Coleman, P. R., Durfee, R. C., & Worley, B. A. (2000). LandScan: A global population database for estimating populations at risk. Photogrammetric Engineering and Remote Sensing,
66(7), pp 849–857.
Eicher, C.L., Brewer, C.A. (2001). Dasymetric Mapping and Areal Interpolation: Implementation and
Evaluation. Cartography and Geographic Information Science, 28(2), pp.125-138.
Gaughan A.E., Stevens F.R., Linard C., Jia P., Tatem A.J. (2013) High Resolution Population Distribution Maps for Southeast Asia in 2010 and 2015. PLoS ONE 8(2): e55882.
Jordan, L. (2014). Beyond Borders: Gridded Demographic Data Sets and Web Mapping Applications for
Population, Development, and Environmental Research. Paper presented on Population Association of America
2014 Annual Meeting Program, 1-3 May 2014, Boston MA.
Linard, C., Gilbert, M., Tatem A.J. (2011). Assessing the use of global land cover data for guiding large area population distribution modelling. GeoJournal, 76(5), pp 525-538.
Maantay, juliana, & Andrew, M. (2009). Mapping urban risk: Flood hazards, race, & environmnetal justice in
New York. Applied Geography, 29(1), 111–124. doi:10.1016/j.apgeog.2008.08.002.Mapping
Rose, A.N., Bright, E. (2014). The LandScan Global Population Distribution Project: Current State of the Art and Prospective Innovation. Paper presented on Population Association of America 2014 Annual Meeting Program, 1-3 May 2014, Boston MA.
Tatem, A.J., Noor, A.M., von Hagen, C., Di Gregorio, A., Hay, S.I. (2007). High Resolution Population Maps for Low Income Nations: Combining Land Cover and Census in East Africa. PLoS ONE 2(12): e1298.
van Westen, C.J., Alkema, D., Damen, M.C.J., Kerle N., Kingma, N.C. (2011). Multi-hazard risk assessment: Distance education course Guide book. United Nations University – ITC School on Disaster Geo-information Management (UNU-ITC DGIM).
Facebook Connectivity Lab and Center for International Earth Science Information Network - CIESIN - Columbia University. 2016. High Resolution Settlement Layer (HRSL). Source imagery for HRSL © 2016 DigitalGlobe. Accessed 29 June 2020.
Last update: 26-01-2021