

Before you start:
Authors:
Dr. Manzul Kumar Hazarika and Mr. Ramesh De Silva
Keywords:
GeoNode
Links:
 There is a very useful Training Manual for GIS Data Managers which deals with GeoNode, how to set-it up and how to link it with Q-GIS. This is training materials for an Advanced Training Course on Spatial Data Management, organized in 2013 by OpDRI, GFDRR, the ACP-EU Natural Disaster Risk Reduction Programme and the University of the West Indies. Contact person at the World Bank are: Bradley Lyon (
Below there is another useful set of background documents on GeoNode developed by Ramesh Da Silva of the AIT Geoinformatics Center. Click to download the manual on:
To change data between the CHARIM GeoNode and the National GeoNodes there is also a useful training manual:
The WFP has a useful and practical guide on the use of GeoNOde
Introduction
GeoNode is a geospatial content management system, a platform for the management and publication of geospatial data. It brings together mature and stable open-source software projects under a consistent and easy-to-use interface allowing non-specialized users to share data and create interactive maps.
Data management tools built into GeoNode allow for integrated creation of data, metadata, and map visualizations. Each dataset in the system can be shared publicly or restricted to allow access to only specific users. Features like user profiles, commenting, rating etc. encourage the development of communities around the platform to facilitate the use, management, and quality control of the data.
It is also designed to be a flexible platform that software developers can extend, modify or integrate against to meet requirements in their own applications. Once the data are uploaded, GeoNode allows the user search for it geographically or via keywords. All the layers are automatically projected to Web Mercator for maps display, making it possible to use different popular base layers, like Open Street Map, Google Map or Bing Map layers.
GeoNode comes with helpful cartographic tools for styling and composing maps graphically. Once data layers are uploaded and saved, it is possible to overlay them for visualization or make a PDF copy for printing. Cartographic tools make it easy for anyone to assemble a web-based mapping with functionality traditionally found in desktop GIS applications.
Objectives
Provide an overview of GeoNode.
Description
GeoNode is based on the Open Geospatial Consortium (OGC) standards, which is an international voluntary consensus standards organization, originated in 1994, covering geospatial content and services, GIS data processing, and data sharing. The main standards include:
|
Web Map Service (WMS) |
Serves geo-referenced map images over the Internet. |
Web Feature Service (WFS) |
Supports the modification of features across the Internet, including both raster and vector data. |
Web Coverage Service (WCS) |
Specifies a web service for delivering multidimensional coverage data over the World Wide Web. |
Catalogue Services for the Web (CSW) |
Allows users to search for geospatial data based on metadata. |
Web Map Context (WMC) |
Describes how to save a map view comprised of many different layers from different Web Map Servers. |
Tile Map Service (TMS) |
provides access to resources, in particular, to rendered cartographic tiles at fixed scales. |
GeoNode's metadata and cataloguing system also enables publishing metadata in a variety of standards (ISO, FGDC, NASA DIF, Dublin Core). The catalogue implementation "pycsw" is certified OGC-compliant and a Catalog Service for Web (CSW) reference implementation.
System Architecture
Architecture is based on a set of core tools and libraries that provide the building blocks on which the GeoNode application is built. The following sections explain each of these components.
Django
The user interface of a GeoNode site is built on top of the Django web framework, which is a high level Python web development framework that facilitates rapid development and clean design. GeoNode includes a few "apps" (reusable Django modules) to support development of those user interfaces. While these apps have reasonable default configurations, which can be adjusted to suit specific needs. The apps provide HTTP proxies for accessing data from remote servers, to overcome restrictions imposed by the same-origin policy used by browsers. This helps the GeoExt applications in a GeoNode site to access various XML documents from OGC-compliant data services.
GeoServer
GeoServer is an open-source software for servers written in Java that provides OGC compliant services, which publish data from many spatial data sources. GeoServer is used as the core GIS component inside GeoNode that renders the layers, creates map tiles from the layers, downloads those layers in various formats, and allows for transactional editing of those layers. GeoNode utilizes GeoServer in following ways:
- GeoNode configures GeoServer via the REST API
- GeoNode retrieves and caches spatial information from GeoServer. This includes relevant OGC service links, spatial metadata, and attribute information
- GeoNode can discover existing layers published in a GeoServer via the WMS capabilities document
- GeoServer delegates authentication and authorization to GeoNode
- Data uploaded to GeoNode is first processed in GeoNode and finally published to GeoServer (or ingested into the spatial database)
GeoExplorer
GeoExplorer is a web application, based on the GeoExt framework, for composing and publishing web maps with OGC and other web-based GIS Services. GeoExplorer is used inside GeoNode to provide many of the GIS and cartography functions that are a core part of the application.
PostgreSQL and PostGIS
PostgreSQL is an SQL-supporting successor to the Postgres DBMS, which was developed up until 1993 at the University of Berkeley. It is a free, open-source, object-relational DBMS and provides some geometrical data types as well as the R-tree as spatial index. However, this implementation does not fulfill the OGC specification and full spatial database functionality is achieved by the PostGIS extension, which is built on top of PostgreSQL.
GeoNode uses PostgreSQL and PostGIS for storing and managing spatial data and information. All the tables and data are stored within a GeoNode database in PostgreSQL, whereas GeoServer uses PostGIS to store and manage spatial vector data for each layer.
pycsw
pycsw is an OGC Catalogue Services for the Web (CSW) server implementation written in Python. GeoNode uses pycsw to provide an OGC compliant standards-based CSW metadata and catalogue component of spatial data infrastructures, supporting popular geospatial metadata standards such as Dublin Core, ISO 19115, FGDC and DIF.
Geospatial Python Libraries
GeoNode leverages several geospatial python libraries including gsconfig and OWSLib. gsconfig is used to communicates with GeoServer's REST Configuration API to configure GeoNode layers in GeoServer. OWSLib is used to communicate with GeoServer's OGC services and can be used to communicate with other OGC services.
Django Pluggables
GeoNode uses a set of Django plugins, which are usually referred to as pluggables. Each of these pluggables provides a particular set of functionality inside the application from things like Registration and Profiles to interactivity with external sites. Being based on Django enables GeoNode to take advantage of the large ecosystem of these pluggables out there, and while a specific set is included in GeoNode itself, many more are available for use in applications based on GeoNode.
jQuery
jQuery is a feature-rich javascript library that is used within GeoNode to provide an interactive and responsive user interface as part of the application. GeoNode uses several jQuery plugins to provide specific pieces of functionality, and the GeoNode development team often adds new features to the interface by adding additional plugins.
Bootstrap
Bootstrap is a front-end framework for layout and styling the pages that make up the GeoNode application. It is designed to ensure that the pages render and look and behave the same across all browsers. GeoNode customizes bootstraps default style and it is relatively easy for developers to customize their own GeoNode based site using existing Bootstrap themes or by customizing the styles directly.
System Requirements
Hardware and Software
Following are the recommended Minimum System Requirements to deploy a GeoNode in a server.
- 6GB of RAM, including swap space.
- 2.2GHz processor. (Additional processing power may be required for multiple concurrent styling renderings)
- 1 GB software disk usage.
- Additional disk space for any data hosted with GeoNode and tiles cached with GeoWebCache (For spatial data, cached tiles, and "scratch space" useful for administration, a decent baseline size for GeoNode deployments is 100GB).
- 64-bit hardware recommended.
Operating System
Ubuntu
The easiest way to install GeoNode is using APT, the standard installation management tool for Ubuntu and other Debian-based systems.
CentOS/RHEL and other *nix distros
It is recommended to download the latest release and modify the included install.sh and support/ config.sh. GeoNode has been installed in CentOS/RHEL using this mechanism.
Windows, OSX and others
The recommended install method in these platforms is to use a virtualization solution, like Virtual Box. Install Ubuntu Linux on the virtual machine and then install GeoNode using APT.
Usage
An example image of GeoNode Home page (Figure 1) is given below.
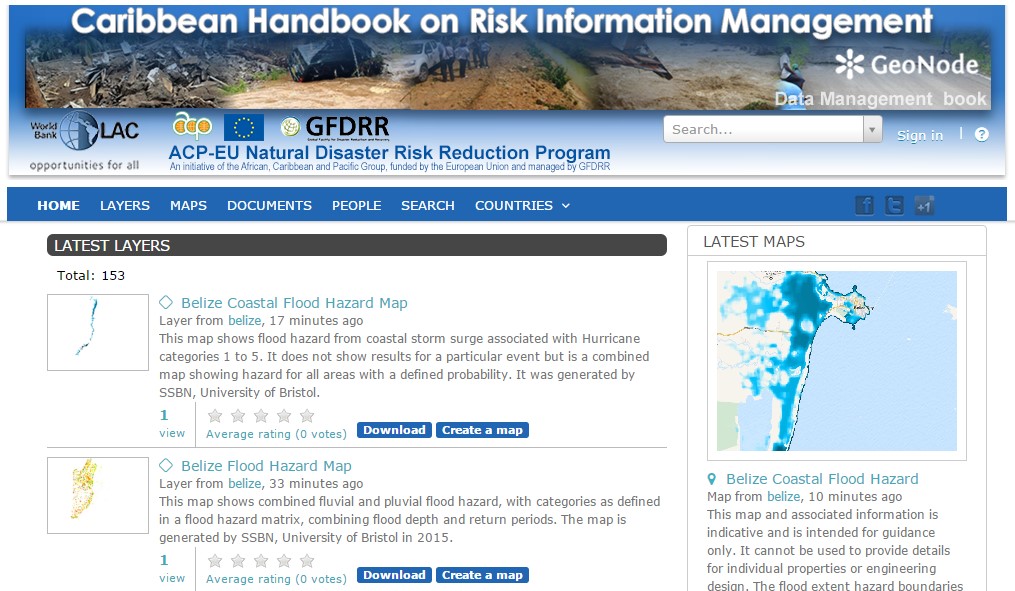
Figure 1 - GeoNode Home Page
In order to upload any data layers or to create maps, it is required to login to the GeoNode. In that case, the system administrator of a given GeoNode need to create a login for the user. But anyone can visualize any publicly shared data layers without login to the GeoNode.
Upload a new data layer
Authorized users can login to the GeoNode and upload data. Layers are a published resource representing a raster or vector spatial data source. Layers also can be associated with metadata, ratings, and comments.
![]()
Figure 2 - Layers Menu
By clicking the Layers link you will be brought to the Layers menu where a new sub-toolbar can be seen. This toolbar allows you to Explore and Upload layers.
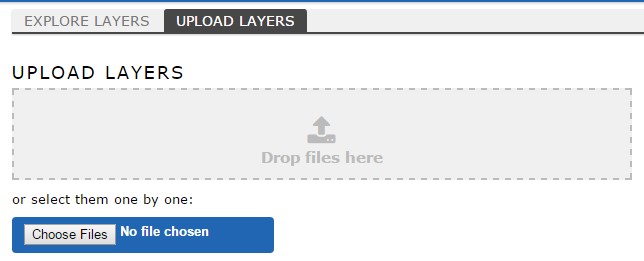
Figure 3 - Upload Layers to GeoNode
There are two possibilities to add your files. You can either do that by using drag & drop or you choose to browse them. Be aware that you have to upload a complete set of files, consisting of a shp, a prj, a dbf and a shx file. If one of them is missing, GeoNode will warn you before you upload them.
Layer permissions
Once a data layer is uploaded to GeoNode you can set permissions as shown in below figure (Figure 4).
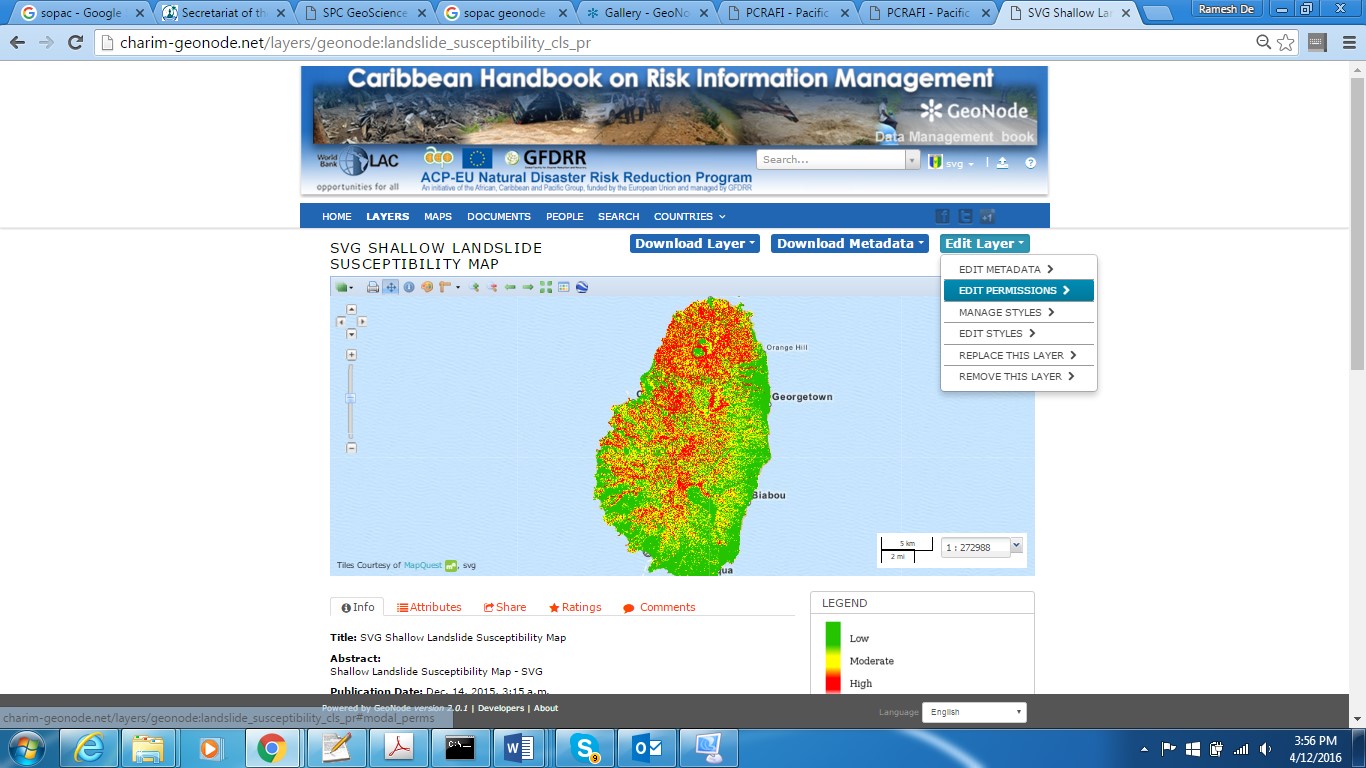
Figure 4 - Edit Layer Permission
Layer Meta Data
Meta data can be added to each data layer. This also can be found under Edit Layer menu.
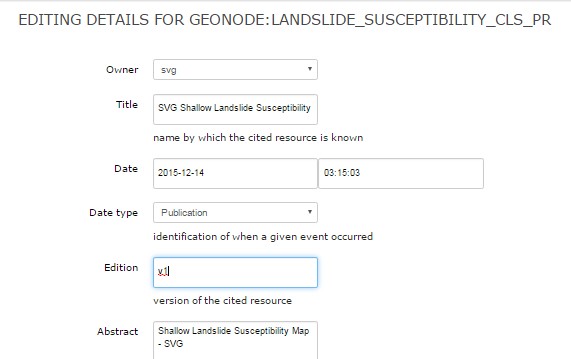
Figure 5 - Add Meta Data
Create a new map
The authorized users can create maps using the existing layers in the GeoNode. A map can consist with one or more data layers and a base map such as Google Satellite map.
![]()
Figure 6 - Maps Menu
A list of available maps can be retrieved by clicking on the Maps link on the top toolbar.
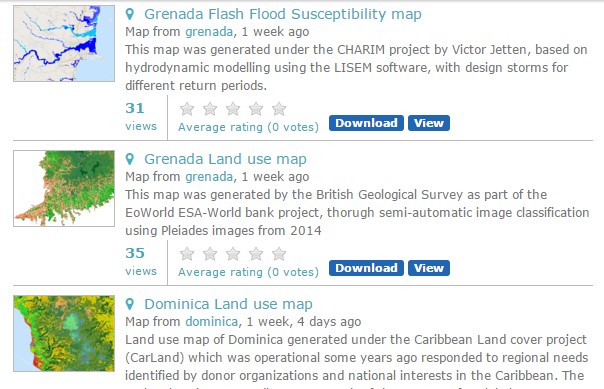
Figure 7 - List of Available Maps
By clicking on the"Create a New Map" button, a map composition interface will be displayed as shown in below figure (Figure 8).
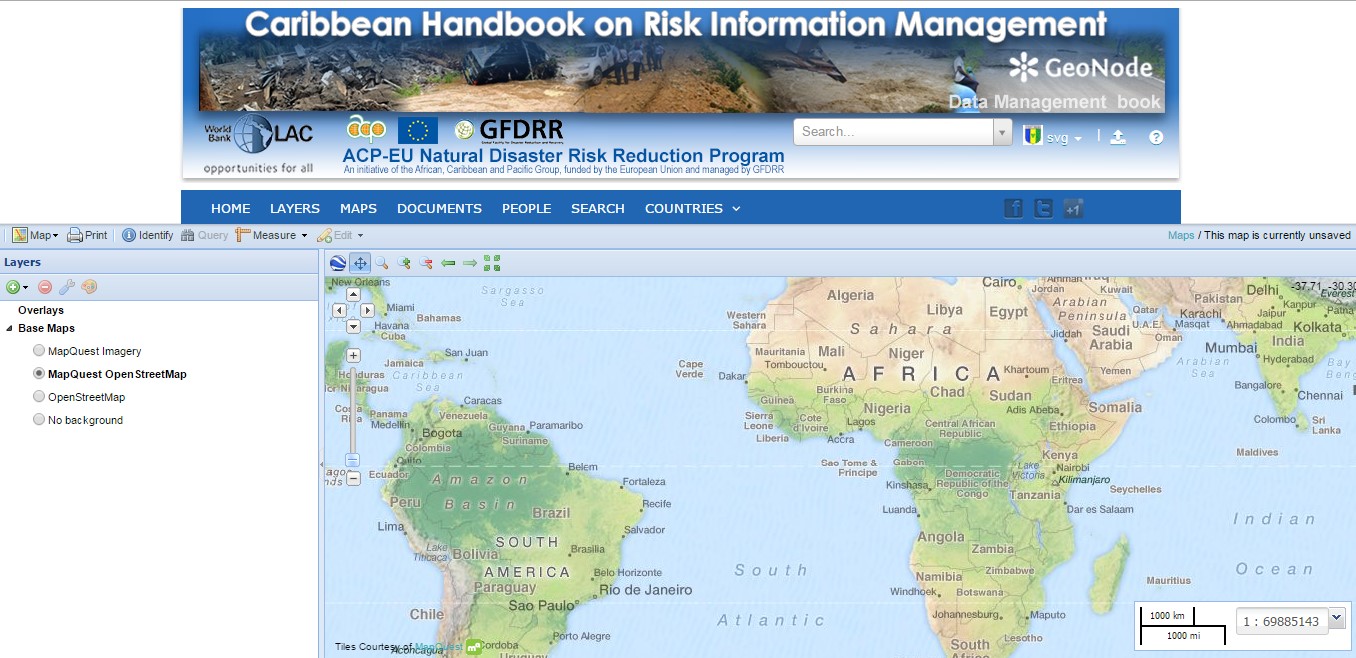
Figure 8 - GeoExplorer View
In this interface there is a toolbar, layer list, and map window. The map window contains the MapQuest OpenStreetMap layer by default. Other layers can be added by Add Data Layers icon as shown in figure 9.
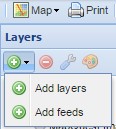
Figure 9 - Add Layers to Map
Now it is possible to see all the available layers to be used in the map (Figure 10). Select the layers you want to show on the map. Click Add Layers to add them all to the map. You may select multiple layers by pressing the CTRL key while selecting layers. Once you have added all the layers, press "Done".
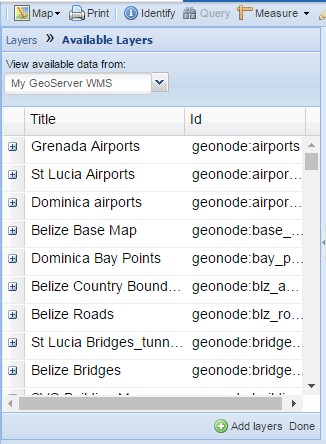
Figure 10 - Available Layers
Now it is possible to visualize all the selected data layers on the map. Pick the best suit base map from the base maps list and save the map.
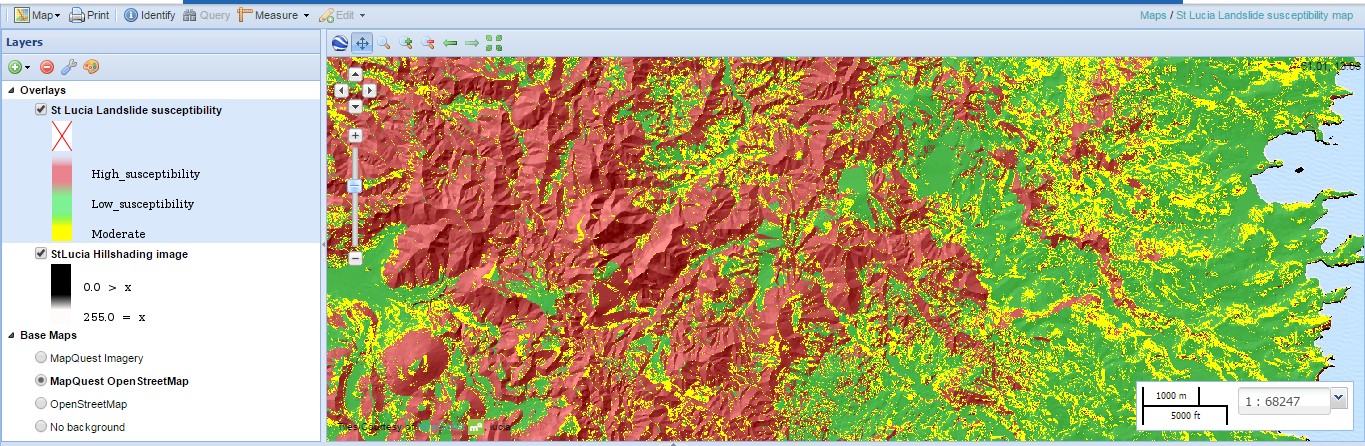
Figure 11 - Created Map
Once saved, the map will be added to the list of maps permanently.
References
- www.geonode.org
- https://en.wikipedia.org/wiki/Database
- http://docs.geoserver.org/stable/en/user/index.html
- http://docs.geoserver.org/stable/en/user/rest/api/
- http://www.postgresql.org/
- http://postgis.net/
- http://www.opengeospatial.org/docs/is