

This section gives an overview of the data requirements for landslide inventory, susceptibility, hazard and risk assessment at three relevant scales of analysis for the Caribbean island countries: National scale (1:50,000), Local scale ((1:10,000) and Site investigation scale (1:1,000).
Keywords:
Landslide, data, requirements, inventory, environmental factors, triggering factors, data quality.
|
Author |
Links to other sections |
|---|---|
|
Cees van Westen |
|
Introduction
Chapter 4 of the methodology book gives an overview of the methods that could be used for landslide susceptibility and hazard assessment for three relevant scales of analysis in the Caribbean island countries: National scale (1:50,000), Local scale ((1:10,000) and Site investigation scale (1:1,000). The analysis requires certain spatial data, that are collected using Remote Sensing, field data collection, and other means, and that are stored and analysed in Geographic Information Systems. Table 1 gives a schematic overview of the main spatial data layers required for landslide susceptibility, hazard and risk assessment. These can be subdivided into four groups: landslide inventory data, environmental factors, triggering factors, and elements at risk. Of these, the landslide inventory is by far the most important, as it should give insight into the location of landslide phenomena, the types, failure mechanisms, causal factors, frequency of occurrence, volumes and the damage that has been caused. Landslide inventory databases should display information on landslide activity, and therefore require multi-temporal landslide information over larger regions. For detailed mapping scales, activity analysis is often restricted to a single landslide and becomes more landslide monitoring. The environmental factors are a collection of data layers that are expected to have an effect on the occurrence of landslides, and can be utilized as causal factors in the prediction of future landslides.
Table 1: Schematic representation of basic data sets for landslide susceptibility, hazard and risk assessment. Left: indication of the main types of data, Middle: indication of the ideal update frequency, RS: column indicating the usefulness of Remote Sensing for the acquisition of the data, Scale: indication of the importance of the data layer at national, local and site investigation scales, related with the feasibility of obtaining the data at that particular scale, Hazard models: indication of the importance of the data set for heuristic models, statistical models, and physically-based models, (C= Critical dataset, H= highly important, M= moderately important, and L= Less important)
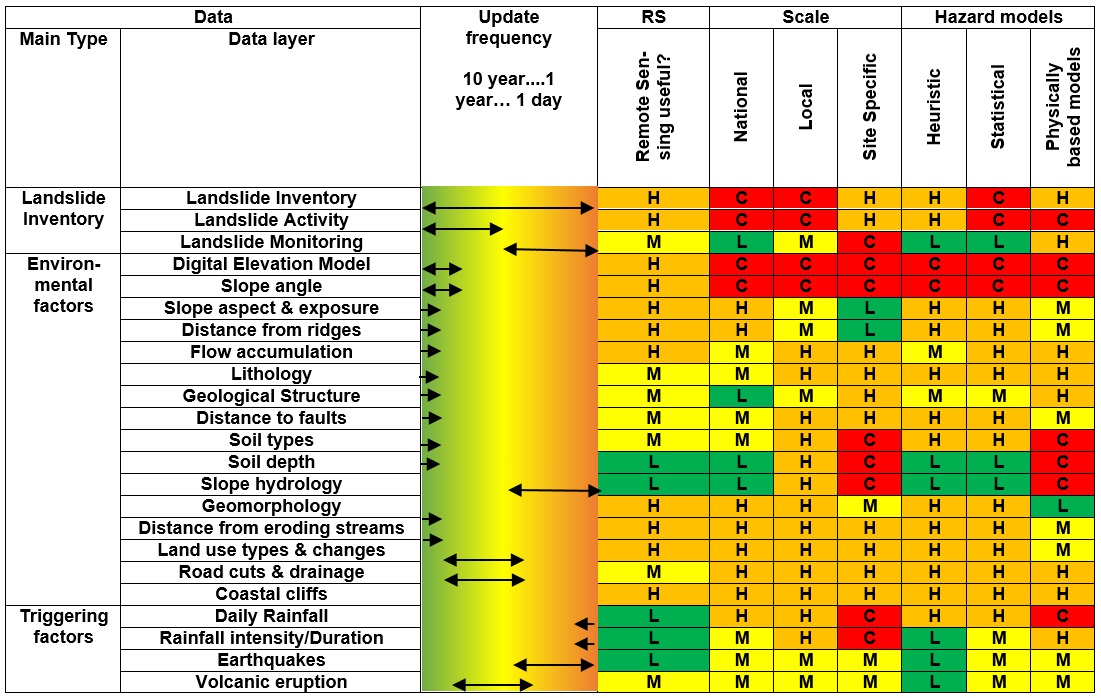
The list of environmental factors indicated in Table 1 is not exhaustive, and it is important to make a selection of the specific factors that are related to the landslide types and failure mechanisms in each particular environment. However, they do give an idea of the types of data included, related to morphometry, geology, soil types, hydrology, geomorphology and land use. It is not possible to give a prescribed uniform list of causal factors. The selection of causal factors differs, depending on the scale of analysis, the characteristics of the study area, the landslide type, and the failure mechanisms. Table 1 intends to provide a summary of this discussion. The basic data can be subdivided into those that are more or less static, and those that are dynamic and need to be updated regularly. Examples of static data sets are related to geology, soil types, geomorphology and morphography. The time frame for the updating of dynamic data may range from hours to days, for example for meteorological data and its effect on slope hydrology, to months and years for land use (see Table 1). Landslide information needs to be updated continuously, and land use and elements at risk data need to have an update frequency which may range from 1 to 10 years, depending on the dynamics of land use change in an area. Especially the land use information should be evaluated with care, as this is both an environmental factor, which determines the occurrence of new landslides, as well as an element at risk, which may be affected by landslides.
Table 1 also gives an indication of the extent to which remote sensing data can be utilized to generate the various data layers (based on Soeters and Van Westen, 1996, Metternicht et al., 2005, and SafeLand, 2010). For a number of data layers the main emphasis in data acquisition is on field mapping, field measurements or laboratory analysis, and remote sensing imagery is only of secondary importance. This is particularly the case for the geological, geomorphological, and soil data layers. The soil depth and slope hydrology information, which are very important in physical modeling of slope stability are also the most difficult to obtain, and remote sensing has not proven to be a very important tool for these. On the other hand, however, there are also data layers for which remote sensing data can be the main source of information. This is particularly so for landslide inventories, digital elevation models, and land use maps.
In the following sections an overview is given of the methods for spatial data collection. Most emphasis is given to landslide inventories, given their high importance, but also a number of aspects dealing with environmental factors, triggering factors and elements at risk will be discussed and illustrated.
Landslide inventory mapping
In order to make a reliable map that predicts the landslide hazard and risk in a certain area, it is crucial to have insight in the spatial and temporal frequency of landslides, and therefore each landslide hazard or risk study should start by making a landslide inventory that is as complete as possible in both space and time. Attempts have been made to standardize classification in nomenclature, activity, causes, rates of movement and remedial measures for landslides by the IAEG Commission on Landslides, UNESCO-WP/WLI, and the IUGS-Working group on Landslides (IAEG, 1990; IUGS, 1995, 2001; UNESCO, 1993a, 1993b. 1994)
Landslide inventories can be carried out using a variety of techniques, which are summarized in Table 2, focusing on the applicable methods in the Caribbean islands. For visual interpretation of landslides, stereoscopic imagery with a high to very high resolution is required (SafeLand, 2010). Optical images with resolutions larger than 10 meters (e.g. SPOT, LANDSAT, ASTER, SENTINEL-2, DMC), as well as SAR images (RADARSAT, ERS, JERS, ENVISAT) have proven to be useful for visual interpretation of large landslides in individual cases (Singhroy, 2005), but not for landslide mapping on the basis of landform analysis over large areas (Soeters and Van Westen, 1996; Metternicht et al., 2005; SafeLand, 2010). Traditionally, aerial photo interpretation has been the most used technique for landslide mapping (Cardinali et al. 2002). However, with the rapid development of new technologies this is starting to change. Very high resolution imagery (QuickBird, IKONOS, WorldView, GeoEye, EROS-B, CARTOSAT-1, CARTOSAT-2, ALOS-PRISM, GEOYE) has become the best option now for landslide mapping from satellite images, and the number of operational sensors with similar characteristics is growing year by year, as more countries are launching earth observation satellites with stereo capabilities and resolution of 3 meters or better. The high costs may still be a limitation for obtaining these very high resolution images for particular study areas, especially for multiple dates after the occurrence of main triggering events such as tropical storms or hurricanes. You can consult the ITC database on platforms and sensors to find out the various types of satellites and sensors with launching dates and characteristics. See also section 3.3 for more information on Remote Sensing.
Nowadays for many areas the use of Google Earth data is a good alternative and many parts of the world are covered by high resolution imagery which can be downloaded, and combined in GIS with a Digital Elevation Model to generate stereoscopic images, that are essential in landslide interpretation. Google Earth offers also an option to see historical imagery and to compare the same area for different time periods, thus allowing to map landslides from different time periods.
Another interesting development is the visual interpretation of landslide phenomena from shaded relief images produced from LiDAR DEMs, from which the objects on the earth surface have been removed; so called bare earth DEMs (Haugerud et al., 2003; Schulz, 2004). Also the combination of an Airborne Laser Scanner (ALS) and Terrestrial Laser Scanner (TLS) for the quantification of landslide volumes has been proven successfully. Terrestrial LiDAR measurements have also been successfully applied for the monitoring of individual landslides (Rosser et al., 2005). The use of shaded relief images of LiDAR DEMs also allows a much more detailed interpretation of the landslide mechanism as the deformation features within the large landslide are visible, and landslide can be mapped in heavily forested areas (Ardizzone et al., 2007; Van den Eeckhaut, 2007).
Many developments have taken place in the last decade related to methods for the automatic detection of landslides based on their spectral or altitude characteristics. Multi-spectral images such as SPOT, LANDSAT, ASTER and IRS-1D LISS3 have proven to be more applicable for landslide mapping based on image classification in conditions where landslides are fresh and unvegetated (Cheng, 2004, Nichol and Wong 2005). Image classification of multi-spectral images for landslide studies can be successful for identifying a large number of unvegetated scarps that have been produced during a single triggering event. However, practice has shown that the use of optical satellite imagery for multi-temporal landslide detection after major triggering events, especially in tropical areas, is often hampered by the persistent cloud cover in the affected area, which makes it difficult to obtain cloud-free images for a long period of time.
Image classification methods used for landslide mapping can be differentiated in pixel based and non-pixel based ones. Recent advances in computer vision and machine intelligence have led to the development of new techniques, such as object-oriented analysis (OOA) for automatic content extraction of both man-made and natural geospatial objects from remote sensing images (Akcay and Aksoy, 2008). OOA has the potential to accurately and meaningfully detect landslides by integrating the contextual information to image analysis, and thereby, reducing the time required for creation of landslide inventory for large areas (Martha et al., 2010). Also automatic detection of landslides using LiDAR derived DEMs have shown to be successful (Booth et al., 2009).
Many methods for landslide mapping make use of digital elevation models of the same area from two different periods. The subtraction of the DEMs allows visualizing where displacement due to landslides has taken place, and the quantification of displacement volumes. Satellite derived DEMS from SRTM, ASTER and SPOT do not provide sufficient accuracy to differentiate actual landslide movement from noise, when overlaying two DEMs from different dates. High resolution data from Quickbird, IKONOS, PRISM (ALOS) and CARTOSAT-1 are able to produce highly accurate digital elevation models that might be useful in automatic detection of large and moderately large landslides.
Interferometric Synthetic Aperture Radar (InSAR) has been used extensively for measuring surface displacements. Multi-temporal InSAR analyses using techniques such as the Permanent Scatterers (PSInSAR; Ferretti et al. 2001), PSP (Persistent Scatterers Pairs) and SBAS (Small Base-line Subset) can be used to measure displacement of permanent scatterers such as buildings with millimetre accuracy, and allow the reconstruction of the deformation history (Farina et al. 2008). However, in tropical environments with a lot of vegetation, these techniques are not so applicable due to the loss of coherence between images from different time. Also most of the landslides are rapid movements, whereas InSAR is best for monitoring slow movements.
It is very important to obtain imagery as soon as possible after the occurrence of a major triggering event, so that accurate event-based landslide maps can be made, which in turn will make it possible to derive landslide hazard maps, that relate the frequency of a triggering event to the landslide density caused by the event. Such event-based landslide inventory maps should be stored in a landslide database implemented in GIS.
Much progress has been made in the development of landslide databases at regional or national level. One of the first comprehensive projects for landslide and flood inventory mapping has been the AVI project in Italy (Guzzetti et al., 1994). There are good examples in the literature of the use of landslide inventories for hazard assessment (Guzzetti, 2000; Chau et al., 2004 ). However, the existing landslide databases often present several drawbacks (Ardizzone et al., 2002) related to the completeness in space and even more so in time, and the fact that they are biased to landslides that have affected infrastructures such as roads. Section 4.3 will show more information on landslide inventory mapping, and use case 9.3 shows an example of landslide inventory mapping for Dominica.
Table 2: Overview of techniques for the collection of landslide information. Indicated is the applicability of each technique for different mapping scales (N=National, L=Local and S=Site specific. (H= highly applicable, M= moderately applicable, and L= Less applicable)

Environmental Factors
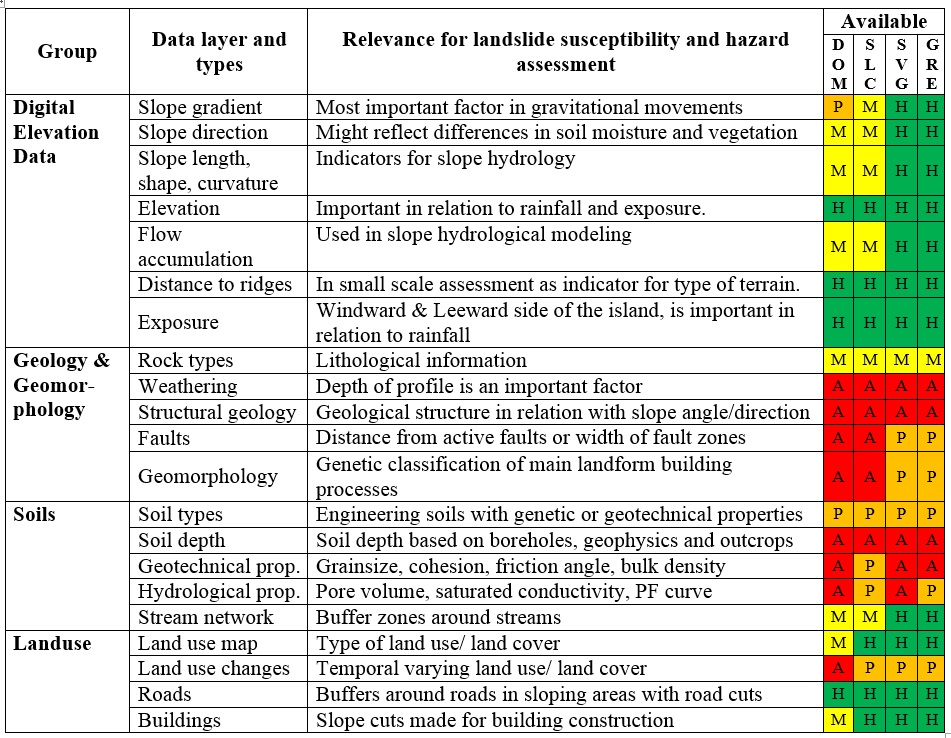
Table 3 provides more details on the relevance of the most important environmental factors for landslide susceptibility assessment. The selection of the environmental factors that are used in the susceptibility assessment is depending on the type of landslide, the failure mechanism, the type of terrain and the availability of existing data and resources. Often different combinations of environmental factors should be used, resulting in separate landslide susceptibility maps for each failure mechanism, and landslide type. For the Caribbean island it would be best to make separate maps for soil slides and rock slides.
As topography is one of the major factors in landslide hazard analysis, the generation of a Digital Elevation Model (DEM), plays a major role. Digital Elevation Models (DEMs) can be derived through a large variety of techniques, such as digitizing contours from existing topographic maps, topographic leveling, EDM (Electronic Distance Measurement), differential GPS measurements, (digital) photogrammetry, InSAR, and LiDAR. More information on Digital Elevation Models is given in section 3.2.
Many derivate maps can be produced from DEMs using fairly simple GIS operations. Derivatives from DEMs can be used in heuristic analysis at small scales (hillshading images for display as backdrop image, physiographic classification, internal relief, drainage density), in statistical analysis at regional scales (e.g. altitude zones, slope gradient, slope direction, contributing area, plan curvature, profile curvature, slope length), in physically-based modeling at local scales (local drain direction, flow path, slope gradient) and in landslide run out modeling (detailed slope morphology, flow path, rock fall movement). The use of slope gradient maps in landslide hazard assessment is greatly affected by the resolution of the DEM. The DEMS from the Windward Islands are quite different. Dominica has a DEM generated from much smoothed contour lines, of which the origin is not clear. Saint Lucia also has a poor quality DEM generated from photogrammetry, but due to limited numbers of measured points, many area have very limited elevation data. Saint Vincent and Grenada both have DEMs derived from LiDAR data, but certain parts are missing.
Traditionally, geological maps form a standard component in heuristic and statistical landslide hazard assessment methods. Mostly the stratigraphical legends of existing geological maps are converted into an engineering geological classification, which gives more information on the rock composition and rock mass strength. The subdivision of geological formations into meaningful mapping units of individual rock types often poses a problem, as the intercalations of these units cannot be properly mapped at these scales. In detailed hazard studies specific engineering geological maps are collected and rock types are characterized using field tests and laboratory measurements. For the Caribbean countries geological information is available at a rather general level. The geological maps were made for volcanic hazard purposes, and the complicated sequences of ignimbrites, lavas and block & ash flows are not separated. In detailed hazard studies specific engineering geological maps should be collected and rock types should be characterized using field tests and laboratory measurements. Also borehole information should be collected on a scale smaller than 1:5000, and its use is restricted to a site investigation level (e.g. Xie et al., 2003). Apart from lithological information structural information is very important for hazard assessment, however, such information is not available for any of the countries.
Table 3: Overview of environmental factors, and their availability and quality for landslide susceptibility and hazard assessment. DOM=Dominica, SLC=Saint Lucia, SVG=Saint Vincent, GRE=Grenada. (A= Absent, P = poor quality, M= moderate quality, and H= High quality)
In some countries attempts have been made to generate maps indicating dip direction and dip amount, based on field measurements, but the success of this depends very strongly on the amount of measurements and the complexity of the geological structure (Günther, 2003). Another option is to map the relation between slope gradient/slope direction and bedding slope/direction for individual slope facets. Fault information is also used frequently as one of the environmental factors in a statistical landslide hazard assessment. The use of wide buffer zones around faults, which is now the standard practice should be treated with caution, as this might be only true for active faults. In other cases a very narrow buffer zone should be taken, which is related to the zone where rocks are fractured. None of the islands has good fault maps. Within the project we generated fault maps for Saint Vincent and Grenada, where we could carry out image interpretation based on a hillshading image of the LiDAR derived DEMs. In terms of soil information required for landslide hazard assessment, there are basically two different thematic data layers needed: soil types, with associated geotechnical and hydrological properties, and soil sequences, with depth information. Table 4 gives an overview of the most important geotechnical, hydrological and vegetation characteristics required for modelling slope stability for soilslides, rock slides and reactivated landslides. Pedologic soil maps, normally only classify the soils based on the upper soil horizons, with rather complicated legends and are therefore less relevant in case of landslide deeper than 1-2 meters. Engineering soil maps describe all loose materials on top of the bedrock, and classify them according to the geotechnical characteristics. They are based on outcrops, borehole information and geophysical studies. Especially the soil depth is very difficult to map over large areas, as it may vary locally quite significantly. Soil thickness can be modeled using a correlation with topographic factors such as slope, or predicted from a process based model (Kuriakose et al., 2009). Given the fact that soil thickness is one of the most crucial factors in deterministic slope stability modeling, it is surprising that very limited work has been done on the modeling of soil thicknesses over larger areas. There are no engineering soil maps available for the four countries and the available pedologic soil maps are old (around 40 years) and generated within use of GIS or remote sensing, and therefore do not fit well with the rest of the data.
Table 4: Overview of geotechnical and hydrological parameters required for deterministic slope stability assessment
|
|
Soil slope stability: new failures |
Existing landslides |
Rock slope stability |
|---|---|---|---|
|
Geotechnical characteristics |
Soil types |
Material types |
Rock types |
|
Thickness and layering, depth to bedrock, paleo topography |
Thickness of shear surface, intermediate shear surfaces |
Weathering profile |
|
|
Particle size distribution, Plasticity (Atterberg limits) |
Movement history, displacement |
rock structure including orientation, occurrence and spacing of bedding, joints, faults and other discontinuities |
|
|
Soil density |
Density of landslide materials |
Rock density |
|
|
Shear strength (total and effective angle of internal friction and cohesion) |
Residual shear strength |
Uniaxial compressive Strength, shear strength along discontinuities |
|
|
Hydrological characteristics |
Ground water level fluctuations |
Ground water level fluctuations |
Ground water level fluctuations |
|
Saturated conductivity, initial moisture content, infiltration capacity, soil retention curves |
Saturated conductivity, initial moisture content, infiltration capacity, soil retention curves |
Permeability |
|
|
Vegetation Characteristics |
Vegetation type, surcharge |
Vegetation type, surcharge |
Vegetation type, surcharge |
|
Rooting depth, rooting density, root cohesion |
Rooting depth, rooting density, root cohesion |
Rooting depth, rooting density, root cohesion |
|
|
Canopy storage, through fall ratio, evapotranspiration |
Canopy storage, through fall ratio, evapotranspiration |
Canopy storage, through fall ratio, evapotranspiration |
Geomorphological maps are made at various scales to show land units based on their shape, material, processes and genesis. There is no generally accepted legend for geomorphological maps, and there may be a large variation in contents based on the experience of the geomorphologist. An important field within geomorphology is the quantitative analysis of terrain forms from DEMs, called geomorphometry or digital terrain analysis, which combines elements from earth sciences, engineering, mathematics, statistics and computer science (Pike, 2000). Part of the work focuses on the automatic classification of geomorphological land units based on morphometric characteristics at small scales (Asselen and Seijmonsbergen, 2006) or on the extraction of slope facets at medium scales which can be used as the basic mapping units in statistical analysis. In most of the statistical methods the analysis is carried out for a number of basic mapping units, that can be either grid cells, slope facets that are derived from DEMs or unique conditions units which are made by overlaying a number of landslide preparatory factors, such as lithology, land cover, slope gradient, slope curvature and upslope contributing area (Cardinali et al., 2002). We generated Geomorphological maps for Saint Vincent and Grenada through image interpretation of LiDAR hillshading images. The other countries didn't have geomorphological maps.
Landuse is too often considered as a static factor in landslide hazard studies, and few researches involve constantly changing land use as a factor in the analysis (Van Beek and Van Asch, 2004). Changes in land cover and land use resulting from human activities, such as deforestation, forest logging, road construction, fire and cultivation on steep slopes can have an important impact on landslide activity. For dynamic physically-based modelling of slope stability it is very important to have temporal landuse/landcover maps and the respective changes manifested in the mechanical and hydrological effects of vegetation. Land use maps are made on a routine basis from medium resolution satellite imagery such as LANDSAT, SPOT, ASTER, IRS1-D, etc. Although change detection techniques such as post-classification comparison, temporal image differencing, temporal image ratioing, or Bayesian probabilistic methods have been widely applied in land use applications, fairly limited work has been done on the inclusion of multi- temporal land use change maps in landslide hazard studies. The landuse maps for the four countries are all derived from image classification using high resolution images. For Grenada, Saint Vincent and Saint Lucia the landuse maps were generated using Pleiades images by the British Geological Survey. See also use section 3.4 of the data management book, and use case 7.3.
Triggering Factors
Information related to triggering factors generally has both temporal and spatial importance. The availability of historical rainfall information is crucial for analysing frequency of rainfall characteristics. But also the spatial rainfall distribution is very important as the Windward Island display clear relations between altitude, exposure and rainfall amounts (See methodology chapter 2 on analysing triggers). Data related to rainfall, temperature and earthquake records over sufficiently large time periods are essential for the assessment of magnitude-frequency relations. Rainfall and temperature data are measured in individual meteorological stations, and earthquake data is normally available as earthquake catalogs. The spatial variation over the study area can be represented by interpolating the point data, provided that enough measurement data is available. For example a map of the maximum expected rainfall in 24 hours for different return periods can be generated as the input in dynamic slope stability modeling. In the case of earthquake triggered landslides a map of the peak ground acceleration (PGA) could be used as input in subsequent infinite slope modeling. The use of weather radar for rainfall prediction in landslide studies is a field which is very promising (e.g. Crosta and Frattini, 2003). Generally the availability of rainfall data is not very good for the Windward Islands like Dominica, Saint Lucia, Saint Vincent and Grenada. As will be explained more in detail in section 4.1 there are still many improvements to be made in relation to the set-up of the networks for raingauges and discharge stations.
Quality of the Input Data
The occurrence of landslides is governed by complex interrelationships between factors, some of which cannot be determined in detail and others only with a large degree of uncertainty. Some important aspects in this respect are: the error, accuracy, uncertainty and precision of the input data and the objectivity and reproducibility of the input maps.
The accuracy of input data refers to the degree of closeness of the measured or mapped values or classes of a map to its actual (true) value or class in the field. An error is defined as the difference between the mapped values or classes and the ones. The precision of a measurement is the degree to which repeated measurements under unchanged conditions show the same results. Uncertainty refers to the degree with which the actual characteristics of the terrain can be represented spatially in a map. The sources of errors, which may occur in the generaton of input data for landslide hazard and risk analysis are schematically represented in table 5.
The error in a map can be assessed only if another map, or field information is available which is error-free, and with which it can be verified. Slope angles, for example, can be measured at several points in the terrain, and these point values can be compared with a slope map derived from a DEM to assess the degree of error. This evaluation is different for maps which are not based on factual, measured data, but on interpretation, such as the genetic elements of a geomorphological map. Such a map can also be checked in the field, but it is still possible that different geomorphologists will not agree on the specific origin of a certain landform. For maps based on interpretation, only the uncertainty of the map can be assessed, by comparison of different maps by different observers. This method will only render reliable result if the field experience of the observers, and the mapping method is identically. Therefore, the actual uncertainty of such maps is difficult to determine in an absolute manner.
Table 5: Main sources of uncertainty of input data for landslide hazard and risk assessment
|
Group |
Type |
Example |
|---|---|---|
|
Source data |
Use of data from different sources that have not been checked in the field |
Use of fault and lineament maps derived from different organisations |
|
Use of input data with different map scales |
Combination of 1:100.000 lithological map with a 1:10.000 topomap |
|
|
Inappropriate scale of the source data |
DEMs with high resolution derived from topographic maps with 50 m contour interval |
|
|
Geometric (positional) errors in the source data |
Use of data with inaccurate coordinate systems |
|
|
Semantic errors in the compilation of maps |
Use of wrongly classified landslide inventory maps |
|
|
Temporal errors in the compilation of maps |
Use of outdated landuse maps |
|
|
Availability of incomplete data sets |
Use of incomplete historical landslide inventories, or rainfall records |
|
|
Image analysis |
Non availability of imagery from right period |
Images from suitable period after the occurrence of a major triggering event |
|
Non availability of imagery of the right type |
Cloud cover in optical imagery that prevents mapping of phenomena |
|
|
Inexperience of image interpreter |
Not enough experience to map landslides, or other thematic information |
|
|
Too limited time for image interpretation |
The study area os too large, and time for interpretation limited |
|
|
Inaccuracies due to the vague ("fuzzy") character of natural boundaries. |
Changes between landuse types that have a gradual change |
|
|
Too much dependency on automated techniques |
Generalization of rule sets used in image classification |
|
|
Field data collection and map generation |
Too limited time for field checking |
Not enough fieldwork for landslide mapping and characterisation |
|
Spatial variation of data which cannot be represented |
Lithological differences relevant to landslide occurrence that cannot be mapped at scale |
|
|
Uncertainty on subsurface conditions |
Soil depth variations over larger areas are very difficult to model |
|
|
Lack of sufficient samples to represent spatial characteristics |
Characterization of spatial variation of geotechnical characteristics |
|
|
Lack of sufficiently long period of measurement |
Groundwater fluctuations in relation to major events ar onot recorded in project period. |
|
|
Lack of spatial units to link samples to |
Characterization of elements at risk data to homogeneous units |
|
|
GIS Processing |
Errors in data entry |
Digitizing errors, or errors in matching sptail and attribute data |
|
Errors in data storage |
Errors due to the limited precision |
|
|
Errors in data analysis and manipulation |
Errors in the conversion of data, errors in generating derivative maps. |
|
|
Errors in data output and application |
Wrong legends, colour usage, combination with topographic data |
Some of the factors with the highest degree of uncertainty are:
- Detailed geotechnical information, as well as information on soil thickness, groundwater, rock structure and seismic acceleration can only be obtained for relative small areas, and at large scale. This is because a large amount of data points are required in order to be able to model the spatial variation of these phenomena.
- Those maps in which image interpretation plays an important role, and in which the quality of the product depends largely on the experience of the interpreter, will produce the greatest inconsistencies. These maps will be quite erroneous if not based on thorough field checks (Fookes et al., 1991).
- The landslide inventory map is the most important data layer, since this contains information on the locations where landslides have actually taken place. For each landslide information should be stored related to the type of landslide, the state of activity, and (if possible) the date of occurrence and damage caused
Conclusions and Recommendations
We have identified multiple issues related to geospatial information in the region present a considerable challenge to detailed hazard and risk assessments. The following points have been outlined:
- Poor quality of geospatial data: countries such as Dominica or St. Lucia lack detailed DEMs. The generation of a national LiDAR-based survey would enable improvement of many of the above mentioned deficiencies. Topographic data would greatly improve when it is based on LiDAR data, allowing generation of a so-called bare-surface model of the terrain, even under dense vegetation, provided that the density of LiDAR points during the survey is high enough. A detailed bare-surface model would allow for interpretation of geomorphological evidence of old landslides, and other relevant geological and geomorphological features much better (Razak et al., 2013). DEM derivatives such as slope steepness, slope direction, local drain direction, flow accumulation, slope convexity and slope length would be much more accurate than they are now. LiDAR-derived DEMs are also essential for other applications, such as for flood hazard assessment, where very local topographic differences are important, and also for many other application related to hazard and risk assessment, forestry, agriculture, and tourism. LiDAR data would also allow to generate building footprint maps in an automatic way, and would also allow to record building heights, which are very useful for exposure and risk assessment, but also for a large number of other planning and management activities related to housing, schooling, shelter planning, health, social aspects etc. And LiDAR survey would also allow to generate an improved landuse map, in combination with the optical images that are normally collected simultaneously with a LiDAR survey. Vegetation characteristics (height of vegetation, density etc.) can be derived from LiDAR data.
- Thematic maps required for landslide susceptibility assessment, such as geological, geomorphological and soil maps should be updated based on new technologies, and focusing on engineering descriptions which can be used for landslide modelling. The available soil maps were made a long time ago without the new technology that is now available. The available maps also focus on pedologic soils, which makes them less useful for landslide applications, where we are more interested in engineering soils and their characteristics. The existing geological maps focus on the description of the age and origin of the rocks rather than on their engineering characteristics. Therefore there is a need to generate an engineering geological map for each country that would describe engineering soil and rock types. Engineering soils need to be described with respect to their origin (e.g. weathering soil, colluvial soil, alluvial etc.), grainsize composition, depth, geotechnical characteristics (soil strength, atterberg limits etc.) and hydrological characteristics (infiltration capacity, hydraulic conductivity, pore space etc.). Engineering rock types should focus on their lithology, depth of weathering zones, and geotechnical characteristics (rock strength, discontinuities etc.) (Chacon et al., 2006).
- In terms of hazard and risk information, there is almost no risk information available, and the hazard information is often little detailed and with low precision due to missing or low quality input and lack of data availability for calibration. This is indeed a major problem, as the countries have at most susceptibility maps with qualitative classes, and lack appropriate quantifications of the hazards. This is turn is related to the lack of good disaster database combined with rainfall data.
- Incomplete data set and time series: Hydro-meteorological time series, which only exist for a few places, often display long measurement interruptions. Furthermore, they may not be digitized but handwritten in books; data has been traditionally collected manually and only exists on paper, particularly historical data. This is currently being addressed in the Disaster Vulnerability Reduction Projects in the various countries, but for our project this will be a major problem.
- Unavailable collected geospatial data: Although consultants may have collected basic data to carry out analyses for their studies, neither these data nor the results (e.g., hazard maps and risk information) are available. In many cases, the data got lost over time and people are hardly aware of their existence anymore. The intent to recover such data is rarely successful since the donors having funded these activities often don't received the data or forgot to request, and the consultants are hesitant, if they still have the data, to share it without additional payments. We encountered this problem especially for the hazard maps related to flooding and landslides. We hope that the work carried out in the CHARIM project will have contributed to the better storage of these data through the Geonode portal.
- Lack of data sharing: Even if data exists and is available, tracing and collecting these data from the different ministries becomes a large effort. Often no data-sharing policies are in place and the data has to be bought, or internal discussions on the possibility of sharing have to take place before the data can be handed over. Data inventories of past events, if they exist, are scattered and may not be easily reconciled. We hope that the work carried out in the CHARIM project will have contributed to the better storage of these data through the Geonode portal.
- Lack of metadata: Once data has been received or found, still the lack of metadata may impede its adequate use since the author may be unknown and no information on the quality of the input data, purpose of the study and the methodology used may be available. This is specifically challenging in the framework of hazard and risk information when the reports pertaining to the geospatial files are missing or too limited in their explanation of the modeling process. We hope that the work carried out in the CHARIM project will have contributed to the better storage of these data through the Geonode portal.
Through several operations, countries are working together with International partners to address these issues and improve data availability and management. The products generated through this project will become good practice examples of data management for the beneficiary countries.
References
Akcay, H.G., Aksoy, S. (2008). Automatic detection of geospatial objects using multiple hierarchical segmentations. IEEE Transactions on Geoscience and Remote Sensing 46, 2097-2111.
Ardizzone, F., Cardinali, M., Carrara, A., Guzzetti, F., Reichenbach, P. (2002). Impact of mapping errors on the reliability of landslide hazard maps. Natural Hazards and Earth System Sciences 2, 3-14.
Ardizzone, F. Cardinali, M., Galli, M., Guzzetti, F., and P. Reichenbach (2007). Identification and mapping of recent rainfall-induced landslides using elevation data collected by airborne Lidar. Nat. Hazards Earth Syst. Sci., 7, pp. 637-650.
Asselen, S.V., Seijmonsbergen, A.C. (2006). Expert-driven semi-automated geomorphological mapping for a mountainous area using a laser DTM. Geomorphology 78 (3-4), 309-320.
Booth, A.M., Roering, J. and Perron, J.T. (2009). Automated landslide mapping using spectral analysis and high-resolution topographic data: Puget Sound lowlands, Washington, and Portland Hills, Oregon. Geomorphology 100, 132-147.
Cardinali, M., Reichenbach, P. Guzzetti, F., Ardizzone, F., Antonini, G., Galli., Cacciano, M., Castellani, M., Salvati, P. ( 2002). A geomorphological approach to the estimation of landslide hazards and risks in Umbria, Central Italy. Natural Hazards and Earth System Sciences 2, 57-72.
Carrara, A., Cardinali, M. and Guzetti, F. (1992). Uncertainty in assessing landslide hazard and risk. ITC-Journal 1992-2: 172-183.
Chau, K.T., Sze, Y.L., Fung, M.K., Wong, W.Y., Fong, E.L., Chan, L.C.P., (2004). Landslide hazard analysis for Hong Kong using landslide inventory and GIS. Computers & Geosciences 30 (4), 429-443.
Cheng, K.S., Wei, C., Chang, S.C. (2004). Locating landslides using multi-temporal satellite images. Advances in Space Research 33 (3), 296-301.
Crosta G.B., Frattini P. (2003) Distributed modelling of shallow landslides triggered by intense rainfall. Natural Hazards And Earth System Sciences NHESS, European Geophysical Society, vol. 3, 1-2, pp. 81-93 ISSN 1561-8633.
Farina, P., Casagli, N., & Ferretti, A. (2008). Radar-interpretation of InSAR measurements for landslide investigations in civil protection practices. Proc. 1st North American Landslide Conference, Vail, Colorado. 272-283
Ferretti, A., Prati, C., Rocca, F. (2001). Permanent scatterers in SAR interferometry. IEEE Transactions on Geoscience and Remote Sensing 39 (1), 8-20.
Fookes, P. G., Dale, S. G., and Land, J. M. (1991). Some observations on a comparitive aerial photography interpretation of a landslipped area, Quarterly Journal of Engineering Geology 24, 249–265
Günther, A., (2003). SLOPEMAP: programs for automated mapping of geometrical and kinematical properties of hard rock hill slopes. Computers and Geoscience 865-875
Guzzetti, F., Cardinali, M., Reichenbach, P. (1994). The AVI project: a bibliographical and archive inventory of landslides and floods in Italy. Environmental Management 18 (4), 623-633.
Guzzetti, F. (2000). Landslide fatalities and the evaluation of landslide risk in Italy. Engineering Geology 58 (2), 89-107.
Haugerud, R.A., Harding, D.J., Johnson, S.Y., Harless, J.L., Weaver, C.S., Sherrod, B.L. (2003). High-resolution LiDAR topography of the Puget Lowland, Washington - A bonanza for earth science. GSA Today 13, 4-10.
IAEG-Commission on Landslides (1990). Suggested nomenclature for landslides. Bulletin of the International Association of Engineering Geology 41, 13-16.
IUGS-Working group on landslide (1995). A suggested method for describing the rate of movement of a landslide. Bulletin of the International Association of Engineering Geology 52, 75-78.
IUGS-Working group on landslide (2001). A suggested method for reporting landslide remedial measures. Bulletin of Engineering Geology and Environment 60, 69-74.
Kuriakose, S.L., Devkota, S., Rossiter,D.G. and Jetten, V.J. (2009). Prediction of soil depth using environmental variables in an anthropogenic landscape, a case study in the Western Ghats of Kerala, India. Catena, 79(1), 27-38.
Martha, T.R., Kerle, N., Jetten, V., van Westen, C.J. and Kumar, K.V. (2010) Characterising spectral, spatial and morphometric properties of landslides for semi - automatic detection using object - oriented methods. Geomorphology, 116 (1-2), 24-36
Metternicht, G., Hurni, L., Gogu, R. (2005). Remote sensing of landslides: An analysis of the potential contribution to geo-spatial systems for hazard assessment in mountainous environments. Remote Sensing of Environment 98 (2¬3), 284-303.
Nichol, J., Wong, M.S., 2005. Satellite remote sensing for detailed landslide inventories using change detection and image fusion. International Journal of Remote Sensing 26 (9), 1913-1926.
Pike, R.J., 2000. Geomorphometry - diversity in quantitative surface analysis. Progress in Physical Geography 24 (1), 1-20
Rosser, N.J., Petley, D.N., Lim, M., Dunning, S. A., Allison, R.J., (2005). Terrestrial laser scanning for monitoring the process of hard rock coastal cliff erosion. Quarterly Journal of Engineering Geology and Hydrogeology, 38(4), 363-375.
SafeLand deliverable 4.1, (2010). Review of Techniques for Landslide Detection, Fast Characterization, Rapid Mapping and Long-Term Monitoring. Edited for the SafeLand European project by Michoud C., Abellán A., Derron M.-H. and Jaboyedoff M. Available at http://www.safeland-fp7.eu
Schulz, W.H. (2004). Landslides mapped using LiDAR imagery, Seattle, Washington. U.S. Geological Survey Open-File Report 2004-1396.
Singhroy, V., 2005. Remote sensing of landslides. In: Glade, T., Anderson, M., and Crozier, M.J., (Eds.), Landslide Hazard and Risk. John Wiley and Sons Ltd., West Sussex, England, pp. 469-492.
Soeters, R., Van Westen, C.J. (1996). Slope instability recognition, analysis and zonation. In: Turner, A.K., Schuster, R.L., (Eds.), Landslides, Investigation and Mitigation. Transportation Research Board, National Research Council, Special Report 247, National Academy Press, Washington D.C., U.S.A., pp. 129-177.
UNESCO-WP/WLI, (1993a). Multilingual Landslide Glossary. Bitech Publishers Ltd., Richmond, Canada, 34 pp.
UNESCO-WP/WLI, (1993b). A suggested method for describing the activity of a landslide. Bulletin of the International Association of Engineering Geology 47, 53-57.
UNESCO-WP/WLI, (1994). A suggested method for reporting landslide causes. Bulletin of the International Association of Engineering Geology 50, 71-74.
Van Beek, L.P.H., Van Asch, T.W.J. (2004). Regional assessment of the effects of land-use change and landslide hazard by means of physically based modeling. Natural Hazards 30 (3), 289-304
Van Den Eeckhaut, M., Poesen, J., Verstraeten, G., Vanacker, V., Nyssen, J., Moeyersons, J., Van Beek, L.P.H., Vandekerckhove, L., (2007). The use of LIDAR-derived images for mapping old landslides under forest. Earth surface processes and landforms 32, 754-769.
Xie, M., Tetsuro, E., Zhou, G., Mitani, Y., (2003). Geographic Information Systems based three-dimensional critical slope stability analysis and landslide hazard assessment. Journal of Geotechnical and Geoenvironmental Engineering 129 (12), 1109-1118