

Building damage is one of the most critical threats to the unplanned cities of the developing world. The area and intensity of damage, and the type of damage are essential information for successful response and reconstruction efforts. Post-disaster damage assessment from remote sensing images are being used from government organizations and international agencies to insurance industries. Main objects of interest in such efforts are buildings, as their destruction directly impacts lives and livelihoods.
Visual interpretation and change detection using both pre- and post-disaster remote sensing images are the most commonly used methods for building damage assessment. Change detection approaches identify the differences in the state of a building by observing it at different times. The image enhancement method deploys mathematical operations to combine different temporal images such as subtraction of bands, rationing, and image regression to identify changed areas. Change detection using both pre- and post-earthquake remote sensing data can be done by using 1) optical data, 2) SAR data, 3) LiDAR data, 4) combinations of optical and SAR data and 5) ancillary data and maps.
Diverse success rates are reported for building damage detection and the range varies from about 70% to over 90%, depending on the availability and quality of the data. Usually a higher successful rate can be achieved when both pre and post-event good quality data are available. Visual interpretation remains to be the most reliable methods, especially for the determination of a lower damage grade.
Use case intended for: Spatial analist
Keywords:
High Resolution Satellite Images, Visual Interpretation, Change Detection
| Before you start: | Use case Location: | Uses GIS data: | Authors: |
|---|---|---|---|
| Fundamentals of Remote Sensing: https://arset.gsfc.nasa.gov/webinars/fundamentals-remote-sensing |
Haiti (Greater Antilles) |
High resolution images (optical and/or radar) |
Dr. Manzul Kumar Hazarika and Dr. Firman Hadi |
Introduction:
The Caribbean region is exposed to a wide range of such hazards as hurricanes, floods, earthquakes, volcanic eruptions, landslides and droughts. Almost every major city in the region has been devastated in the last 300 years by one of these natural disasters, especially three of the worst; hurricanes, volcanic eruptions and earthquakes. These disasters have caused an estimated 226,000 fatalities over the last 30 years in the Latin American and Caribbean region.
During the period from 1910 to 1930, the north Atlantic hurricanes averaged 3.5 per year, which increased to an average of 6.0 per year between 1944 and 1980. Since 1960 a slight decrease in frequency has been observed, but intensities and magnitude have increased significantly. Some of the most severe hurricanes of the century have been experienced in this period and include David as well as Frederick (1979), Allen (1980) and Gilbert (1988). In the 110 years between 1871 and 1980, 119 hurricanes traversed the eastern Caribbean.
Earthquakes have been a persistent natural hazard resulting in disasters at various times in the region. Fatalities and great losses of property have reported form these earthquakes. During the period of 2001-2011, earthquakes caused 60% of total disaster-related mortality, approximately 780,000 (Dong and Shan, 2013). While not as recurrent as hurricanes, earthquakes do pose a serious threat to the Caribbean region. The most recent earthquake in the region struck Haiti with 7.0 magnitude caused 200,00 death and over one million displaced people was happened on 12 January 2010.
The use of satellite images for the assessment of the aftermath of disasters has been one of the most important aspects of disaster assessment and management (Saito and Spence 2004, Al-Khudhairy et al. 2005, Yamazaki et al. 2005). Recent studies have reported that high-resolution satellite images can be used to detect post-seismic building damage (Yonezawa and Takeuchi, 2001; Matsuoka and Yamazaki, 2004, 2005; Gamba et al., 2007) owing to its large coverage and relatively low cost, short revisit time, adaptable stereo imaging capability, and high (and rapidly increasing) spatial resolution (Tong et al., 2009 and 2012).
Objectives:
The objective of this Use Case is to describe the method for using high resolution images for building damage assessment from natural disaster like hurricanes and earthquakes.
Flowchart:
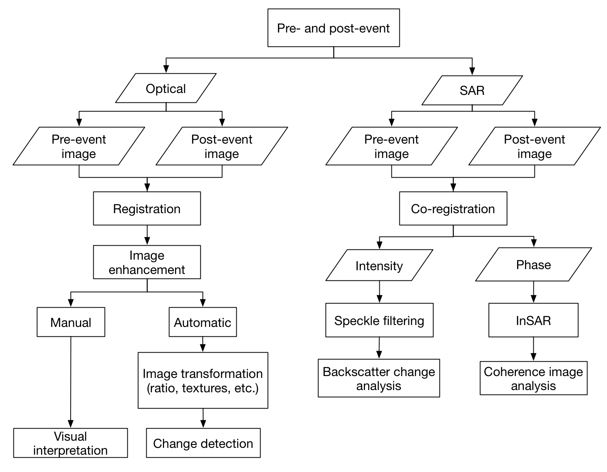
Image processing flowchart if both Pre- and post-event data are available
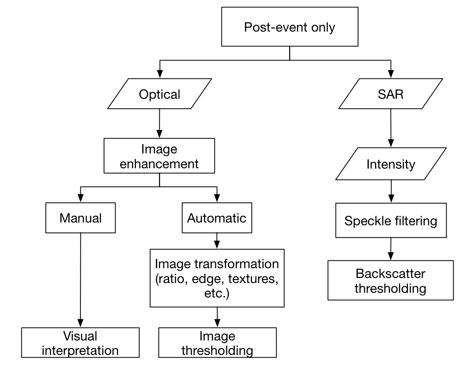
Image processing flowchart if only the post-even data are available
Problems definition and specifications:
The main challenge in damage assessment using remote sensing images is the time elapses between the disaster event and the good quality satellite images are acquired for making useful value-added maps. Depending on the types of data acquired and types of disasters, a number of different approaches for damage assessment could be employed. Hurricanes, floods and landslides usually happen during extreme weather conditions and in such cases optical images are difficult to get acquired due to cloud and rain. Microwave remote sensing data are preferable for the damage caused by the hydro-meteorological hazards. With the all-weather as well as day and night imaging capabilities, microwave remote sensing offers a great possibility for flood mapping during a disaster event, especially in non-urban areas. Optical remote sensing images can be acquired when the sky gets cleared, usually after a week or so.
Data requirements:
Optical images with spatial resolution finer than one meter are useful for building damage assessment and such data can be acquired by both space-borne and air-borne sensors. Some of these remote sensing sensors have existed for over ten years and have imaged large parts of Earth and over the past decade, the value of optical remote sensing images for building damage assessment have been increasingly recognized.
Visual interpretation of such high-resolution images is easiest way for building damage assessment and good quality high-resolution images before and after a disaster are sufficient for carrying out the visual interpretation.
Change detection using both pre- and post-disaster remote sensing data is another most commonly used method to study the building damage assessment. Change detection approaches identify the differences in the state of a building before and after a disaster using pre- and post-disaster images. The increased availability of this type of imagery and the frequently updated image archives make the high-resolution optical images well-suited as a pre-event reference data source for building damage assessment. Table 9.4.1 shows the suitability of pre- and post-event images for building damage assessment.
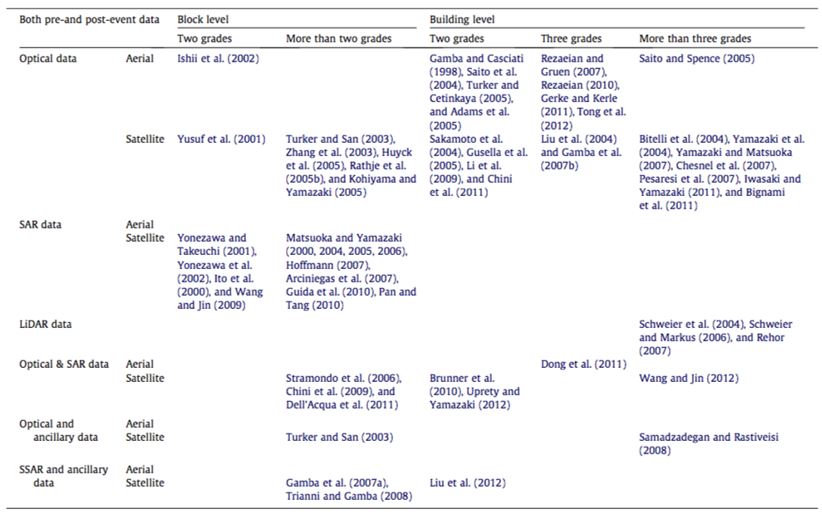
Table 1: Suitability of pre- and post-event images for building damage assessment. Source: Dong and Shan, 2013
Analysis steps:
Visual interpretation - is a widely used in practice for building damage detection. Generally, good results at the building level can be obtained by visual interpretation but it is time-consuming, requires trained operators, and generates a heavy workload, making it unsuitable for rapid damage assessment over an extensive area.
Change detection - methods that detect changes between pre- and post-event images. Pre-requisite of change detection is that images are acquired before and after in same geometry and wavelength, and are well co-registered. Change detection can be implemented by using shape analysis, brightness value comparison, image differencing by thresholding the color difference etc.. The differences between color, spectra, texture, and other features extracted from the registered images can also be used to discriminate damaged and undamaged buildings. Automatic change detection using images acquired before and after a disaster is faster than visual interpretation.
Results:
Visual interpretation
Collapsed buildings are often observed as being much brighter than the surrounding buildings and in many cases, have rough textures. Changes in relative shadow heights may indicate possible soft-story failures or “pancaking.†This type of damages occurs in case of earthquakes when the bottom or lower story of a building is softer (i.e., less stiff) than the uppers stories and thus collapses completely. Examples of some of these failures are viewed in Google Earth as presented in Figure 1 and Figure 2 below.
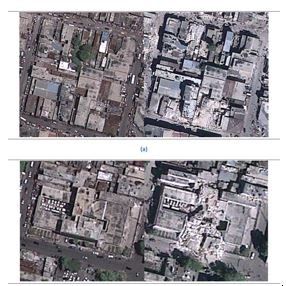
Figure 1: Examples of collapsed buildings as viewed in High-Resolution Imagery (50 cm) in Google Earth; pre-event imagery is shown in above and post-event imagery in below
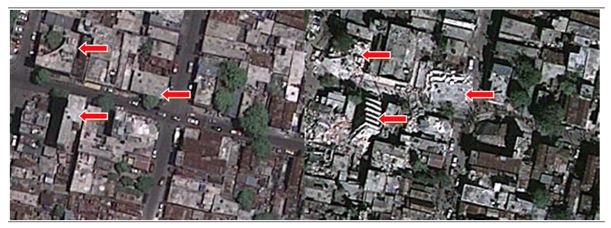
Figure 2: Pre-(left) and Post-event (right) imagery of "Pancaked" and "Stair-step" damage patterns
Change detection
In order to develop a methodology detecting damaged buildings from satellite images, the characteristics of the damaged areas in the high-resolution satellite images required to be examined before and after a disaster. Miura et al. (2012) had examined the pre- and post earthquake images of 2010 Haiti earthquake as shown in Figure 3. There is no difference between the images in the G1 building. Similarly in the G3 building, significant changes on the roof and its surroundings between the images couldn’t be found. Some part of the G4 building was damaged and debris around the building could be identified. The difference of the G4 building roof itself between the images is almost indiscernible. In case of G5-building, on the contrary, the roofs were completely destroyed and the debris produced from the collapsed building materials were scattered in and around the building, indicating that it is feasible to identify the collapsed buildings from the images. When the details of the images in the G5 buildings are carefully examined, the building edges were clearly identified and the homogeneous pixels were found on the roofs in the pre-event image. In the post-event image, on the other hand, the bright pixels and dark pixels were densely neighbored each other in the debris area. Since such image change can be analyzed by the image texture, the texture analysis was applied to the images for detecting the collapsed buildings.
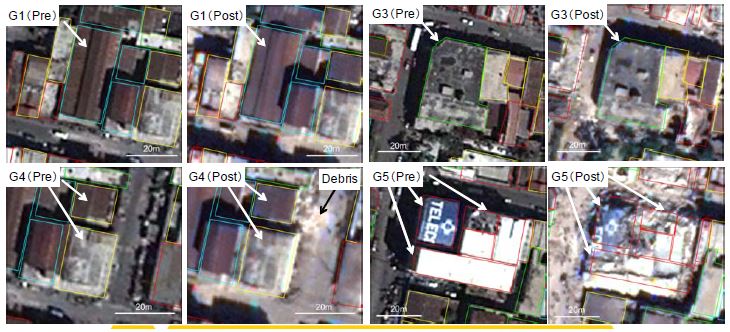
Figure 3: Building damage grade
Figure 4 shows the analysis carried out in Building G5. Image texture in and around the collapsed buildings was significantly roughed in the post-event image due to the debris produced from the buildings was observed. The UNI, ENT, CON and DIS represent uniformity, entropy, contrast and dissimilarity of the image, respectively. When the homogeneous pixels are concentrated, the image shows larger UNI. When bright pixels and dark pixels are dispersed, the image shows larger ENT. When the bright pixels and dark pixels are neighbored each other, the image shows larger CON and DIS. From the image texture analysis based on the gray level co-occurrence matrix, the DIS (dissimilarity), was identified as better classifier in detecting the collapsed buildings. It was found that the combination of the post-event DIS and the difference of DIS between the pre- and post-event images could provide more accurate result of the damage detection. The result showed that about 70% of the collapsed and less-damaged buildings were correctly classified by this method.
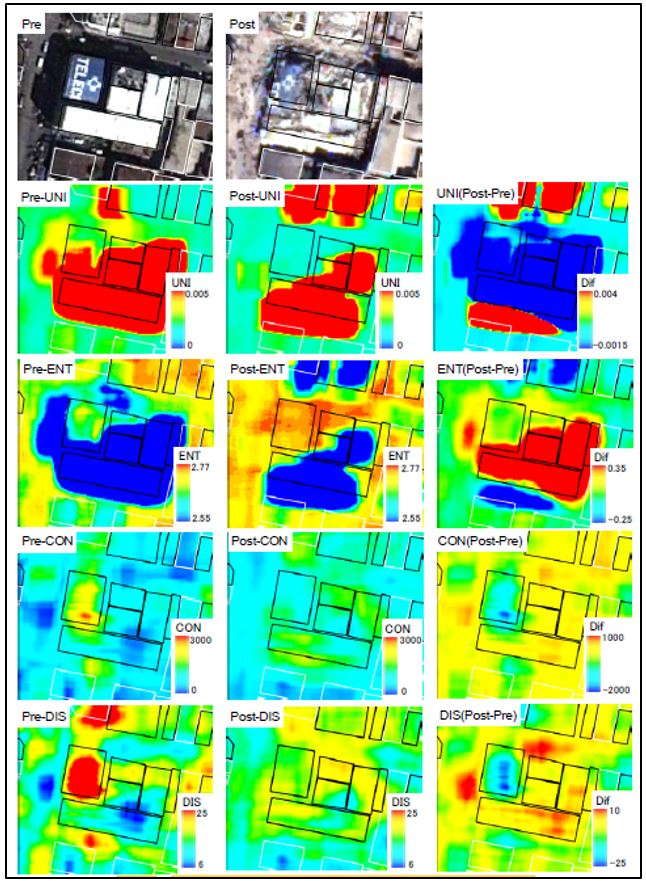
Figure 4: Image texture analysis based on the gray level co-occurrence matrix
Conclusions:
An increasingly large amount of diverse remote sensing and GIS data can be utilized in building damage detection. Visual interpretation remains to be the most reliable and independent method, especially for the determination of a lower damage grade. By visual interpretation, data from different sources and sensors can be precisely integrated. The results from visual interpretation are often used as the benchmark for validating the results from other methods.
Change detection using pre- and post-event images are also quite promising. With the assistance of ancillary data, building-level damage can be successfully identified using both pre- and post-event data.
References:
Charveriat, C. 2000. Natural Disasters in Latin America and the Caribbean: An Overview of Risk, Working Paper, Inter-American Development Bank. Research Department, No. 434. Internet: http://hdl.handle.net/10419/88044
Dong, L. and J. Shan. 2013. A Comprehensive Review of Earthquake-induced Building Damage Detection with Remote Sensing Images. ISPRS Journal of Photogrammetry and Remote Sensing, Vol. 84. pp. 85 – 99.
Gamba, P., F. Dell’Acqua and G. Trianni. Rapid Damage Detection in the Bam Area using Multitemporal SAR and Exploiting Ancillary Data. IEEE Transactions on Geoscience and Remote Sensing. Vol 45, No. 6. pp. 1582 – 1589.
Matsuoka, M. and F. Yamazaki. 2004. Use of Satellite SAR Intensity Imagery for Detecting Building Areas Damaged Due to Earthquakes. Earthquake Spectra: August 2004. Vol 20, No. 3. pp 975 – 994.
Matsuoka, M. and F. Yamazaki, 2005. Building Damage Mapping of the 2003, Bam, Iran, Earthquake using Envisat/ASAR Intensity Imagery. Earthquake Spectra. Vol 21, Issue S1. pp 285 – 294.
Miura, H., S. Midorikawa and H.C. Soh. 2012. Building Damage Detection of the 2010 Haiti Earthquake Based on Texture Analysis of High-Resolution Satellite Images. 15th World Conference on Earthquake Engineering. Lisbon, 2012.
Sepulveda, S.A. and D.N. Petley. 2015. Regional Trends and Controlling Factors of Fatal Landslides in Latin America and the Caribbean. Natural Hazards Earth System Science. Vol. 15. Pp. 1821- 1833.
Serpico, S.B., S. Dellepiane, G. Boni, G. Moser, E. Angiati and R. Rudari. 2012. Information Extraction From Remote Sensing Images for Flood Monitoring and Damage Evaluation. Proceeding of the IEEE. Vol 100, No. 10.
Thomas, J., A. Kareem and K. Bowyer. 2012. Recent Advances Towards a Robus, Automated Hurricane Damage Assessment From High Resolution Images. Advances in Hurricane Engineering. ATC & SEI Conference on Advances in Hurricane Engineering 2012.
Tong, X., Z. Hong, S. Liu, X. Zhang, H. Xie, Z. Li, S. Yang, W. Wang and F. Bao. 2012. Building Damage Detection using Pre- and Post-Seismic High-Resolution Satellite Stereo Imagery: A Case Study of the May 2008 Wenchuan Earthquake. ISPRS Journal of Photogrammetry and Remote Sensing. Vol. 68. pp. 13 – 27.
Yonezawa, C. and S. Takeuchi. 2001. Decorrelation of SAR Data by Urban Damages Caused by the 1995 Hyogoken-nanbu Earthquake. International Journal of Remote Sensing. Vol. 22, Issue 8.
Last update: 02 - 06 - 2016