

Saint Vincent & the Grenadines
The CHARIM project has generated a number of thematic maps for Saint Vincent (Main island only). On this page you can download the high-resolution PDF version of the maps, with complete cartographic representation. The digital maps can be consulted on the CHARIM Geonode.
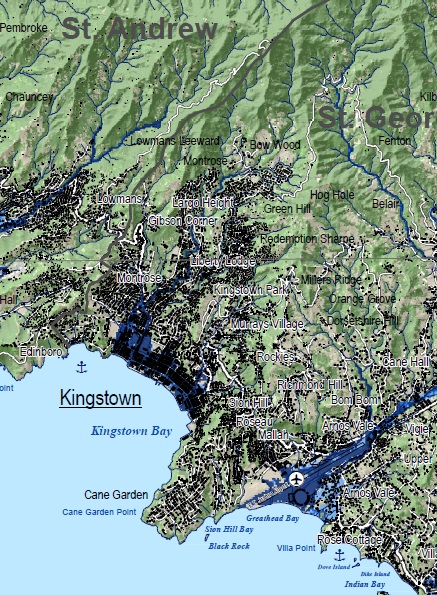
Detailed topographic map
|
|
 |
|||
Summary of the procedure to make the map:
This map was generated using a hillshading map generated from the Digital Elevation Model, which was made from a LiDAR survey. Unfortuantely the original LiDAR data were not available, and the DEM had a missing part in the top of the island, which was subsequently masked using a DEM from SRTM Elevation was also represented in colour, so that the combination of hillshading and elevation gives the best indication of the topography of the country. The available road map was adjusted based on a very high resolution satellite image (Pleiades, with spatial resolution of 2 meters multi spectral and 0.5 meter panchromatic). Screen digitizing was done to map the road and make a road classification. Building information was available for the entire island. Drainage lines were generated from the Digital Elevation Model and through editing. Place names in Grenada were obtained from an existing dataset, and through available maps and Google Earth. Airports, and other landmarks were digitized using the very high resolution images. Quarries were also mapped from these images. The generation of the individual thematic layers was carried out using the ILWIS software. Final map production was carried out using ArcGIS.
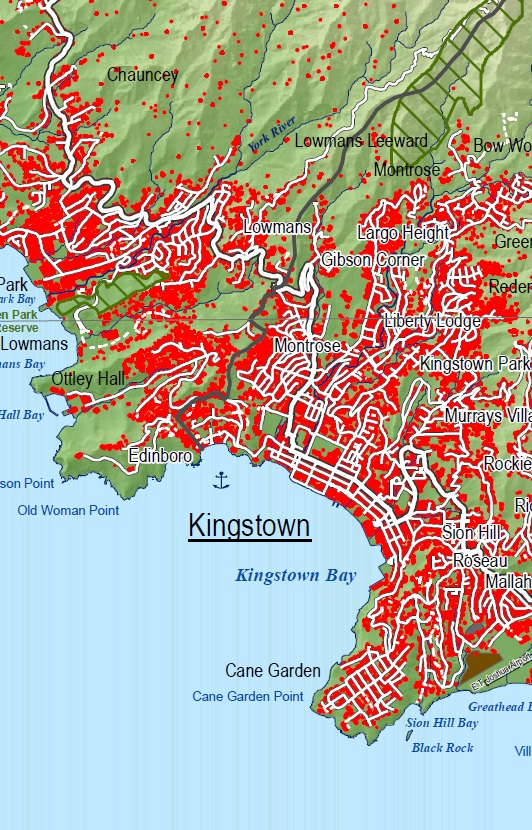
Land cover map
|
|
 |
Summary of the procedure to make the map:
The land cover map was generated by the British Geological Survey based on Object-Oriented Image Classification using recent high resolution satellite images. Additional thematic information on roads, built-up areas, landfill sites, quarries, airport and oil terminal were added using GIS.
Flashflood hazard map
- Download the PDF version
- Download the report on flood hazard assessment for Saint Vincent.
- Go to Geonode to view the map
|
|
 |
Summary of the procedure to make the map:
The flood hazard assessment was based on flash flood modeling of the entire island (all watersheds in one simulation). The following steps were used:
- Analyze the long term records of daily rainfall data of each island to determine the rainfall depth for 5, 20, 20 and 50 years. These record are often measured at the national airports or capitals of the islands. The daily maxima are combined in a Gumbel probability density analysis for the return periods. If more than one station exists, average values are used based on expert judgement.
- Design events are created with 5min or 10 minute intervals for each island, which have the total rainfall depth (in mm) from step 1. The shape of these events is based on an analysis of detailed rainfall data of Saint Lucia (1 minute intensities data approx. 15 stations for 12 years of rainfall). The analysis method is similar to the one used by the US meteorological service to construct 4 types of rainfall for the US. Each island has its own series of 4 design events (different magnitudes) but a shape that is based on the probability density analysis of St. Lucia detailed rainfall.
- Construct a model dataset based on DEM, digitized rivers, roads and buildings, a soil map and a land use map for each island.
- Simulate the flood dynamics for each design event using the LISEM modeling software
- Combine the 4 flood extent maps into one flood hazard map. Areas that are flooded with a frequency of 5 years or less are marked as very high hazard (4) while areas that are flood once every 50 years or more are classified as low hazard (1).
- Make a cartographic product of these hazard maps for each island (on a scale of 100.000).
Landslide inventory map
- Download the PDF version
- Download the report on landslide inventory and susceptibility mapping for SVG
- Go to Geonode to view the map
|
|
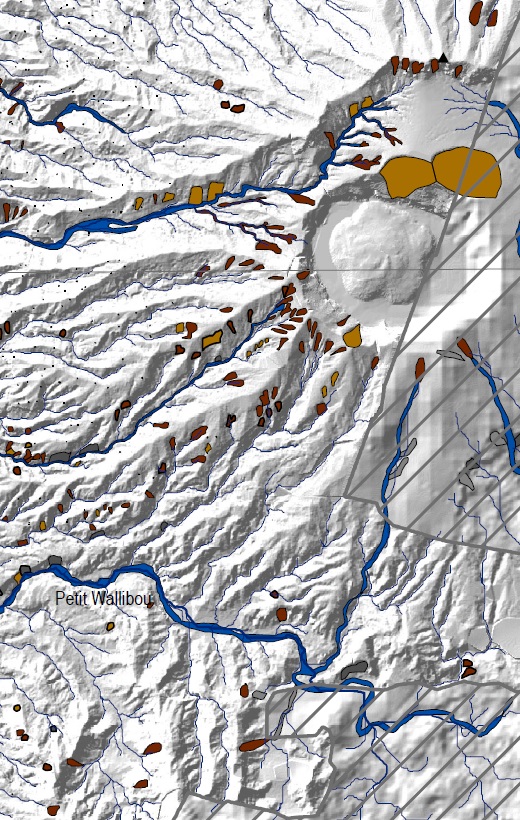 |
Summary of the procedure to make the map:
The landslide inventory map for Grenada was made using a number of different sources of information:
- Compilation of existing inventory maps.
- 1A landslide inventory made by De Graff (1988), with 475 landslides
- Generation of a new landslide inventory using:
- An interpretation from the hillshading image of the digital Elevation Model, which allowed us to map many old landslides that are subsequently covered by vegetation
- An interpretation using very high resolution satellite images (Pleaiades from 2014) and using multi-temporal images from Google Earth.
- We were able to map a large number of landslides, many more than in any of the previous inventories. We incorporated in our inventory also the landslides from the previous inventories and made a complete classification for all landslides
Landslide susceptibility map
- Download the PDF version
- Download the report on landslide inventory and susceptibility mapping for SVG
- Go to Geonode to view the map
|
|
 |
Summary of the procedure to make the map:
Landslide susceptibility assessment was carried out in two steps. First the importance of the various causal factors was analyzed using statistical modelling with Weights of Evidence (WOE) Analysis. This was done in an iterative process, and new factors were generated and tested. The final landslide susceptibility maps were generated using Spatial Multi-Criteria Evaluation (SMCE), where the weights form the statistical analysis were used as a basis, but were modified when considered appropriate. Also the effect of different weighting between the factor maps was evaluated. The quality of the resulting landslide susceptibility maps was tested using success rate curves, which were also used to classify the final susceptibility maps.In order to use SMCE, the factor maps need to be ordered, and standardized inside of a criteria tree. In order to decide the final criteria tree to be used to produce the final maps, several scenarios were tried as a sensitivity analysis to find out the best combination and ordering of the factor maps, and to compare how different methods of standardization can affect the results. in order to do this to main stages will.
Links:
- Legislation and planning framework in SVG
- Historical disasters in SVG
- Use Case Multi Hazards
- Use Case Multi Hazard Exposure
- Use case creating a historical disaster database
- Use case National Landslide Susceptibility Assessment
- Use Case landslide susceptibility along the road network
- Use Case Land Cover Mapping
- Use Case mapping Buildings from images
- Use Case generating national vulnerability maps
- Use Case using census data