

This use case shows the steps required for a local scale risk assessment. The development of the use case is based on a coastal town in Jamaica that is exposed to coastal flooding from storm surges.
This risk assessment focuses primarily on physical vulnerability which is the potential for physical impact on the built environment and the population. Vulnerability will be evaluated as the degree of damage that is likely to occur to a particular element at risk given the impact of hazard and so vulnerability is expressed on a scale from 0 (no damage) to 1 (total damage). This section of the report contains multi-temporal analysis, generation of vulnerability curve and risk analysis for Falmouth.
Keywords:
Storm surge; risk; vulnerability; hazard
| Before you start: | Use case Location: | Uses GIS data: | Authors: |
|---|---|---|---|
| Read the relevant sections of chapter 5 in the Methodology book | The town of Falmouth is located on the northwestern coast of Jamaica.r | Yes, a GIS data set is available for this use case. | Leiska Powell and Cees van Westen |
Introduction:
Jamaica is highly vulnerable to multiple natural hazards including, hurricanes with associated storm surge and strong winds, floods, landslides and earthquakes which have had adverse effects of people's livelihoods, physical infrastructure, and environment and on the economy. Between 2004 and 2012 the country experienced seven (8) major events with a price tag of approximately JD$117.7 billion and fifty five (55) casualties over the period.
According to a recent UNDP report (2014), over the past two decades, "disasters have killed more than 1.3 million people, affected more than 4.4 billion and cost the global economy at least US$2 trillion. It is estimated that each year, earthquakes, hurricanes and cyclones cost more than US$180 billion". Furthermore, it is foreseen that the impact of disasters will increase in the future due to climate change (IPCC, 2014)."
Climatic variability will add a new dimension to Jamaica's current risk profile with over 400 of the island's 900 communities' ranked high and moderately high vulnerable to natural hazards. An Inter-American Development Bank (IDB) Report of Jamaica's Catastrophe Risk Profile has revealed that the country is at risk of average annual losses of US$105 million due to hurricanes and US $30 million from earthquakes (PIOJ/IADB, 2010). The report further estimated that current exposure of physical assets to both hazards is approximately US$ 19 billion. These assets mostly include transportation and communication infrastructure such as bridges, road networks, public utilities, residential and commercial buildings.
Recognition of the debilitating impacts of disasters on economic development, physical infrastructure, life and livelihoods, the Government of Jamaica (GOJ) has focused on mainstreaming of disaster risk reduction in all sectors. With the national mandate of comprehensive disaster management, the Office of Disaster Preparedness & Emergency Management (ODPEM) has embarked on a number of initiatives to build the resilience of communities through the use of hazard and risk information. As such, one of the strategic priorities of the organization is to conduct multi hazard risk assessment in urban coastal areas which will serve as a platform for informed decision-making, formulation of policies, devising mitigation measures and preparedness activities. This priority of the ODPEM supports the United Nations Development Programme (UNDP) "Making Cities Resilient" campaign which recognized that unless cities have a clear understanding of the risks they face planning for meaningful disaster risk reduction may be ineffective. In addition, Jamaica has signed on to the Hyogo Framework for Action five priorities with the second priority of the HFA (UN ISDR, 2007) stresses upon generating and using hazard and risk information in spatial development decisions. Being party to both initiatives have underpinned the commitment of the ODPEM to comprehensive disaster management in Jamaica.
Objectives:
The primary objective is to conduct a local area risk assessment for storm surge hazard in order to reduce the impact on coastal infrastructure and its population as well as to provide requisite data for improved land use planning and disaster risk reduction.
The expected outcomes of this project seek to support initiatives and programmes of the community and the Trelawny Parish Council to foster an integrated approach to Disaster Risk Reduction (DRR) and climate change adaptation. The four (4) main outcome areas envisioned are:
- Improved land use planning by incorporating multi-hazard risk assessment in the development approval process to prevent/control development in high risk areas or hazardous areas as well as incorporate disaster risk reduction and climate change impacts into the Local Area Sustainable Development Plan for Trelawny. The risk assessment will provide information to zone land use and prescribe restrictions on building type, use and density based on risk assessment.
- Provide geospatial data which will facilitate a better understanding of hazard, vulnerability and risk for improved decision making, devising mitigation measures as well as preparedness activities.
- At the parish level, the assessment will inform mainstreaming DRR in various sectors.
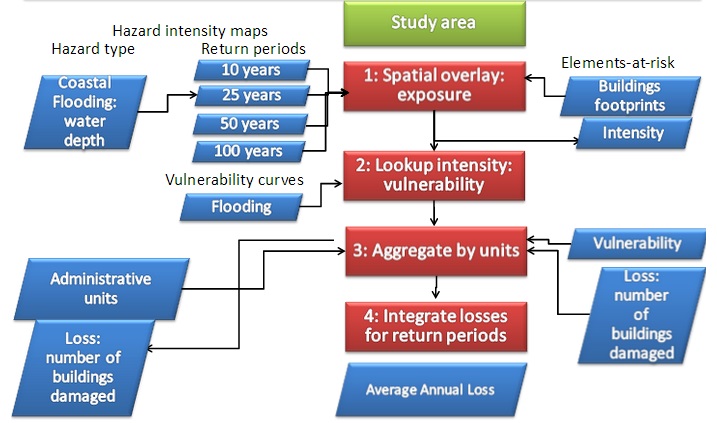
Flowchart:
Use case study area description:
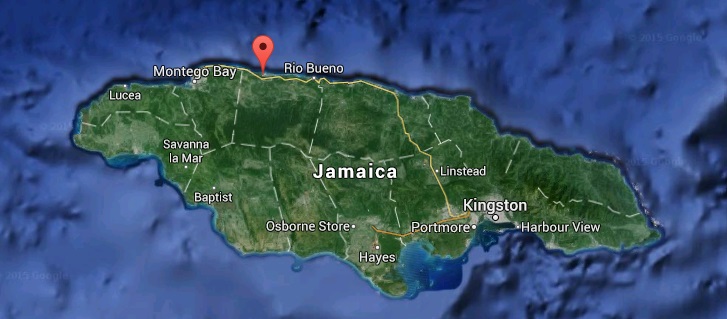 The coastal town of Falmouth is located on the northwestern coast of Jamaica with varying elevations of 1-3m along the coast and up to 10.4 m in the central and southern sections of the project area. The community is traversed by the Martha Brae River which runs from the southeastern boundary of the town to the northeast where it empties into the Caribbean Sea.The town is especially susceptible to hydro meteorological and geological hazards, in particular flooding and storm surge and earthquakes, respectively. Risk assessment is deemed important because:
- Significant investment in recent times as Falmouth is being redeveloped as a tourist area. Approximately US$~30 billion in investments is earmarked for the parish of Trelawny.
- Recent construction of Cruise Ship Pier US$122 million which is able to accommodate some of the largest ships in the world.
The total population for Falmouth according to 2001 Census is estimated to be 8185 of which 7370 persons comprise the population for the project boundary.
The coastal town of Falmouth is vulnerable to a number of hazards in part due to its geographical location. The town is especially susceptible to hydro meteorological and geological hazards, in particular flooding and storm surge and earthquakes, respectively. The Martha Brae River has frequently overflowed its banks after heavy rainfall, affecting the surrounding areas within its floodplain. The town has also impacted by storm surges, the most notably being Hurricane Allen in 1980.
These events have resulted in significant impact to the critical infrastructure, economy and livelihoods and most importantly, human lives. Table 1 below provides a summation of the disaster profile for Falmouth.
|
HAZARD |
YEARS |
NUMBER OF EVENTS |
CASUALTIES |
IMPACT |
|---|---|---|---|---|
|
Flooding |
1903-2010 |
29 |
1 |
>JA50M in damages for the parish |
|
Storm Surge |
1980 |
1 |
- |
Flooding and damage to several buildings |
|
Earthquake |
1930-1957 |
3 |
- |
Damage to critical facilities and buildings in Falmouth |
|
Wind Storm |
1903 |
1 |
- |
Damage to critical facility in Falmouth |
The historical data reveals that Falmouth frequently experiences flooding, which is mainly due to the combined effects of heavy rains and inadequate storm water drains to convey storm water and to a lesser extent in more recent times is the consequent overflowing of the Martha Brae River. Some of the worst flooding events in Falmouth were recorded in the years 1904, 1967, 1973, 1988, 2001, 2003 and 2005.
The town centre is also vulnerable to coastal flooding as a result of storm surges. The low lying town along with storm water drains makes it easy from surges to propagate inland. In 1980, Falmouth experienced one of the most devastating surge events when Hurricane Allen wreaked havoc on the community. The most documented impact from storm surges in Falmouth was the passage of Hurricane Allen in 1980. Wilmot et al (1980) reported the following:
- Maximum surge height: 6 feet (1.8m)
- Maximum surge distance inland: 150 yards (137.16m)
- Structural damage: Several buildings in the vicinity of Trelawny wharves were flooded and damaged; several seawalls in the same area were damaged.
- Coastal alteration: There was extensive sand deposition on backshore areas.
- Additional information: The Palmetto Point area was evacuated where sea level rose. Beach fixtures were damaged in the Trelawny Beach Hotel.
Problems definition and specifications:
The risk assessment methodology adopted in this study is based on definitions from United Nations International Strategy for Disaster Reduction (UN-ISDR). The basic function of risk can be divided into three components: hazard, vulnerability and elements at risk. Risk can be presented conceptually with the following equation:
Risk = Hazard * Vulnerability * Amount of exposed elements-at-risk
The hazard component in the equation refers to the probability of occurrence of a hazardous phenomenon within a specified time period. Vulnerability and exposure were estimated for the following types of elements at risk: buildings, population and road network. Exposure information was provided through the overlapping of the elements at risk and storm surge hazard footprint.
Data requirements:
In order to carry out local area risk assessment, the following input data are required:
Storm surge hazard intensity and probability maps
A database of hurricane track data in the Caribbean Sea, obtained from the National Hurricane Center (NOAA), was utilized to carry out a hindcast, followed by a statistical analysis to determine the hurricane characteristics such as waves, wind and set-up conditions. The database of hurricanes, dating back to 1886, was searched for storms that passed within a 300 km radius from the project area. The following procedure was carried out:
- Extraction of Storms and Storm Parameters from the historical database - a historical database of storms was searched for all storms passing within a search radius of 300km of the project area.
- Application of the JONSWAP Wind-Wave Model - a wave model was used to determine the wave conditions generated around the project area due to the rotating hurricane wind field. This is a widely applied model and has been used for numerous engineering problems. The model computes the wave height from a parametric formulation of the hurricane wind field.
- Application of Extremal Statistics - the predicted maximum wave height from each hurricane was arranged in descending order and each was assigned an exceedance probability by Weibull's distribution.
- A bathymetric profile from deep water to the site was then defined and each hurricane wave transformed along the profile. The wave height at the near shore end of the profile was then extracted from the model and stored in a database. All the determined near shore values were then subject to an Extremal Statistical analysis and assigned exceedance probabilities with a Weibull distribution.
The results of the search indicate the site's overall vulnerability to such systems. In summary:
- 74 hurricane systems came within 300 kilometers of the project area (Refer to Table 4.1 in Annex 1 )
- 1 of which was classified as catastrophic (Category 5)
- 11 were classified as extreme (Category 4)
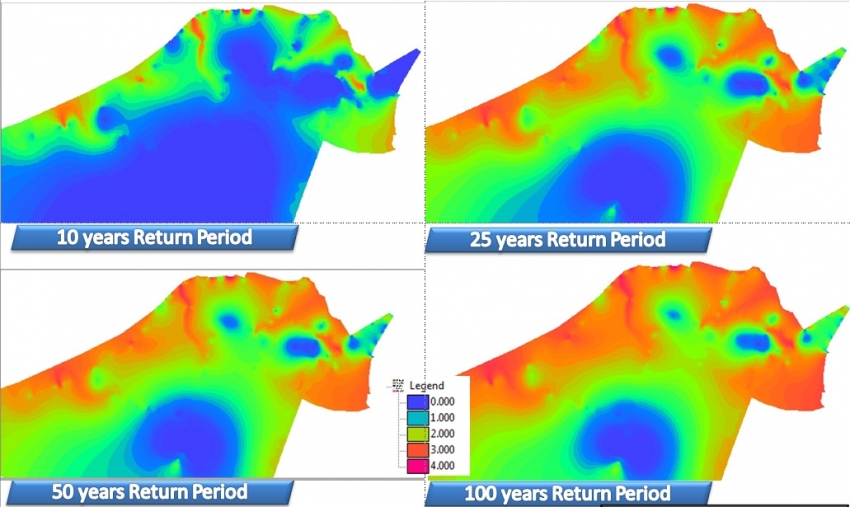
The storm surge with run-up was chosen as the benchmark model for determining the 10, 25, 50 and 100 year period storm surge levels for Falmouth. Return period indicates the period in years in which the hazards is likely to occur based on historic events. The surge inundation zones were mapped and plotted over satellite imagery for the return periods aforementioned in a GIS environment.
The analysis resulted in the following water height maps for different return periods.
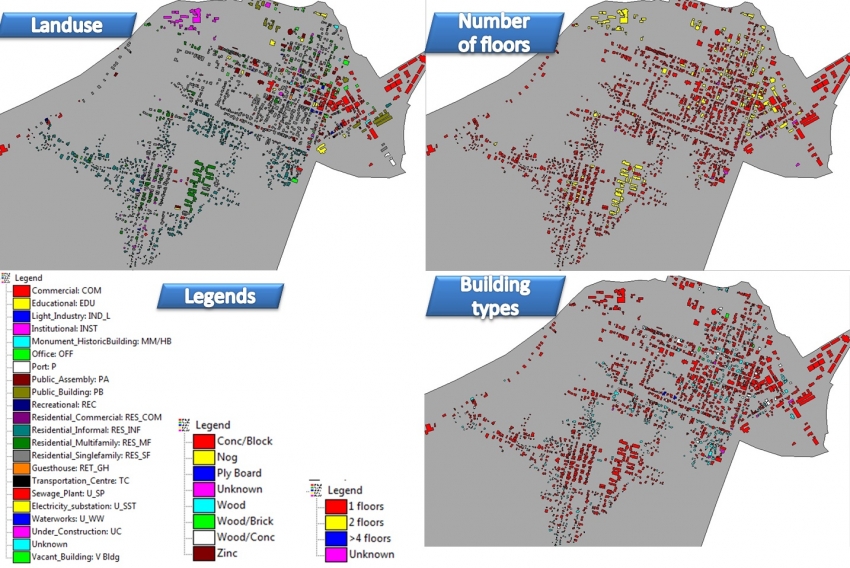
Elements"at"risk maps in the form of building footprint and their attributes
An elements at risk database was generated focusing on buildings and population in a Geographic Information System (GIS). The aim of the elements at risk mapping is to build a database for the evaluation of the vulnerability of the elements at risk for certain hazards. A detailed building inventory mapping was conducted with Trimble mobile GIS using Global Positioning System (GPS). The GPS device creates an accurate positional reference of the buildings in the community. Each building is represented as a point and a total of 1950 buildings were collected to include houses, critical facilities, financial institutions, offices and other buildings in the community. The data was collected over a 10 day period with a three (3) member team from the ODPEM along with two (2) community representatives.
The following attributes for each building were collected:
- Land use and building type - categories used were defined by NEPA (See Annex C) for classification)
- Material of construction - as defined by STATIN
- Number of floors - direct observation
Building footprints were digitized using ESRI's ArcMap from 2009 and 2011 satellite imagery. The building footprints were digitized as polygons as illustrated below . The attribute information from the point data shapefile was joined to the building footprint data by creating unique identifier number. This facilitated the creation of comprehensive elements at risk database.
Administrative units
These are in the form of Enumeration Districts. Jamaica is divided into 5776 Enumeration Districts for which population data is available. For the Falmouth area there are 16 Enumeration Districts. Information per ED is available on female and male population within different age groups.
Vulnerability curves
Once the elements at risk are identified it is possible to assess how they would be impacted, that is assessing the physical vulnerability. This can be done using vulnerability curves to estimate the direct impacts of the hazard for example, flood events (Jonkman et al. 2008 and Broekx et al 2011). A vulnerability curve expresses the relation between the hazard intensity (e.g. water depth) and the degree of damage which is expressed between 0 and 1 for a specific type of element at risk. Vulnerability curves are derived from either past disaster events by correlating observed intensities with observed damage, computer modeling or through expert opinion.
This risk assessment focuses on physical vulnerability with the hazard intensity being water depth. Damage due to storm surges depend on several factors such as direct exposure to wave action, water depth, debris and so on. Four (4) vulnerability curves were created based on hazard intensity and the elements-at-risk, in this case buildings. The development of these curves was done in collaboration with the Faculty of Geo-Information Science and Earth Observation, University of Twente in The Netherlands. The curves have been derived from existing curves in the literature and expert knowledge from aforementioned institute.
From the detailed asset inventory mapping, seven (7) material types were collected within the project boundary. These are reinforced concrete, wood, Nog, Ply Board, Wood/Brick, Wood/Concrete and Zinc. For the generation of the vulnerability curve for Falmouth the material type was simplified into two (2) groups- those that are considered to be weak and those that are strong. The classification of weak or strong buildings was based on the likely damage to be sustained by buildings when impacted by hazard intensity as well as the number of floors. That is, depending on the material type, flood depth and number of floors will influence the damage state.
Analysis steps:
The process for the risk assessment is as follows:
Step 1: Calculate the number of elements"at"risk exposed (buildings) to each of the return periods
The data from the elements at risk database, when overlain on the hazard maps provide the exposure of people, number of buildings and critical facilities as well as economic activities to the identified hazards for Falmouth. By understanding the type and number of assets that exist and where they are located in relation to known hazards areas, the relative risk and vulnerability for such assets can be assessed. In other words spatial overlay of hazard footprints and elements at risk provides information on exposure
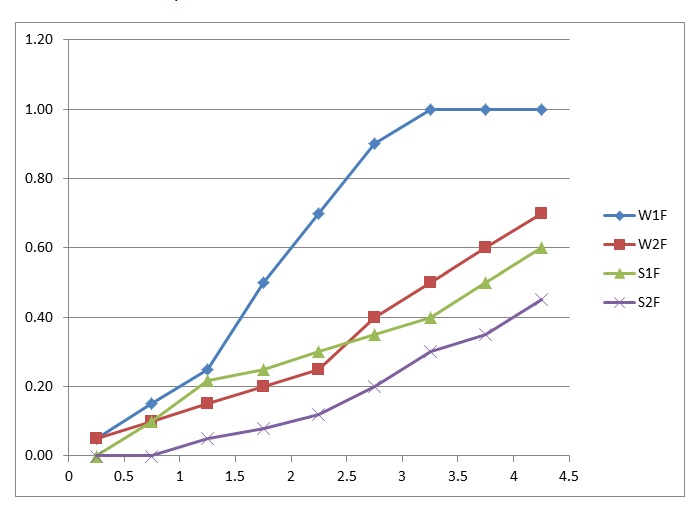
Step 2: Apply vulnerability curve for estimating the vulnerability to storm surge hazard
The application of the vulnerability curves below was used to link hazard intensity classes (flood depth) with the degree of damage for each type of element at risk for estimating the vulnerability to the different return periods. Four (4) types of curves were generated based on the simplification of building types in the community. These are as follows:
- W1F - Weak Wood (1 floor)
- W2F - Weak Wood (2 floors)
- S1F - Reinforced Concrete Strong (1 floor)
- S2F - Reinforced Concrete Strong (2 floors)
Step 3: Aggregate by administrative units
The degree of loss which is estimated for each return periods and for each building can also be represented in a more aggregated form by first classifying the degree of loss into four levels:
- Slight damage: 0 - 0.25
- Moderate damage: 0.25 - 0.5
- Severe damage: 0.6 -0.75
- Complete loss: 0.75 -1
For each return period the buildings are reclassified according to this classification, and then in GIS a spatial overlay is done to determine the Enumeration District in which they are located. The number of buildings with a given damage level are then summed up per ED and per return period.
Step 4: Calculate the damage class for each return period return period
The methodology used for the calculation of risk is based on semi- quantitative approach which aims at quantifying risk according to the following equation:
Risk = H * V * A
H - Hazard, represented as the annual probability of occurrence for 25, 50, 100 years return period
V- Physical vulnerability of the [articular element-at-risk, expressing the degree of damage or probability of complete loss of the elements at risk given the occurrence of hazard event.
A- Amount of exposed elements at risk, calculated by overlaying hazard scenarios with the elements at risk and then calculating the number of elements at risk per return period
As indicated above vulnerability has been evaluated as the degree of damage that is likely to occur to elements at risk, in this case buildings. A damage class was created to represent losses based on the vulnerability of buildings in Falmouth. The losses were then aggregated at the Enumeration District (ED) level for each return period which results in single loss values per ED.
We are not able to calculate the economic risk as there is no information available on the value of the elements-at-risk.
We could plot the results in a risk curve, or represent the results in a graph showing the number of building in each damage state against the annual probability of occurrence.
Results:
Exposure analysis
The table below displays the total number of buildings that are exposed to coastal flooding as a result of storm surge hazard. A total of 1743 buildings, representing a substantial percentage of the buildings within the study area, 94 % are located within the 100 year storm surge return period. The buildings that are situated on the seafront will be directly exposed to the sheer hydraulic force of storm surge waves as well as flood depth of up to 4m. The buildings further inland will be exposed to what is referred to as "resting" water damage. Flood depths inland will range between 0.4m to 2.0 m.
|
Land Use |
Total nr |
Number of buildings exposed per return period |
|||
|---|---|---|---|---|---|
|
10 |
25 |
50 |
100 |
||
|
Residential |
1427 |
837 |
1248 |
1300 |
1338 |
|
Commercial |
227 |
138 |
197 |
216 |
219 |
|
Industrial |
20 |
9 |
17 |
19 |
19 |
|
Educational |
12 |
8 |
11 |
11 |
11 |
|
Office |
25 |
15 |
23 |
25 |
25 |
|
Public Assembly |
21 |
13 |
20 |
20 |
20 |
|
Public Buildings |
14 |
13 |
14 |
14 |
14 |
|
Institutional |
7 |
6 |
6 |
7 |
7 |
|
Monument |
3 |
3 |
3 |
3 |
3 |
|
Guest House |
3 |
1 |
3 |
3 |
3 |
|
Port |
5 |
4 |
5 |
5 |
3 |
|
Utilities |
3 |
2 |
3 |
3 |
3 |
|
Recreational |
2 |
1 |
2 |
2 |
2 |
|
Cemetery |
1 |
0 |
1 |
1 |
1 |
|
Vacant |
38 |
21 |
32 |
34 |
34 |
|
Under Construction |
49 |
12 |
34 |
40 |
41 |
|
Total |
1857 |
1083 |
1619 |
1703 |
1743 |
From this table it is clear that a substantial number of residential buildings are exposed to storm surges. A total of 1338 houses are located within the 100 year storm surge return period scenario, representing 94% of all residential units in the project boundary. The maximum flood height associated with the 100 year return period range from 4 m along the shoreline to a minimum of 0.4m further inland. This level of exposure is due primarily to the low-lying topography of Falmouth with highest point being 10.4 m above mean sea level and so storm surge has the ability to penetrate far inland. Of the total residential units located within the 100 year storm surge hazard footprint, 580 are informal houses representing 43% of buildings exposed. Most, if not all of the informal houses are located in the south in the mangrove/swamp lands and not directly on the coast. Notwithstanding, the modeled flood depth can reach as high as 2.0 m owing to the flat and low lying topography of Falmouth.
Critical facilities is defined as the primary physical structures, technical facilities and systems which are socially, economically or operationally essential to the functioning of a society or community both in routine circumstances and in extreme circumstances of an emergency (UNISDR, 2009). There are twenty six (26) critical facilities in Falmouth of which 96% (25 facilities) are located within the 100 year storm surge hazard footprint. The facilities within the 100 year storm surge hazard footprint include among others the hospital, police and fire stations, courthouse and inland revenue department are exposed to flood depths of 2m and/or greater because of close proximity to the shoreline. The other facilities are exposed to flood depths ranging from 0.5-1.5m as they are further inland. Table to the left provides a listing of the 25 critical facilitates that are exposed to storm surge hazard.
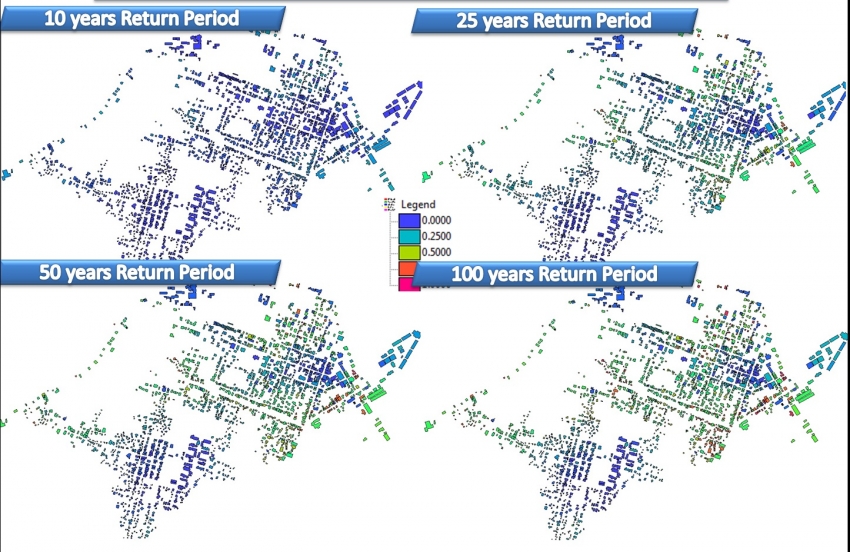
The following maps show the vulnerability for the different return periods
When the vulnerability data is summarized in a graph, the results are shown in the figure below. Based on the vulnerability of the elements at risk (buildings), four (4) damage states were defined to represent expected losses: slight, moderate, severe and destroyed.
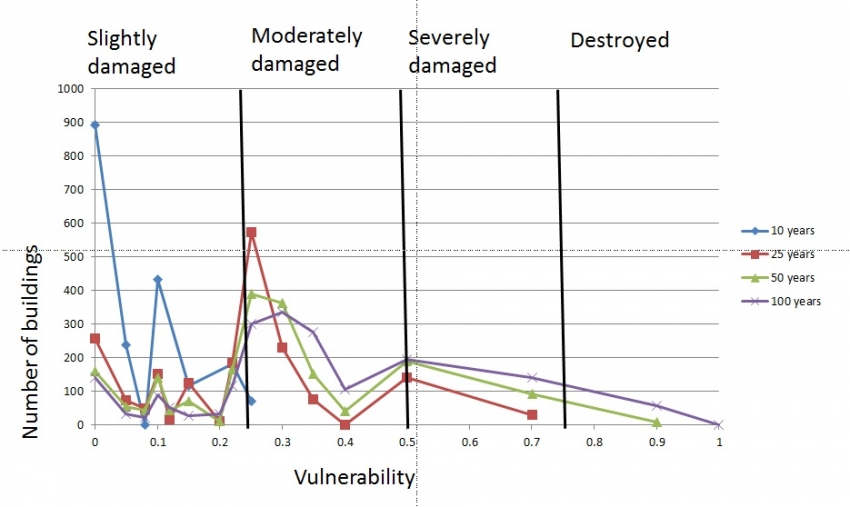
In the graph also the bondary values are shown to differentiate betweenfour damage states: Slight, moderate, severe and total damage
The number of buildings that are expected to be damaged by the different return periods is given in the table below:
|
Annual Probability |
Return Period |
Damage state |
|||
|---|---|---|---|---|---|
|
Slightly |
Moderately |
Severely |
Destroyed |
||
|
0.1 |
10 |
1865 |
71 |
0 |
0 |
|
0.04 |
25 |
878 |
884 |
174 |
0 |
|
0.02 |
50 |
695 |
949 |
283 |
9 |
|
0.01 |
100 |
520 |
1019 |
339 |
58 |
The results plotted in a graph look like this
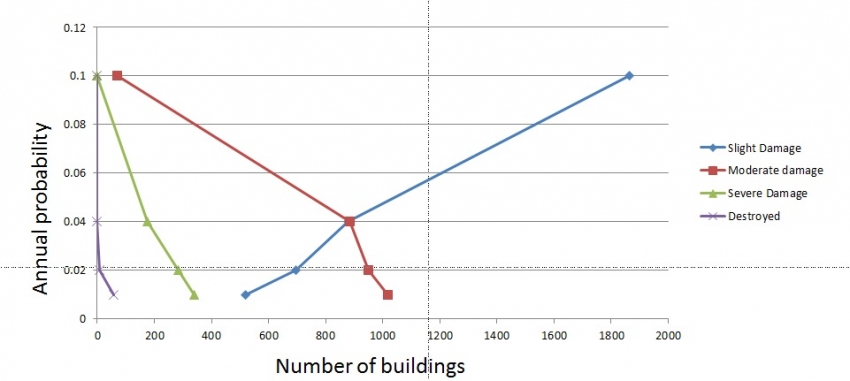
For the estimation of the risk from storm surges, the vulnerability curve was used to determine the damage state and the number of buildings using the four (4) classifications discussed above. The number of buildings that are expected to be damaged by the different return periods is given in the Table below
|
Annual Probability |
Return Period |
Damage State |
|||
|---|---|---|---|---|---|
|
|
|
Slight |
Moderate |
Severe |
Destroyed |
|
0.1 |
10 |
1865 |
71 |
0 |
0 |
|
0.04 |
25 |
878 |
884 |
174 |
0 |
|
0.02 |
50 |
695 |
949 |
283 |
9 |
|
0.01 |
100 |
520 |
1019 |
339 |
58 |
Conclusions:
This use case presents a relatively simple method for risk assessment at the local level. As can be seen from this exercise, such an analysis is only possible if:
- The hazard can be modeled as intensity maps for different return periods. This is often the biggest bottleneck in the entire procedure, as there is often not enough information available to carry out such a hazard analysis, as was also discussed in chapter 2 of the methodology book.
- The elements-at-risk can be mapped spatially, and characterized by their type. For example, the building types. If this information is lacking it will not be possible to link the intensity to a vulnerability. The availability of economical values of the elements-at-risk is also important, and essential when calculating the economic risk, but also without having such information it is possible to estimate the number of buildings destroyed, severely damaged, moderately damaged and slightly damaged.
- Vulnerability curves are essential to translate intensity into degree of damage. Also this is often a bottleneck , but the work-around is to use curves used in similar situations elsewhere.
The user is also advised to follow the more detailed use case 4.2 on the analysis of multi-hazard risk, which also contains a GIS exercise.
References:
David Smith - Institute for Sustainable Development, University of the West Indies, Mona, Jamaica .Presentation.
The table that has the number of casualties is obtained from the Office of Disaster Preparedness and Emergency Management
Jamaica Observer. 2011. Falmouth Overtakes Ocho Rios As Busiest Cruise. Available [ http://jamaica-gleaner.com/gleaner/20110617/business/business2.html]
Last update: 01 - 01 - 2015