

This use case is part of a series of use cases dealing with the analysis of changing risk.
This part deals with the initial steps: Analyzing the current level of risk. this is done for three hazards: flashfloods, debrisflows and landslides, and for one type of elements-at-risk (land parcels with information on land use , land value and number of people). This use case guides you throught he data requirements, and gives you the background of how the risk is analyzed, before guiding you through it step by step. The use case is accompanied by a GIS exercise, where you can do the analysis yourself.
Keywords:
Hazard assessment; elements_at-risk; vulnerability; exposure; losses ; risk; multi-hazard
| Before you start: | Use case Location: | Uses GIS data: | Authors: |
|---|---|---|---|
| You can first read the procedure on this web-page before downloading the data-set and software and carry out the hands-on training exercises | The use cases in this chapter are related to a hypothetical situation on one of the small Caribbean islands |
Yes, the uses cases are accompanied by GIS exercises that utlize the ILWIS GIS software Download the data in a Zip file (use save link as) Download the software in a Zip file (use save link as) |
Cees van westen |
Introduction:
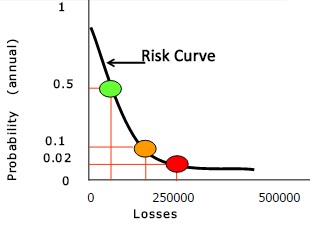
Risk is the probability of losses that may occur in the future due to different types of hazards. Hazards, such as floods, landslides, earthquakes, tsunami's have a relation between the frequency of occurrence and the magnitude of the event. The intensity is the spatially distributed effect of a hazard event (e.g. water depth during a flood varies over an area based on the topography and other factors). Intensity maps for different return periods are obtained through hazard modelling. In this case study these data are provided for three types of hazards (floods, debrisflows, landslides). Also coastal hazards may be considered in this case study. Elements-at-risk are all objects, people , activities that may be affected by a hazardous event, and cause losses. The spatial overlay of hazard intensity maps and elements-at-risk maps is called exposure. Elements-at-risk exposed to a certain hazard intensity may be damaged to a certain degree. This is defined by vulnerability curves.
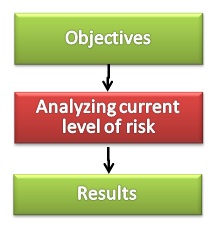
Objectives:
 In this workflow the stakeholders (e.g. local authorities) are interested to know the current level of risk in their municipality. They request expert organizations to provide them with hazard maps, asset maps, and vulnerability information, and use this information in risk modelling. They use the results in order to carry out a risk evaluation.
The analysis requires knowledge about how hazard maps are integrated with elements-at-risk maps and vulnerability data. In this use case you can first evaluate the speficic data requirements for doing a multi-hazard risk assessment. This will be done in the form of an animation, where you can select which data you would like to see and navigate through the animation.
Next we will show the concepts of risk assessment, also in an anmiation. You can also navigate through this.
Then the procedure is shown that will be carried out using the GIS approach. We do this step by step.
Then you can carry out the actual GIS based exercise. You first need to download the text for the exercise, the dataset and the software (ILWIS). By following the detailed steps described in the exercise text you can go step by step through the procesure.
The GIS exercise will use a so-called script for the calculation of the risk A script contains the list of GIS operations that need to be done for making the analysis.
Flowchart:
Data requirements:
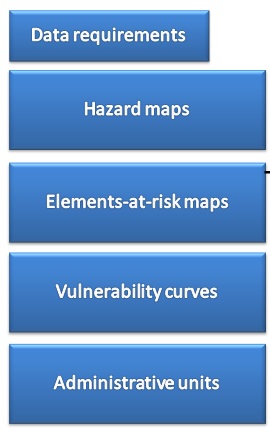
The use case will use a number of diferent types of data:
- Hazard maps
- Elements-at-risk maps
- Vulnerability curves
- Adminstrative units
Analysis steps:
Risk assessment requires a number of steps. the following animation gives you the basic concepts of quantitative risk assessment. See use case 4.1 Introduction to get a description of the steps involved.
The steps in the flowchart above are described here in more detail.
Stakeholders
Central in the whole process are the stakeholders. The envisaged users of the system are organizations involved in spatial planning, planning of risk reduction measures, or emergency preparedness and response. They work in a country with a specific legislation and planning process (See: Methodology Book chapter 7) and I organizations that have different mandates. These could be subdivided into:
- Government departments responsible for the construction, monitoring, maintenance and protection of critical infrastructure (e.g. the Ministry of Public Works). Their mandate is to:
- Plan the (re)location of critical infrastructure (roads, buildings and other critical infrastructure)
- Design guidelines for construction of roads and buildings in potentially dangerous areas
- Design of structural and non-structural mitigation measures against flooding and landslides
- Design of non-structural mitigation measures (e.g. watershed management)
- Physical planning departments responsible for the with the mandate to make land development plans at different scales. Their mandate is to:
- Develop national physical development plans
- Develop local development plans
- Develop guidelines for building construction in flood and landslide prone areas
- Evaluate relocation options for settlements in endangered areas
- Develop zoning maps with relevant hazard information for building control
- Provide relevant hazard and risk information for land subdivision.
- National Emergency Management Organizations (NEMO, ODM, NaDMA) with the mandate to:
- Design disaster response plans
- Organize volunteers for disaster response planning
- Develop and management Early Warning systems
- Shelter planning and management.
Hazard modeling
The government organizations are generally rather small in the small Caribbean states involved in the CHARIM project. They normally have a few persons capable of visualizing spatial data using GIS, but are not sufficiently capable of carrying out the actual spatial hazard and risk analysis required as the basis for their work. Therefore they will work with external consultants that will carry out this type of analysis for them, and they have to specify the exact Terms of Reference of the work of the consultants.
These consultants may work on different topics:
Hazard modeling. Consultants provide the relevant information related to flood and landslide hazard for the required scales of analysis
- National scale (for the entire island) with output at a scale of 1:25.000-1:50.000 for the island countries and 1:250.000 for Belize
- Local scale (for specific areas) with output at a scale of 1:5.000 to 1:10.000 for specific planning areas (such as settlement areas)
- Site-investigation scale (1:1000) for specific problem sites.
Hazard modeling involves the following components:
- Analysis of triggering events. As hydro-meteorological hazards such as flooding and landslides are mostly related to extreme rainfall events, the analysis of historical rainfall from raingauges is essential. Magnitude-frequency analysis is used to analyse the return periods of specific rainfall scenarios, for which the corresponding hazard scenarios will be analysed.
- Hazard initiation assessment. This involves the analysis of the the locations where hydro-meteorological hazards are like to be initiated, and quantify them. For flooding this involves a hydrological analysis, where triggering rainfall is translated into discharge for a given return period. For landslides this relates to the analysis of the susceptibility of landslide initiation through spatial analysis.
- Hazard runout assessment. This involves the modelling of the possible intensities (spatial distribution of the quantified impact of the hazard) for the return periods used in the initiation assessment. For flooding this would result in flood height/flow velocity maps for different return periods. For landslides this would result ion potential runout areas of landslides and debrisflows.
Elements-at-risk and vulnerability assessment.
This refers to:
- Creation of spatial elements-at-risk databases related to buildings, and to critical infrastructure. This requires extensive GIS work related to the creation of the spatial elements from high resolution satellite images and available data;
- The characterization of these elements in terms of their types (e.g. occupancy types and building types for buildings, road types);
- The characterization of these elements in terms of their replacement costs in collaboration with the Departments of Statistics and Economy;
- The characterization of the distribution of the population for different temporal scenarios (e.g. daytime and nighttime, or for normal periods and tourist periods)
The selection of appropriate vulnerability curves for the various types of elements-at-risk that will be used in the risk assessmentTo carry out social vulnerability assessment using data from the national census in collaboration with the Department of Statistics.
Part of this work should be done by the government organizations themselves as they have the mandate to collect spatial information on the elements-at-risk. For instance the Public works Department should develop a spatial database of the roads including all relevant characteristics related to road type, culverts, bridges , drainage, road cuts and embankment fills, and slope stabilization works. The Department of Physical Planning, together with other relevant Departments is responsible for collecting and maintaining a national building database with the relevant characteristics of buildings. In the establishment of these databases external consultants may play an important role, however on the long run for the respective government organizations would have the mandate to maintain and update these databases.
More information:
Read more on hazard assessment methods in the three books:
- Methodology book:
- Chapter 2: analysis of triggers
- Chapter 3: flood hazard assessment
- Chapter 4: landslide hazard assessment
- Use Case Book:
- Chapter 7: Elements-at-risk mapping and vulnerability assessment
- Chapter 8: Hazard assessment
- Data Management Book
- Chapter 2: Data requirements for hazard and risk assessment
- Chapter 3: Data collection: Base data
- Chapter 4: Data collection: hazard data
Risk Analysis
The crucial stage in the evaluation of possible risk reduction strategies is the analysis of risk, which is defined as the probability of losses related to potentially hazardous phenomena. Risk assessment is the use of available information to estimate the risk to individuals or populations, property, or the environment, from hazards. Risk analysis generally contains the following steps: hazard identification, hazard assessment, elements at risk/exposure analysis, vulnerability assessment and risk estimation.
Also this type of work generally is not carried out by the government organizations themselves, but rather by consultants, that have the right expertise to carry out this type of analysis for one or more types of hazards, in combination with one or more types of elements-at risk. This work is done at the appropriate scale related to the objectives of the stakeholders. The risk assessment can be subdivided into the following components:
Exposure analysis. In this analysis hazard scenarios worked out by the hazard assessment consultants for different return periods (e.g. once in 10 , 25, 50 and 100 years) are combined spatially with the elements-at-risk and the number of elements-at-risk exposed to a certain hazard intensity is calculated. Also for each element-at-risk the (maximum) intensity is calculated given a certain return period.Vulnerability assessment. The results from the exposure analysis in terms of the maximum intensity per return period are then used in combination with vulnerability curves or matrices for the respective elements-at-risk types. Through the vulnerability curves a translation is made from the intensities of the hazard to the expected degree of loss for the elements at risk.Risk assessment. The results from the vulnerability assessment are then used in combination with the quantification of the elements-at-risk to calculated the expected losses. In the case of economic losses, the replacements costs for the elements-at-risk are used, resulting in specific losses per return period. In the case of population losses the number of people are used in combination with the population vulnerability resulting from the vulnerability assessment. The resulting losses for different return periods are summed up for given administrative units and integrated for the different return periods to provide the average annual losses. These are used as the basis for the risk evaluation and for the formulation of possible risk mitigation measures.
More information:
Read more on risk assessment methods in the three books:
- Methodology book:
- Chapter 5: Exposure, vulnerability and risk assessment
- Use Case Book:
- Chapter 6: Risk assessment
- Data Management Book
- Chapter 2: Data requirements for hazard and risk assessment
Risk Evaluation
After analyzing the risk it is important to determine whether the risk is too high, and where the risk is too high. This is called the risk evaluation stage, and is the stage at which values and judgements enter the decision process, explicitly or implicitly, by including consideration of the importance of the estimated risks and the associated social, environmental, and economic consequences, in order to identify a range of alternatives for managing the risks.Important considerations in this respect are:
- Risk perception among stakeholders. Risk perception is about how individuals, communities, or governments perceive/judge/evaluate/rank the level of risk, in relation to many factors described in Chapter 6 of the Methodology book.
- Risk acceptability. Ana acceptable risk is a risk which the society or impacted individuals are prepared to accept. Actions to further reduce such risk are usually not required unless reasonably practicable measures are available at low cost in terms of money, time and effort. The definition of acceptability levels is a responsibility of the national or local government in a country. Risk acceptability depends on many factors, and differs from country to country. Therefore it is also not possible to simply export them to other countries. Risk acceptability levels are generally done on this basis of individual risk levels or societal risk levels (using so-called F-N curves), which are described in chapter 6 of the Methodology book.
- Risk communication. An important component in determining the risk perception is the communication between the stakeholders of the levels of risk. Do government organizations actively involve other stakeholders in the consultation process of the actual level of risk and the possible risk reduction measures?
More information:
Read more on risk acceptability methods in the three books:
- Methodology book:
- Chapter 5: Exposure, vulnerability and risk assessment
- Use Case Book:
- Chapter 6: Risk assessment
Step 1: Loss analysis
The Loss analysis has to be done for each combination of a hazard map (for a given return period) and an elements-at-risk map. Each loss estimation requires a number of steps, which make that doing this type of analysis manually is very time consuming. Therefore we are using an automated script, which combines a number of calculations and operations, and uses parameters.
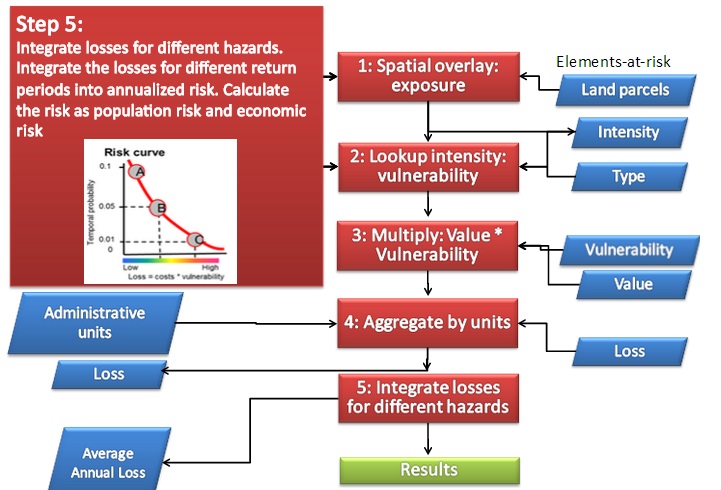
The script is called "Loss_calculation". It does the following steps:
- Rasterize the element-at-risk map
- Overlay the element at risk map with the hazard intensity map.
- The resulting cross table (joint frequency table) contains all combinations of the land parcel code and the intensity values (e.g. water depths). We classify the results, according to the classification of the hazard intensity, so that the result is in the form of classes, which can be used to join with the vulnerability tables.
- As land parcels are sometimes large and only part of them might be actually exposed to hazard intensity the script calculates the losses first for the parts of the land parcels with the same intensity.
- In order to know which fraction of each land parcel has a certain intensity, the script reads in in the area of the whole land parcel from the attribute table of the land parcel map.
- Then the script calculates the fraction of the land parcel (Area of the unit in the joint frequency table / the area of the entire land parcel).
- Then the script joins with the attribute table of the land parcels and reads in the amount column either value or people, depending on the input provided by the user.)
- The script uses this then to calculate the amount for each combination of land parcel and intensity class
- The script joins with the attribute table of the land parcels and reads in the land use types.
- The script joins with the vulnerability table (of the hazard type indicated) and reads in the vulnerability values for all lands use types. The script needs to joint all 23 vulnerability types.
- The vulnerability for each record is calculated by taking the vulnerability value of the column that has the same land use code as in the record .
- The script calculates a column that has an indication whether we are dealing with a spatial probability map. This is done by creating a column SPCheck and then checking if the entered value is SP (Spatial Probability) or not.
- If this is the case, we use the spatial probability, otherwise a value of 1.
- The script then calculates the loss by multiplying the amount * vulnerability * spatial probability.
- In order to bring back the information at the level of the land parcels, the script aggregates the loss for the land parcels
- The script also aggregates the loss for the administrative units
- The script aggregates the losses for the whole area
- The script then deletes all the intermediate files
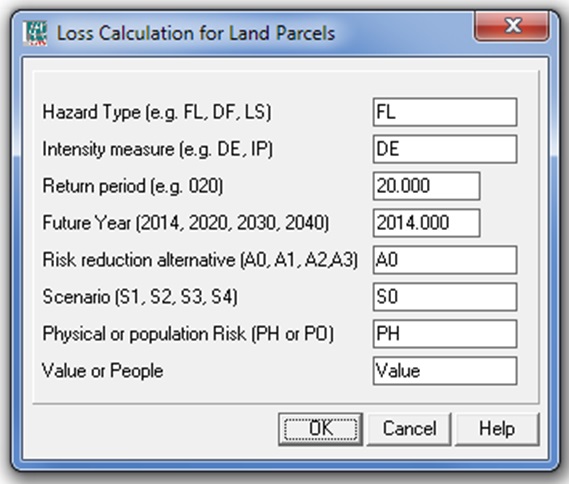
It is not really required that you understand each individual step of the analysis, because we have combined them into one file, called a script file that contains all above calculation steps. You can run the total analysis in one go. the only thing you need to specify is: for which combinations of hazard type, return period, and element-at-risk map do I make the loss assessment. This is done by indicating the variables in a script. the loss_calculation script has the following variables.
The script uses nine parameters, which you can change everytime, so you can use the script for all possible combinations:
Step 2: Automate the loss calculation for many combinations
You can also run the script bypassing the input screen. You can do that by typing the parameters behind the script name, separated by spaces. You can also prepare an input script where you write all the combinations for which you want to calculate losses.
Step 3: Carry out the risk analysis
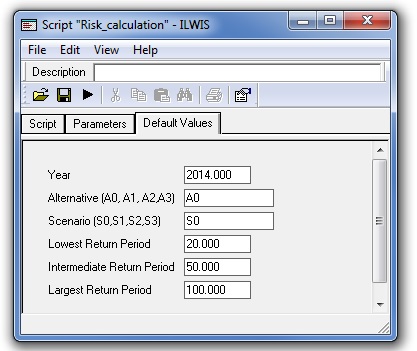
The risk analysis can be carried out if you have done the loss estimation for three return periods of the hazard type(s) that were selected, and for the land parcel map that was selected, and the risk type (physical or population)
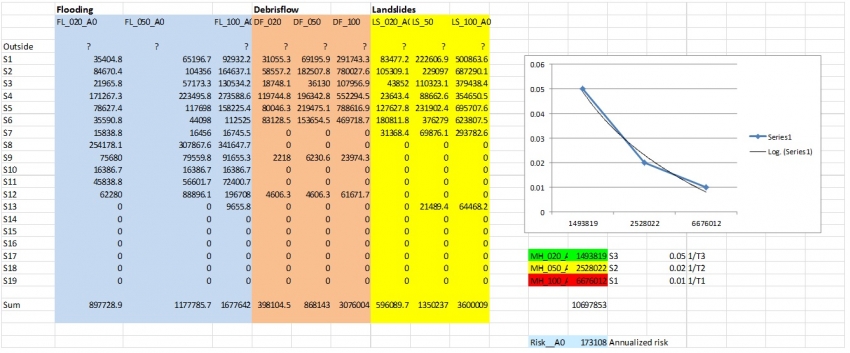
The risk analysis can also be done using a script: Risk_calculation. It can only be executed after you have calculated the losses using the script Loss_calculation. The data should be available in the table: Results_LP. It requires the individual losses for Floods (FL), Debrisflow (DF) and Landslides (LS) for three return periods. This script does the following:
- For each land parcel it will calculate the maximum loss for the same return period resulting either from flooding, landslides or debrisflows, as these events are caused by the same trigger.
- Then the resulting losses are aggregated by the administrative units;
- Then the annual risk is calculated using the equation indicated above;
The total annualized risk is calculated for the entire area, or for administrative units.
Results:
For example the result could look like this for the Administrative units in the study area. the annualized risk in this case is: 173108
Last update: 01 - 01 - 2015