

By:
Introduction
In section 2.1 we have introduced the following definition of hazard of the UN-ISDR as "A dangerous phenomenon, substance, human activity or condition that may cause loss of life, injury or other health impacts, property damage, loss of livelihoods and services, social and economic disruption, or environmental damage. This event has a probability of occurrence within a specified period of time and within a given area, and has a given intensity."
These hazardous events may be potentially harmful to people, property, infrastructure, economy and activities, but also to the environment, which are all grouped together under the term Elements-at-risk or assets. Also the term exposure is used to indicate those elements-at-risk that are subject to potential losses. Important elements-at-risk that should be considered in analyzing potential damage of hazards are population, building stock, essential facilities and critical infrastructure. Critical infrastructure consists of the primary physical structures, technical facilities and systems which are socially, economically or operationally essential to the functioning of a society or community, both in routine circumstances and in the extreme circumstances of an emergency (UN-ISDR, 2009). Elements-at-risk have a certain level of vulnerability, which can be defined in a number of different ways. The general definition is that vulnerability describes the characteristics and circumstances of a community, system or asset that make it susceptible to the damaging effects of a hazard (UN-ISDR, 2009). There are many aspects of vulnerability, related to physical, social, economic, and environmental conditions (see for example Birkmann, 2006). When considering physical vulnerability only, it can be defined as the degree of damage to an object (e.g. building) exposed to a given level of hazard intensity (e.g. water height, ground shaking, impact pressure).
Risk is defined as the probability of harmful consequences, or expected losses (deaths, injuries, property, livelihoods, economic activity disrupted or environment damaged) resulting from interactions between natural or human-induced hazards and vulnerable conditions (UN-ISDR, 2009, EC, 2011). Risk can presented conceptually with the following basic equation indicated in Figure 1. Risk can presented conceptually with the following basic equation:
Risk = Hazard * Vulnerability * Amount of elements-at-risk
The equation given above is not only a conceptual one, but can also be actually calculated with spatial data in a GIS to quantify risk from geomorphological hazards. The way in which the amount of elements-at-risk are characterized (e.g. as number of buildings, number of people, economic value) also defines the way in which the risk is presented. Table 1 gives a more in-depth explanation of the various components involved. In order to calculate the specific risk (see table 1) equation 1 can be modified in the following way:
RS = P (T:Hs) * P (L:Hs) * V(Es | Hs ) * AES
in which:
P (T:Hs) is the temporal (e.g. annual) probability of occurrence of a specific hazard scenario (Hs) with a given return period in an area;
P (L:Hs) is the locational or spatial probability of occurrence of a specific hazard scenario with a given return period in an area impacting the elements-at-risk;
V(Es | Hs ) is the physical vulnerability, specified as the degree of damage to a specific element-at-risk Es given the local intensity caused due to the occurrence of hazard scenario HS
AEs is the quantification of the specific type of element at risk evaluated (e.g. number of buildings)
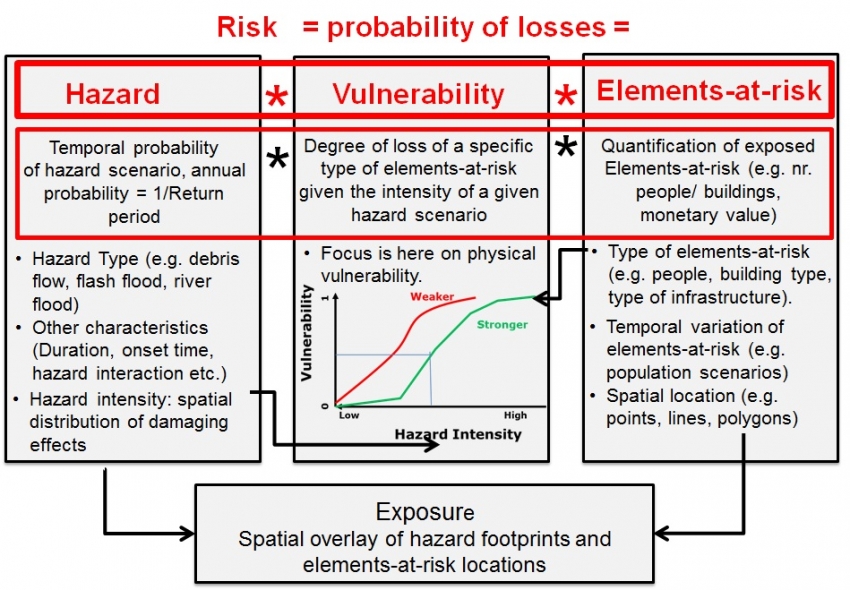
Figure 1: Schematic representation of risk as the multiplication of hazard, vulnerability and quantification of the exposed elements-at-risk. The various aspects of hazards, vulnerability and elements-at-risk and their interactions are also indicated. This framework focuses on the analysis of physical losses, using physical vulnerability data.
The term risk mapping is often used as being synonymous with risk analysis in the overall framework of risk management. Risk assessments (and associated risk mapping) include: a review of the technical characteristics of hazards such as their location, intensity, frequency and probability; the analysis of exposure and vulnerability including the physical social, health, economic and environmental dimensions; and the evaluation of the effectiveness of prevailing and alternative coping capacities in respect to likely risk scenarios (UN-ISDR, 2009; EC, 2011; ISO 31000). In the framework of natural hazards risk assessment, the term risk mapping also indicates the importance of the spatial aspects of risk assessment. All components of the risk equation (Figure 1) are spatially varying and the risk assessment is carried out in order to express the risk within certain areas. To be able to evaluate these components we need to have spatially distributed information. Computerized systems for the collection, management, analysis and dissemination of spatial information, so-called Geographic Information Systems (GIS) are used to generate the data on the various risk components, and to analyze the risk (OAS, 1991; Coppock, 1995; Cova, 1999; van Westen, 2013). Hazard data is generally the most difficult to generate. For each hazard type (e.g. flooding, debrisflow, rockfall) so-called hazard scenarios should be defined, which are hazard events with a certain magnitude/intensity/frequency relationship (e.g. flood depth maps for 10, 50 and 100 year return periods). Different types of modelling approaches are required for the hazard scenario analysis, depending on the hazard type, scale of analysis, availability of input data, and availability of models. Generally speaking a separate analysis is required to determine the probability of occurrence for a given magnitude of events, followed by an analysis of the initiation of the hazard (e.g. hydrological modelling or landslide initiation modelling), and of the run-out or spreading of the hazard (e.g. hydrodynamic modelling or landslide run-out modelling). Overviews of hazard and risk assessment methods for landslides for example can be found in Corominas et al. (2014), and for floods in Prinos (2008). Elements-at-risk data are very often based on building footprint maps, which represent the location of buildings, with attributes related to their use, size, type and number of people during different periods of the year (e.g. daytime, nighttime). Remote Sensing is often used to extract these building maps if existing cadastral maps are not available. For other elements-at-risk like transportation infrastructure and land cover maps also remote sensing data are used as important inputs. Vulnerability data is often collected in the form of vulnerability curves, fragility curves or vulnerability matrices, which indicate the relationship between the levels of damage to a particular type of element-at-risk (e.g. single storey masonry building) given intensity levels of a particular hazard type (e.g. debris flow impact pressure). Generation of vulnerability curves is a complicated issue, as they can be generated empirically from past damage event for which intensity and damage is available for many elements-at-risk, or through numerical modelling (Roberts, Nadim and Kalsnes, 2009). Table 2 gives an overview of the various components of risk.
|
Term |
Definition |
Equations & explanation |
|---|---|---|
|
Natural hazard (H) |
A potentially damaging physical event, phenomenon or human activity that may cause the loss of life or injury, property damage, social and economic disruption or environmental degradation. This event has a probability of occurrence within a specified period of time and within a given area, and has a given intensity. |
P (T:HS) is the temporal (e.g. annual) probability of occurrence of a specific hazard scenario (Hs) with a given return period in an area; P (L:HS) is the locational or spatial probability of occurrence of a specific hazard scenario with a given return period in an area impacting the elements-at-risk |
|
Elements-at-risk (E) |
Population, properties, economic activities, including public services, or any other defined values exposed to hazards in a given area". Also referred to as "assets". |
Es is a specific type of elements-at-risk (e.g. masonry buildings of 2 floors) |
|
Vulnerability (V) |
The conditions determined by physical, social, economic and environmental factors or processes, which increase the susceptibility of a community to the impact of hazards. Can be subdivided in physical, social, economical, and environmental vulnerability. |
V(Es | Hs ) is the physical vulnerability, specified as the degrees of damage to ES given the local intensity caused due to the occurrence of hazard scenario HS It is expressed on a scale from 0 (no damage) to 1 (total loss) |
|
Amount of elements-at-risk (AE) |
Quantification of the elements-at-risk either in numbers (of buildings, people etc), in monetary value (replacement costs etc), area or perception (importance of elements-at-risk). |
AEs is the quantification of the specific type of element at risk evaluated (e.g. number of buildings)
|
|
Consequence (C) |
The expected losses (of which the quantification type is determined by AE) in a given area as a result of a given hazard scenario. |
CS is the "specific consequence", or expected losses of the specific hazard scenario which is the multiplication of VS *AES |
|
Specific risk (RS) |
The expected losses in a given area and period of time (e.g. annual) for a specific set of elements-at-risk as a consequence of a specific hazard scenario with a specific return period. |
RS = HS * VS *AES RS = HS* CS RS = P (T:Hs) * P (L:Hs) * V(Es | Hs ) * AES
|
|
Total risk (RT) |
The probability of harmful consequences, or expected losses (deaths, injuries, property, livelihoods, economic activity disrupted or environment damaged) resulting from interactions between natural or human-induced hazards and vulnerable conditions in a given area and time period. It is calculated by first analyzing all specific risks. It is the integration of all specific consequences over all probabilities. |
RT ≈∑ (RT) = ∑( HS * VS *AES) Or better: RT = ∫ (VS *AES) - For all hazard types - For all return periods - For all types of elements-at-risk. It is normally obtained by plotting consequences against probabilities, and constructing a risk curve. The area below the curve is the total risk. |
Risk Assessment and mapping
Risk mapping for natural hazard risk can be carried out at a number of scales and for different purposes. Table 3 gives a summary. In the following sections four methods of risk mapping will be discussed: Quantitative risk assessment (QRA), Event-Tree Analysis (ETA), Risk matrix approach (RMA) and Indicator-based approach (IBA).
Table 3: Indication of scales of analysis with associated objectives and data characteristics (approaches: QRA = Quantitative risk assessment, EVA = Event-Tree Analysis, RMA = Risk matrix approach, IBA = Indicator-based approach),
|
Scale of analysis |
Scale |
Possible objectives |
Possible approaches |
|---|---|---|---|
|
International, Global |
< 1 : 1 million |
Prioritization of countries/regions; Early warning |
Simplified RMA & IBA |
|
Small: provincial to national scale |
< 1:100,000 |
Prioritization of regions; Analysis of triggering events; Implementation of national programs; Strategic environmental assessment; Insurance |
Simplified EVA, RMA & IBA |
|
Medium: municipality to provincial level |
1:100000 to 1:25000 |
Analyzing the effect of changes; Analysis of triggering events; Regional development plans |
RMA / IBA |
|
Local: community to municipality |
1:25000 to 1:5000 |
Land use zoning; Analyzing the effect of changes; Environmental Impact Assessments; Design of risk reduction measures |
QRA / EVA / RMA IBA |
|
Site-specific |
1:5000 or larger |
Design of risk reduction measures; Early warning systems; detailed land use zoning |
QRA / EVA / RMA |

Figure 2: Components relevant for risk assessment, and the four major types of risk mapping
The four methods for risk assessment will be treated more in detail in section 5.4 and 5.5. They have certain advantages and disadvantages, which are summarized in Table 3. The Quantitative Risk Assessment method is the best for evaluating several alternatives for risk reduction, through a comparative analysis of the risk before and after the implementation followed by a cost-benefit analysis. The event-tree analysis is the best approach for analyzing complex chains of events and the associated probabilities. The risk matrix approach is often the most practical approach as basis for spatial planning, where the effect of risk reduction methods can be seen as changes in the classes within the risk matrix. The indicator-based approach, finally, is the best when there is not enough data to carry out a quantitative analysis, but also as a follow-up of a quantitative analysis as it allows to take into account other aspects than just physical damage. Even though hazard and risk mapping may have taken place, real risk reduction will only happen when it leads to a reduction in either the hazards frequency and intensity, the number of exposed elements-at-risk and their vulnerability. This requires integration of risk analysis into a risk management framework, which includes the adoption of policy and regulations, and interaction of geoscientists within this process (DeGraff, 2012).
Table 4: Advantages and disadvantages of the four risk assessment methods discussed.
|
Method |
Advantages |
Disadvantages |
|---|---|---|
|
Quantitative risk assessment (QRA) |
Provides quantitative risk information that can be used in Cost-benefit analysis of risk reduction measures. |
Very data demanding. Difficult to quantify temporal probability, hazard intensity and vulnerability.
|
|
Event-tree analysis |
Allow modelling of a sequence of events, and works well for domino effects |
The probabilities for the different nodes are difficult to assess, and spatial implementation is very difficult due to lack of data. |
|
Risk matrix approach |
Allows to express risk using classes instead of exact values, and is a good basis for discussing risk reduction measures. |
The method doesn't give quantitative values that can be used in cost-benefit analysis of risk reduction measures. The assessment of impacts and frequencies is difficult, and one area might have different combinations of impacts and frequencies. |
|
Indicator-based approach |
Only method that allows to carry out a holistic risk assessment, including social, economic and environmental vulnerability and capacity. |
The resulting risk is relative and doesn't provide information on actual expected losses. |
In order to learn more about the various components please select of the options below.
5.2 Characterization of assets
5.3 Vulnerability
5.4 Multi-hazard risk
5.5 Quantitative methods
References
Bedford T, Cooke RM (2001). Probabilistic Risk Analysis: Foundations and methods; Cambridge University Press
Birkmann J (ed) (2006). Measuring Vulnerability to Natural Hazards: Towards Disaster Resilient Societies. UNU Press, Tokyo, New York.
Birkmann J (2007). Risk and vulnerability indicators at different scales: Applicability, usefulness and policy implications. Environmental Hazards 7 (2007) 20-31
Bollin C, Hidajat R (2006). Community-based disaster risk index: pilot implementation in Indonesia. In: Birkmann, J. (Ed.), Measuring Vulnerability to Natural Hazards-Towards Disaster Resilient Societies. UNU-Press, Tokyo, New York, Paris
CAPRA (2013). Probabilistic Risk Assessment Program URL http://www.ecapra.org/
Coppock, JT (1995) GIS and natural hazards: an overview from a GIS perspective. In: Carrara A and Guzzetti F (eds) Geographical Information Systems in Assessing Natural Hazards. Volume 5 of the series Advances in Natural and Technological Hazards Research pp 21-34
Corominas J, van Westen CJ, Frattini P, Cascini L, Malet J-P, Fotopoulou S, Catani F, van den Eeckhaut M, Mavrouli O, Agliardi F, Pitilakis K, Winter MG, Pastor M, Ferlisi S, Tofani V, Hervas J, Smith JT (2014) Recommendations for the quantitative analysis of landslide risk : open access. In: Bulletin of engineering geology and the environment IAEG, 73 (2014)2 pp. 209-263
Cova TJ (1999) GIS in emergency management. In Geographical Information Systems: Principles, Techniques, Applications, 2nd Edition: Management Issues and Applications, Edited by: Longley (Eds) P. A.
DeGraff JV (2012) Solving the dilemma of transforming landslide hazard maps into effective policy and regulations, Nat. Hazards Earth Syst. Sci., 12, 53-60
EC (2011). Risk assessment and mapping guidelines for disaster management. European Commission Commission staff working paper, European Union.
FEMA (2004). HAZUS-MH. FEMA's Methodology for Estimating Potential Losses from Disasters. US Federal Emergency Management Agency. http://www.fema.gov/plan/prevent/hazus/index.shtm
Garcia-Aristizabal A, Marzocchi W (2013). Software for multi-hazard assessment. Deliverable 3.5 of the EU Matrix project: New methodologies for multi-hazard and multi-risk assessment methods for Europe. URL: http://matrix.gpi.kit.edu/downloads/MATRIX-D3.05.pdf.
Granger K, Jones TG, Leiba M, Scott G, (1999).Community risk in Cairns: a multi-hazards risk assessment. Technical report, Australian Geological Survey Organisation (AGSO) URL http://www.ga.gov.au/corporate_data/33548/33548.pdf.
Greiving S, Fleischhauer M, Luckenkotter, J. (2006) A Methodology for an integrated risk assessment of spatially relevant hazards, Journal of Environmental Planning and Management, 49:1, 1-19
Guha-Sapir D, Below R, Hoyois Ph (2016) - EM-DAT: The CRED/OFDA International Disaster Database - www.emdat.be - Universite Catholique de Louvain - Brussels - Belgium.
Haimes YY (2009) Risk Modeling, Assessment, and Management. 3rd Edition. John Wiley & Sons, 1009 p
IRDR (2014) Integrated Research on Disaster Risk. Peril Classification and Hazard Glossary (IRDR DATA Publication No. 1). Beijing: Integrated Research on Disaster Risk. http://www.irdrinternational.org/wp-content/uploads/2014/04/IRDR_DATA-Project-Report-No.-1.pdf
ISO 31000 Risk Management - Principles and guidelines. URL: http://www.iso.org/iso/home/standards/iso31000.htm
Jaboyedoff M, Aye ZC, Derron M-H, Nicolet P, Olyazadeh R. (2014) Using the consequence - frequency matrix to reduce the risk: examples and teaching. International Conference Analysis and Management of Changing Risks for Natural Hazards 18-19 November 2014, Padua, Italy
Jonkman, SN, Van Gelder P, and Vrijling H (2002). An overview of quantitative risk measures and their application for calculation of flood risk. µ13 - ESREL 2002 European Conference
Kappes MS, Keiler M, Von Elverfeldt K, Glade T, (2012). Challenges of analyzing multi-hazard Risk: A Review. Natural Hazards 64(2), 1925-1958
OAS (1991) Geographic Information Systems In Natural Hazard Management. Organization of American States. Primer on Natural Hazard Management in Integrated Regional Development Planning https://www.oas.org/dsd/publications/Unit/oea66e/ch05.htm
Peila D, Guardini C (2008) Use of the event tree to assess the risk reduction obtained from rockfall protection devices. Nat. Hazards Earth Syst. Sci., 8, 1441-1450, 2008
Prinos P (2008). Review of Flood Hazard Mapping. European Community Sixth Framework Programme for European Research and Technological Development. FLOODsite.
Roberts NJ, Nadim F, Kalsnes B (2009). Quantification of vulnerability to natural hazards. Georisk: Assessment and Management of Risk for Engineered Systems and Geohazards, 3 (3), 2009, 164-173
Schmidt J, Matcham I, Reese S, King A, Bell R, Henderson R, Smart G, Cousins J, Smith W, Heron D, (2011). Quantitative multi-risk analysis for natural hazards: a framework for multi-risk modelling. Natural Hazards 58(3), 1169-1192
Schneider PJ, Schauer BA, (2006). HAZUS, its development and its future. Natural Hazards Review 7(2), 40-44.
UN-ISDR (2009). Terminology on Disaster risk Reduction. URL: https://www.unisdr.org/we/inform/terminology
Van Westen CJ, Castellanos Abella EA and Sekhar LK (2008) Spatial data for landslide susceptibility, hazards and vulnerability assessment : an overview. In: Engineering geology, 102 (2008)3-4 pp. 112-131.
Van Westen CJ, Straatsma MW, Turdukulov UD, Feringa WF, Sijmons K, Bakhtadze K, Janelidze T, Kheladze N. (2012) Atlas of natural hazards and risks of Georgia : e-book. Tbilisi, Caucasus Environmental NGO Network (CENN), University of Twente Faculty of Geo-Information and Earth Observation (ITC), 2012. ISBN: 978-9941-0-4310-9.
Van Westen CJ (2013). Remote sensing and GIS for natural hazards assessment and disaster risk management. In: Shroder, J. (Editor in Chief), Bishop, M.P. (Ed.), Treatise on Geomorphology. Academic Press, San Diego, CA, vol. 3, Remote Sensing and GIScience in Geomorphology, pp. 259-298.