

Introduction for Digital Elevation Models
In this section, the digital elevation models will be introduced. By clicking the image"Introduction to DEMs", a summary presentation will be opened.
The definition of DEM
A Digital Elevation Model (DEM) is a digital model or three dimensional (3D) representation of a terrain's surface created from elevation data. The term DEM was introduced in the 1970s with the purpose of distinguishing the simplest form of terrain relief modelling from more complex types of digital surface representation. Originally the term DEM was exclusively used for raster representations (thus elevation values given at the intersection nodes of a regular grid).
Digital Terrain Model (DTM) is a DEM of the shape of the ground surface. Digital Surface Model (DSM) is a DEM of the shape of the surface, including vegetation, infra-structures etc (See Figure 1). Both a DTM and DSM can be a DEM and, moreover, " elevation" would not have to relate to terrain but could relate to some subsurface layer such as groundwater layers, soil layers or the ocean floor.
Different sources of elevation data
- Point elevation data
- Contour and stream-line data
- Space-borne and air-borne remotely sensed elevation data
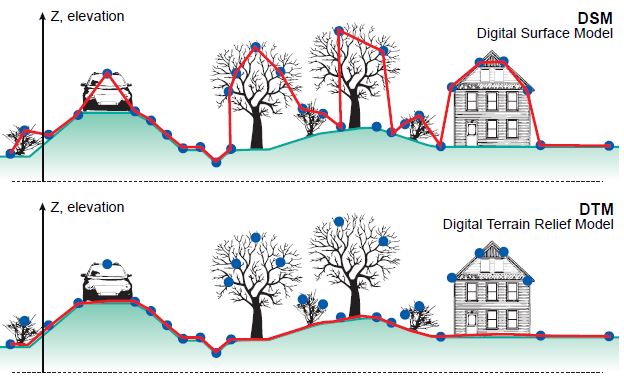
Figure 1: the difference between DSM and DTM.
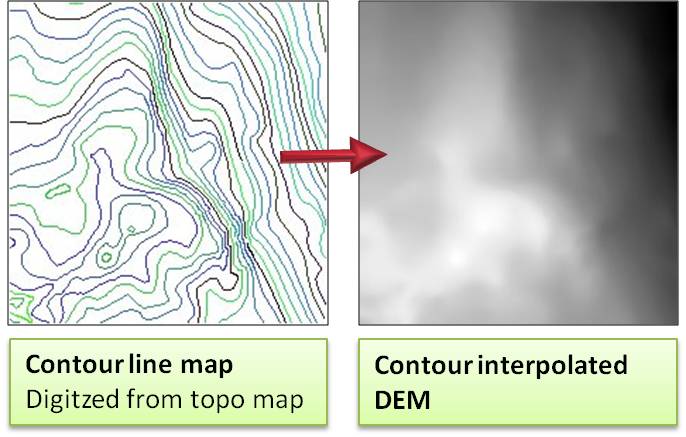
As topography is one of the major factors in most types of hazard analysis, the generation of a Digital Elevation Model (DEM) plays a major role. Digital Elevation Models (DEMs) can be derived through a variety of techniques, such as digitizing contours from existing topographic maps, topographic levelling, EDM (Electronic Distance Measurement), differential GPS measurements, (digital) photogrammetry, Radar remote sensing (InSAR), and Light Detection and Ranging (LiDAR). . Many derivate maps can be produced from DEMs using fairly simple GIS operations. These days a wide range of data sources can be selected for the generation of DEMs. The selection depends on the data availability for a specific area, the price and the application.
 |
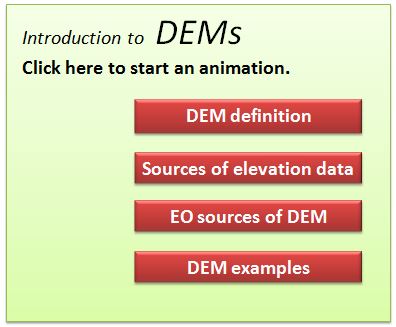 |
Figure 2:Contour line map to generate the DEM.
EO sources of Digital Elevation Models
Stereoscopic 3-D images (aerial photos, optical satellite images)
Various optical satellite sensors are used for DEM generation, such as Quickbird, IKONOS (2-5 m resolution), the Pleiades 1A / 1B constellation (1m. resolution), WoldView-2 and GeoEye-2 (1-2 m resolution), the Japanese Advanced Land Observing Satellite (ALOS) PRISM (2.5 m), Indian Cartosat (2.5 m), the French SPOT satellite (5-10m), and ASTER (15-30m). Most of these have been used in hazard assessment studies, at local or smaller scale.
A very useful source for world-wide medium resolution (30 m) free DEM data is the Advanced Spaceborne Thermal Emission and Reflection Radiometer (ASTER), launched in 1999, which carries 15 channels, with 4 bands at 15 m resolution, 6 at 60m, and 5 at 90m. The VNIR sensor has in total four bands, of which one is back-ward looking, allowing the generation of DEMs with a pixel resolution of 15 m and a vertical accuracy less than 20 meters. The DEMs generated from ASTER images are now freely available through the ASTER GDEM programme.
The application of DEMs from very high resolution images (Quickbird or IKONOS) in detailed studies is hampered by the high acquisition costs (30-50 USD/km2). The recently launched high resolution data from PRISM (ALOS) and CARTOSAT-1, both with 2.5 m resolution, both with two panchromatic cameras that allow for near simultaneous imaging of the same area from two different angles (along track stereo) are able to produce highly accurate Digital Elevation Models, at costs lower than 10 USD/km2.
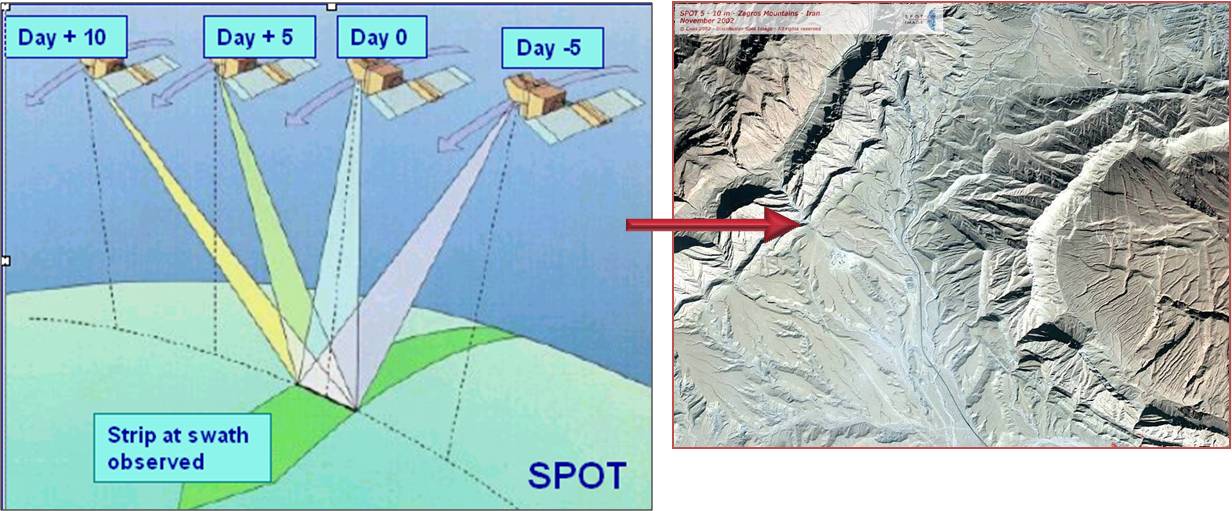
Figure 3: SPOT 5 Stereo capability and the DEM.
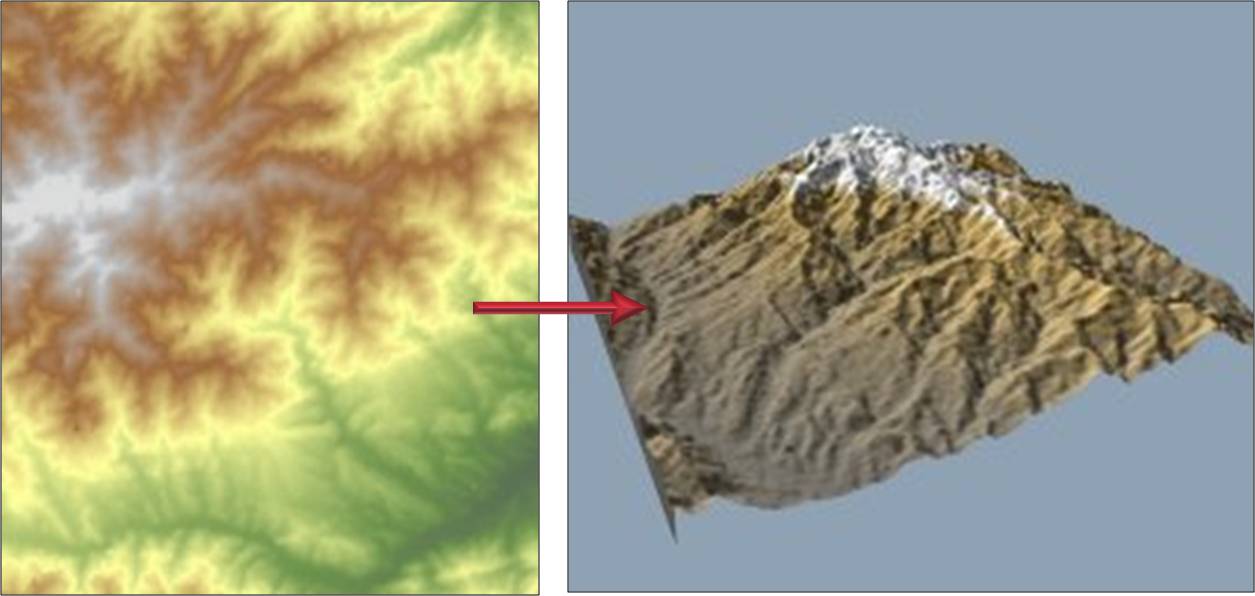
Figure 4: Aster DEM.
Radar (SRTM & Terra SAR-x)
DEMs are also derived using radar satellites such as RADARSAT, TerraSAR-X, ALOS PALSAR, ERS-1 and 2, ENVISAT). Synthetic Aperture Radar Interferometry (InSAR) can be used for the generation of Digital Elevation Models, but in practice it is mostly used for detecting changes in topographic heights, related to different hazardous geological processes, such as land subsidence, slow moving landslides, tectonic motions, ice movement and volcanic activity. Multi-temporal InSAR analyses using techniques such as the Permanent Scatterers (PSInSAR), PSP (Persistent Scatterers Pairs) and SBAS (Small Base-line Subset) can be used to measure displacement of permanent scatterers such as buildings with millimetre accuracy, and allow the reconstruction of the deformation history. WorldDEM is a consistent DEM of the Earth" ™s entire land surface, with vertical accuracy of 2m (relative) and 4m (absolute), within a horizontal raster of approximately 12x12 square meters.
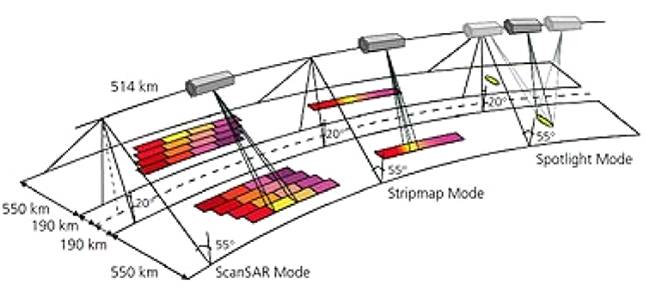
Figure 5: Terra SAR-X.
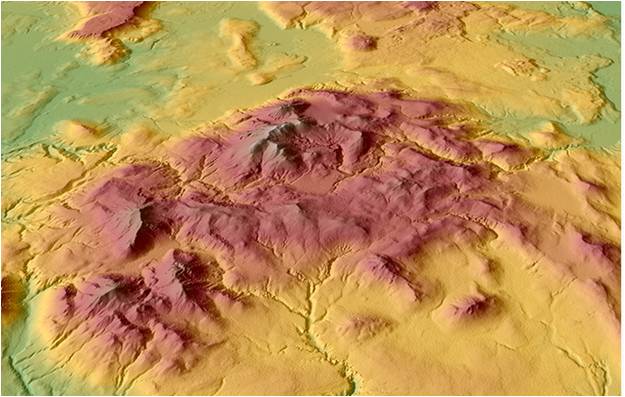
Figure 6:the WorldDEM. (Click on the image to watch a video)
Airborne Laser Scanning (LiDAR)
More detailed DEMs are nowadays derived using LiDAR (Light Detection And Ranging). Normally LiDAR point measurements will render so-called Digital Surface Models (DSM), which contains information on all objects of the Earth" ™s surface, including buildings, trees etc. Through sophisticated algorithms, and final manual editing, the landscape elements are removed and a Digital Terrain Model (DTM) is generated. The difference between a DSM and the DTM can also provide very useful information, e.g., on buildings heights, the vegetation canopy height etc. LiDAR has become the standard method for the generation of high resolution DEMs in many developed countries already and it is likely that most countries will be having LiDAR derived DEMs within a decade or so. LiDAR can measure distances very precisely and very frequently; therefore a DSM with a high density of points can be obtained with accurate elevation values. The attainable elevation (vertical coordinate) accuracy with LiDAR can be in the order of 3 cm for well-defined target surfaces. The average costs of LiDAR ranges from 300 " “ 800 US$/km2 depending on the required point density. LiDAR data can be acquired through airborne or terrestrial instruments. Airborne LIDAR is used extensively for geomorphologic mapping and terrain classification. Airborne LIDAR data can be applied to glacial hazards coastal hazards, flood modeling, soil erosion hazard and landslide hazard assessment.
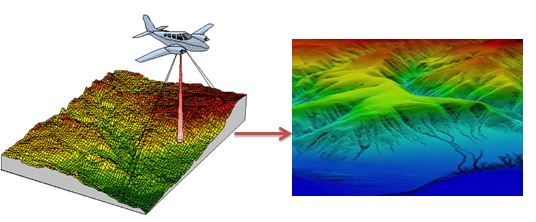
Figure 6: LiDAR and the DEM. (Click on the image to watch a video)
Digital Elevation Model application
By clicking the image about "Introduction to digital elevation model application", a summary presentation will be opened.
Derivatives from DEMs can be used in heuristic analysis at small scales (e.g. hill-shading images for display as backdrop image, physiographic classification, internal relief, drainage density), in statistical analysis at regional scales (e.g. altitude zones, slope gradient, slope direction, contributing area, plan curvature, profile curvature, slope length), in physically-based modelling at local scales (local drain direction, flow path, slope gradient) and in spread modelling (detailed slope morphology, flow path) (Moore et al., 2001). The use of slope gradient maps in hazard assessment is greatly affected by the resolution of the DEM (Zhou and Liu, 2004). As a general rule of thumb the use of slope gradient maps is not advisable for small scale studies (Van Westen et al., 2008). In larger scale studies slope maps, and other DEM derivatives such as aspect, slope length, slope shape etc. can be used as input factors for heuristic or statistical analysis. In local and site investigation scale hazard assessment, DEMs are used in slope hydrology modelling and slope maps are used for physically-based modelling (Kuriakose et al., 2009a).
In table 1 an overview is given of advised DEM resolutions and Earth Observation sources for topographical mapping and the assessment of hazards and elements at risk. In case of the presence of clouds in the higher parts of the terrain, use should be made of radar sources, such as the freely available SRTM (30 m. resolution) or the more expensive WorldDEM data, derived from the Terra-SAR-x radar sensor (12 m. resolution). In the cloud free lower terrains, also optical EO can be applied, such as SPOT 5, WolrdView-2 and GeoEye-2, stereoscopic aerial-photo derived DEMs or point data of the active LiDAR system.
Details on the EO systems for DEM generation can be found in Chapter 3.3 on Satellite Data. The methods of quality assessments of DEMs to be used for certain applications in the Carribean is described in Use Case 9.2 on Generation of Digital Elevation Models.
Table 1 DEM sources for different applications at different scales
|
Application |
Mapping scale |
Specification |
EO S EO sources |
Remarks |
|
|---|---|---|---|---|---|
|
|
|
Horizontal (resolution) |
Vertical (Accuracy) |
|
|
|
- Topographic mapping
|
1:200.000 |
30 m. |
1 m. |
SRTM, ASTER |
Free download |
|
1:50.000 |
10-15 m. |
1 m. |
WorldDEM / Terra SAR-x, SPOT 5 |
DEM Derivatives :
|
|
|
1:10.000 |
5 m. or < |
1 m. |
Aerial photo, LiDAR WorldView2 / GeoEye2 |
||
|
1:5.000 or larger |
1 m. |
1 - 0.5 m. |
Aerial photo, LiDAR |
||
|
- Flood modelling |
1: 5.000 or larger |
0.5 - 1 m. |
0.5 m or < |
LiDAR DTM/ DSM |
DEM Derivatives:
|
|
1:2.000 or larger |
0.5 m. or < |
0.5 m. or < |
LiDAR DTM |
|
|
1:2.000 or larger |
0.5 m. or < |
0.5 m. or < |
LiDAR DTM |
|
|
1:2.000 or larger |
0.5 m. or < |
0.5 m. or < |
LiDAR DTM |
|
|
- Elements at risk mapping |
1:2.000 or larger |
0.5 m. or < |
0.5 m. or < |
LiDAR DSM |
DEM Derivatives:
|
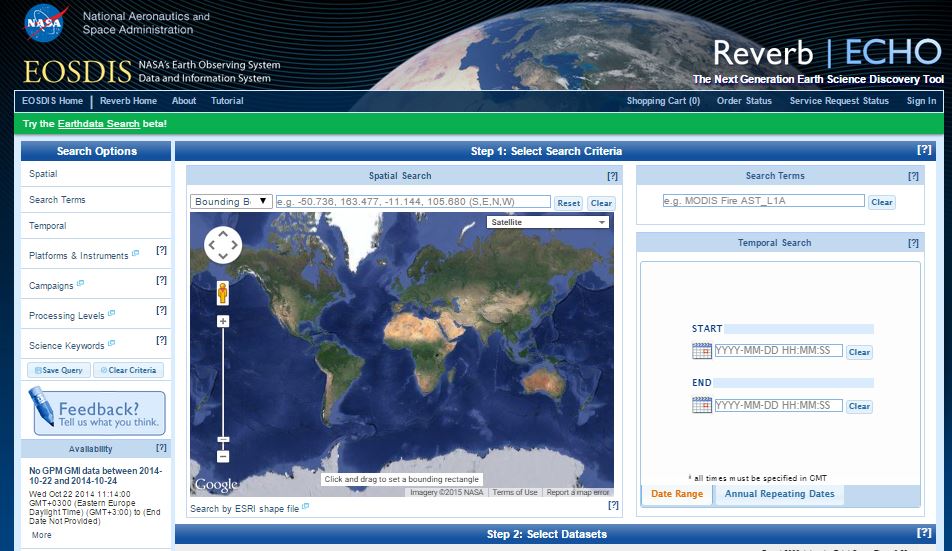
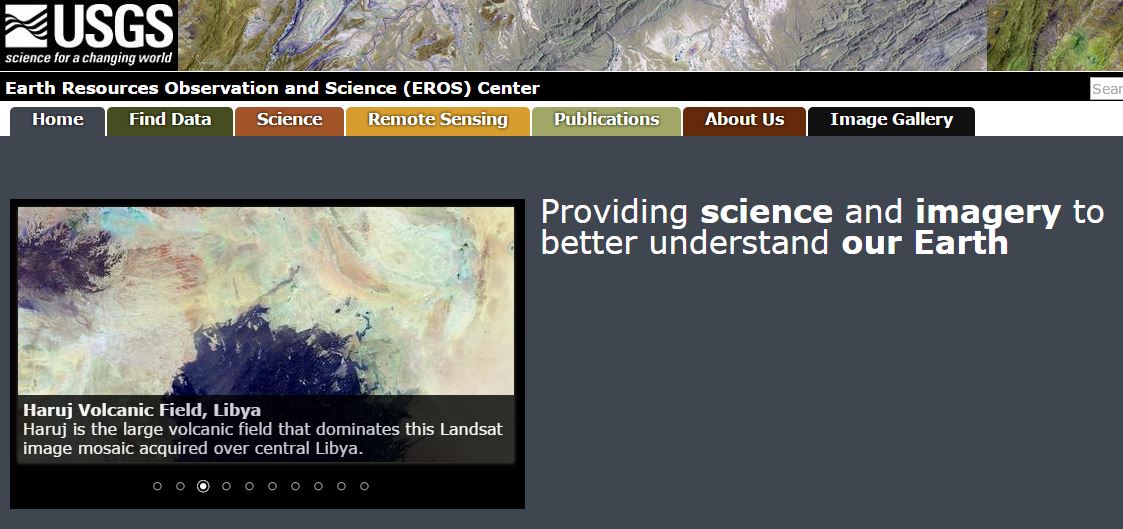
Access Digital Elevation Model
Below are links to internet resources where DEMs can be downloaded.
 |
 |
ASTER GDEM: http://asterweb.jpl.nasa.gov/gdem.asp
SRTM: http://www2.jpl.nasa.gov/srtm/
WorldDEMTM: http://www.geo-airbusds.com/worlddem/
GTOPO30: https://lta.cr.usgs.gov/GTOPO30