

Summary
In this chapter, Digital Elevation Models (DEMs) are reviewed. Areas discussed are: data sources; methods in creating DEMs; and considerations in evaluating their suitability for hydrologic modeling and/or geomorphologic applications.
Use case intended for: Planner Spatial analist
Keywords:
Digital Elevation Model (DEM)
| Before you start: | Use case Location: | Uses GIS data: | Authors: |
|---|---|---|---|
| To carry out some of the analysis in this Use Case, basic GIS skills are required along with an understanding of Digital Elevation Models (DEMs). The reader is asked to refer to Section 3.2 of the Data Management Book for basic background information on DEMs. In the example, both software ARCGIS and IlWIS are used. Download IlWIS. | St. Lucia | Yes, a boundary dataset; topographic data; high resolution imagery; water courses dataset; SRTM DEM and validation points |
Tarick Hosein |
Introduction:
The use of DEMs has enabled modern environmental modellers to better obtain qualitative and quantitative information in many earth science, physical development and disaster management disciplines. The wider scope of DEM applications include contour and topographic mapping; hydrological and flood simulations; geomorphology change detection and monitoring; orthophoto rectification of aerial and satellite images; 3D visualizations and many more. Within each field of application, the type of DEM, the method by which it was developed and its original data source are important for understanding the quality of the DEM. As a major investment in any GIS, DEMs require additional consideration beyond that of other datasets. Unlike most data themes, elevation data will form the bases for many calculations and creation of other datasets.
Objectives:
The overall objective of this use case is to provide an understanding of DEM generation and an appreciation of key indicators of qualitative and quantitative quality assessments that should be undertaken to ensure that a DEM has been created correctly. Prior to the example, the reader will be given an introduction into DEM sources outlining the data formats, interpolation methodology, limitation and availability. The use case is presented in the form of an example demonstrating the key considerations in assessing DEM quality before acceptance and use in GIS related work.
Flowchart:
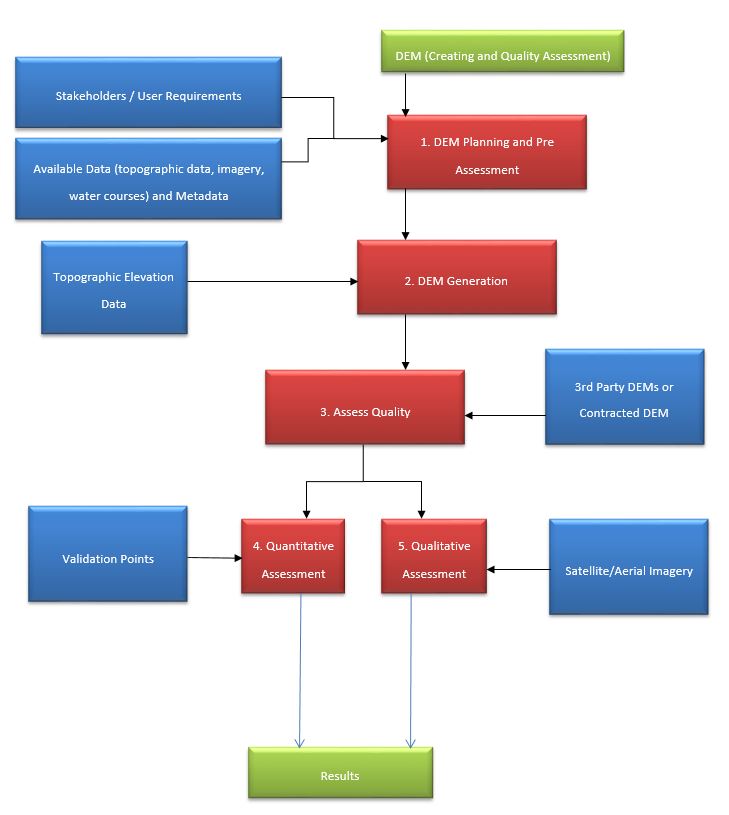
Problems definition and specifications:
Topographic data may be used to create a DEM, or a DEM may have been obtained from a contractor or other third party. Before using, the DEM should be independently assessed for its quality in terms of qualitative and quantitative characteristics in order to determine its fitness for a particular use. Since the DEM is a major data necessity for many earth based modeling situations, it is imperative that the users know the requirements of the intended application, and the limitation of any created/available DEMs.
In this regard, the DEM is influenced by the following:
- Technology/methodology
- Data Format
- Interpolation
This means that in order to decide on a DEM, the limitation of the method used to capture the topographic data, the nature of the data and the data processing methodology must be considered. In principle, DEMs are separated into two categories; Digital Surface Model (DSM), representing the top surface elevation of features; and Digital Terrain Model (DTM) representing the elevation of the bare-earth's surface devoid of all vegetation and man-made structures.
Data requirements:
In order to assess the quality of a DEM, three main factors should be considered:
- The quality of the DEM must be defined by statistical positional accuracies.
- The quality of the DEM should be evaluated in terms of qualitative expectation.
- The quality of the DEM should be evaluated in terms of fitness of use based on the application.
It should be noted that the first factor is a requirement for any DEM. Each DEM developer, whether internal or external (contracted) must state the positional accuracy of the DEM. The data required will depend on the quality assessment undertaken, as shown in Table 1.
|
Quality Matrix |
Data Requirements |
Software Requirements |
Notes |
|---|---|---|---|
|
Quantitative/ Statistical |
|
None Required. |
|
|
Qualitative |
|
Any GIS software capable of overlays. |
|
|
Fitness for use |
Vector data of DEM derivatives and/or Image/Orthophoto
|
Any GIS software capable of extracting DEM derivatives and possibly capable of 3D rendering.
|
|
Table 1: Qualitative Assessments
Analysis steps:
These analysis steps are presented as an accumulation of the testing methodology.
General Application
1. DEM Planning (To be guided by the consultant and stakeholders)
a. Stakeholder Involvement and Selection of DEM types
There is no one fit solutions in selecting the right DEM. A DEM used to create a high resolution orthophoto is not suitable for flood modeling without modification. DEMs required for large scale (high resolution) modeling are different than those required for larger areas. The choice of DEM varies depending on the applications and scale of analysis. As a national dataset, the DEM must be able to meet the requirements of the stakeholders, either directly or with manipulation; as such, it is always good to identify the needs of the users and applications before developing TORs for DEM acquisition.
b. Selection of DEM Source
DEMs can be generated from the following sources:
- Ground Surveys
- Manual photogrammetric stereo methods
- Automatic topographic extraction from images (satellite images, aerial photographs)
- Digitizing from existing topographic contour data
- Laser scanning
- Radar Interferometry
Each DEM has its advantages and challenges. Table 2 summarizes some of the common data formats, interpolators, limitations and availability of the DEM/Data Sources.
|
Method |
Data format |
Interpolation |
Limitations |
Availability |
|---|---|---|---|---|
|
Ground surveys |
Elevation points |
Usually interpolated using TIN |
Not suitable for large areas. Problems with TIN interpolations |
For small areas, not at a country level |
|
Airborne photogrammetric surveys - manual interpretation |
Contours and measured points |
Kriging |
Problems with vegetation and measurement frequency |
Require aerial photography and skilled operators |
|
Airborne photogrammetric surveys - automatic interpretation |
Correlated points |
Kriging |
Problems with non-ground points. Point spacing is usually medium resolution (10 - 30m). Problems with vegetation. |
Require aerial photography. DSM product. |
|
Existing topographic map data |
Primarily contours |
Kriging |
Considered a secondary source, with no information regarding accuracy. Usually produces medium resolution DEMs (~30m) Added errors with digitizing |
Readily available and can be done relatively cheaply |
|
Airborne laser scanning (LiDAR) |
Point Clouds - segmented to separate bare ground and top of vegetation. |
Inverse Distance Weights IDW or Kriging used for interpolation of segmented point cloud |
Problems may occur with steep slopes and heavy vegetated areas |
For small islands, the cost of acquisition approximated that of photogrammetry. Aerial imagery can be done concurrently for a small cost difference. High resolution DEM, DSM and DTM can be requested as products |
|
Automated Stereoscopic based satellite imagery
|
Correlated points |
Filtering is required of the points, as correlation is surface points |
Problem with non-ground points. Usually produces medium resolution DEMs (30-50m). Problems with vegetation. Problem with clouds. |
Done at a fraction of the cost of photogrammetry. Resolution is much lower. 30m Aster DSM freely available. |
|
Radar based satellite imagery |
Raster DEM |
None |
Problems with vegetation and steep slopes |
Cost is lower than photogrammetry. High resolution possible, but lower than LiDAR. 30m SRTM DSM freely available. |
Table 2: Source Data and Limitations
2. Guideline for creating DEMs
a. Selection of topographic data and method
As outlined in table 2, some methods produce raster DEMs, however other methods will require the analyst to manipulate and interpolate the data to create the DEM. Ground surveying is not suitable for mass data collection and is not used for large areas. Most LiDAR ToRs will require the contractor to create general DEMs and if needed, specific hydrologic enforced DEMs.
Contours drawn by stereo photogrammetry are generally good representation of the ground. Such contours are directly drawn by the operator; the heights of the contours are adjusted over vegetated areas using average tree heights. If done in the digital environment (using digital or scanned images and plotted using a digital workstation), the contour lines can be interpolated to produce the DEM. Otherwise, if the paper maps are the source of the contours, then the contour will need to be first digitized. In both cases, the contours are considered appropriate for medium resolution DEMs in the order of 30-50 meters. However, interpolation of the contours generally creates artifacts in the form of terraces in the DEM. Such artifacts will have adverse effects in flood and landslide modeling.
Some precautions should be applied when dealing with automated extraction from stereo satellite image and digital images including those captured from drones. This method usually gives either a grid of topographic points or a high density point cloud extraction. Spot elevations derived from these methods produce topographic points on the surface of objects. Before such points can be interpolated, points must be filtered to remove surface points. Points over vegetated areas may be used, but must be corrected for vegetation heights. Although, recommendations for the interpolation of DEMs were made in Table 2, this is only for general guidance; exceptions may include the intended applications of the DEM and the software.
b. Review of the Metadata
Before using or creating a DEM, appropriate documentation should be reviewed. In most cases, most information should be found in the metadata. The date of the data, the methodology used to acquire and process the data, and the accuracy are all key aspects that will guide if the DEM is appropriate for the intended application, or if it can be modified to meet the needs of the applications.
c. Data Inspection and Mining
It is recommended that the DEM and/or data be inspected before using. Inspection can be as simple as qualitative overlaying of points onto a raster image and/or quantitative inspections of the data to determine distribution, density and identify potential outliers. Hillshades and 3D draping of the DEMs may also be used to look for outliers.
d. Creating A DEM
If a DEM is not available, and the user must create a DEM, then the following considerations should be reviewed:
- The source data
- The interpolation method
- An appropriate software
- Are breaklines important? If so, from where or how will they be obtained?
- Is a hydroenforced DEM required? If so, from where or how will they be obtained?
Creating the DEM is predominately dependent on the interpolation methodology. Breaklines and other boundary constraints, such as island coastline, will improve the DEM. Most software will compute an appropriate average grid spacing for the DEM depending on the distribution of the interpolated data. Depending on the data, breaklines may be important, especially when dealing with the edges of rapid changes of topography. In the case of hydrologic modeling, hydroenforced DEMs are important. These DEMs ensure that water flow in the water channel correctly. Most good GIS software will have functions to ensure that water flows along a defined water course. This will require a water course dataset, ideally with thalweg elevations, cross sectional profiles and digitized in the direction of flow. With or without elevation and cross sectional profile information, at least the planimetric map information of the water course should be used; this can be created by high resolution imagery digitizing.
3. Quantitative Accuracy Assessment (Should be checked by receiving agency or Consultant)
a. Absolute Accuracy Assessment
This is the typical assessment done to validate most DEMs. It is expected that all contractors developing a DEM would have done such an assessment, a report of which should be requested in the ToR. However, it is suggested that the DEM be independently verified by the receiving agency or their consultant. Such assessments will use control data in the form of check points whose elevations have been measured independently. The measurement method and results should be compatible with the vertical measurement accuracy.
The most common method of reporting the accuracy of DEMs is in terms of root mean square (RMS) error. It should be noted that the current recommendation for checking accuracy calls for the use of at least 25 control points. The numbers become more important with the diversity of landcover and sloped topography. The ASPRS (2014) recommends the use of at least 20 points, on non vegetated regions, and at least 5 points, in vegetated regions, for an area of 500 Km2 or less. The RMSe is computed using the equation
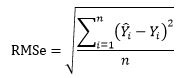 ,
,
where refers to the estimated elevation of the control point, while Yi is the values measured on the DEM. In addition, some DEMs reporting may include measurements of bias, which is essentially a systematic shift of values measured by Bias
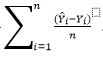 .
.
As previously stated, validation points should be measured using a more accurate method. In general the points need to be at least three times higher accuracy than the DEM. However, the selection of the location of the points need to be carefully considered, especially in steep terrain.
The following recommendations should be considered:
- Validation campaigns by the DEM contractor may not reflect the variations of topography and landcover, unless required in the ToR.
- The check points should be measured at locations which are relatively flat and/or on terraces.
- Points near sudden changes of terrain, for example along a bridge, should be avoided.
- The ground should be undisrupted between the time of observation and positioning of the check point.
- The use of GPS for observations will be restricted only to areas with a clear view of the sky; however the check points should reflect the variations of topography and landcover.
- Good documentation should be kept of the points, observations and reductions.
b. Comparative Assessments
It is also acceptable to assess DEMs by comparing against another, more accurate, DEM. It may also be used if the interest is in a relative comparison of the DEM and not the absolute accuracy.
However, the availability of high resolution and accurate DEMs are limited, and this method is generally unsuitable for small islands states.
While there are some challenges to DEM to DEM comparisons, it is common to find comparisons of their derivatives, especially as they relate to applications. For instance, slopes, contours, aspect, drainage characteristics and other derivatives.
4. Qualitative Accuracy Assessment (Should be done by user or Consultant)
It is useful to look beyond the statistical comparisons and evaluate DEMs on their expression of their surface. Qualitative assessment is visual inspections used to reveal faults in the landform expression and its derivatives. Assessments may include the use of 3D visualizations draped with imagery, printed topographic maps viewed in 3D using the DEM and comparing the printed contours, or as complex as generated/extracted watercourses overlaid onto topographic or imagery data. In essence this assessment gives an expectation of how well the DEM models reality and how fit for use it may be.
Example applications
In this case example, topographic data for St. Lucia is processed. The data is obtained from a National GIS Dataset developed by Fugro EarthData, Inc. in 2009 based on high resolution photography. Table 3 outlines the data and their sources. Images below are displayed using Global Mapper, but processing is done in ArcGIS and Ilwis.
|
1. Coastline, shown as red - St. Lucia National GIS Dataset. |
|
|
2. Topographic Points, shown as black points. - St. Lucia National GIS Dataset. |
|
|
3. High resolution or thophoto - St. Lucia National GIS Dataset |
|
|
4. Water courses - St. Lucia National GIS Dataset.
|
|
|
5. 3rd party DEM. 30m vegetation corrected Digital Elevation Model (DEM) from the Shuttle Radar Topography Mission (SRTM). (USGS, 2012)
|
|
|
6. Validation check points. Due to the limitations of time and resources, unverified check points were used.
|
|
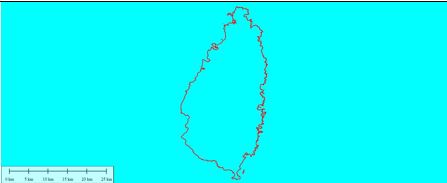
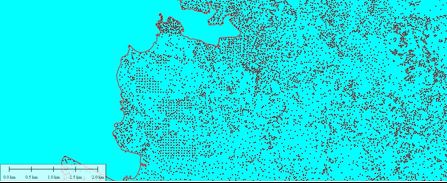
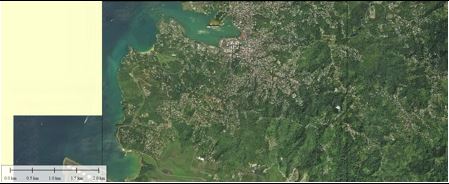
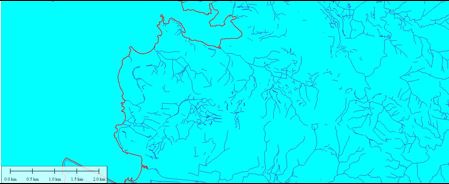
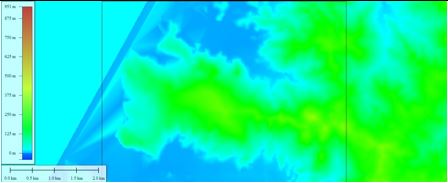
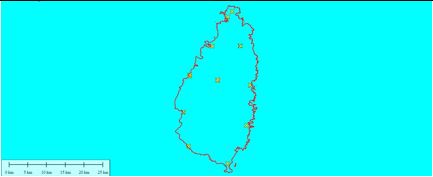
Table 3: Data required and their sources
1. DEM Development
Review of the 2009 National GIS Dataset metadata revealed that the datasets were developed from high resolution photography. Horizontal accuracy was reported to be better than 60cm, while the vertical accuracy was better than 80cm. The methodology for DEM creation was based on autocorrelation of points in the overlapping photography producing a DSM. The DSM was used to rectify the orthophoto. Topographic points were submitted as a separate dataset. Details of this layer were not explicit, but overlaying the points onto the orthophoto suggested that some filtering and corrections were done to the dataset.
An overlay of the points onto the orthophoto shows that the distribution of the points is uneven, and the points are surface points representing terrain, top of trees and buildings as shown in Figure 1. If points are found to be wrong, they should be selected and removed prior to processing. Inspections of the elevations for outliers found that some points had extremely low elevations of 45m below datum; Figure 2 shows that these points were located in a mine or excavated dam, which is realistic. Inspection of the water courses and breaklines found that both are geographically correct. The water courses are found to be correctly overlaid onto the orthophoto, while the breaklines were along the water courses and changes of terrain. However, there were some possible missing water courses, and also some of the paths were incomplete and disjointed.
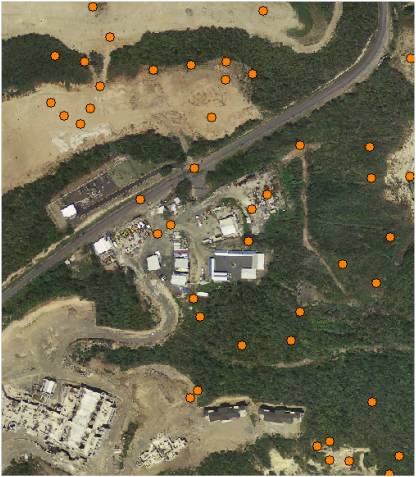
Figure 1: DSM Points
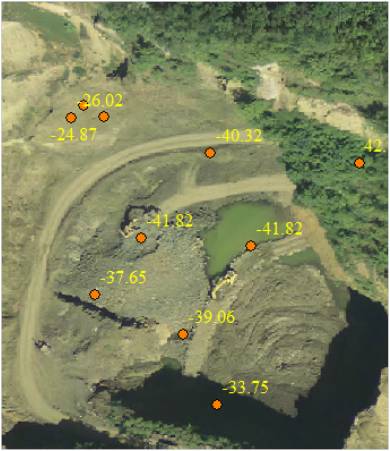
Figure 2: Low Elevation Points
In the example, the " Topo to Raster" module in ArcGIS is used for the interpolation of the topographic points and the optimization of the DEM by integrating coastline, rivers/water courses, and breaklines to the topographic data. Figure 3, shows the workflow applied to create the hydrologically correct DEM.
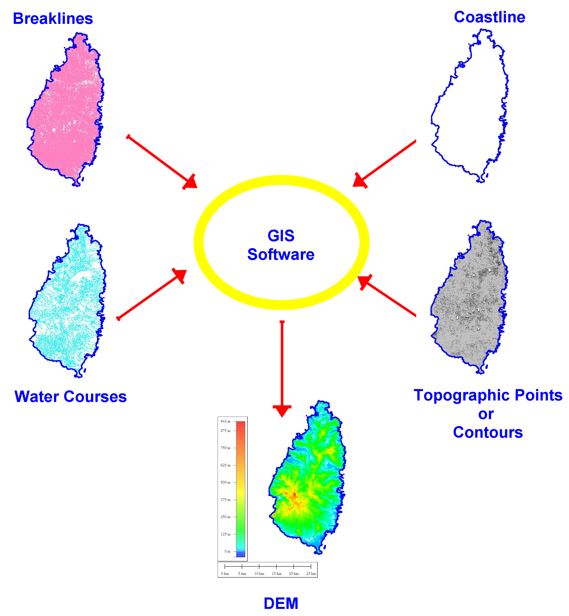
Figure 3: DEM development workflow
2. DEM Enhancement
DEMs that are already created, such as the SRTM DEM, may need to be modified to become more hydrologically optimized. The optimization will improve on its hydrologic expression and allow for better modeling of runoff. For this procedure, the DEM optimization function in Ilwis is used. The function effectively burns the defined watercourses into the DEM. Figure 4 shows the workflow for this procedure. The outcome can further be improved by incorporating field survey information of the water courses.
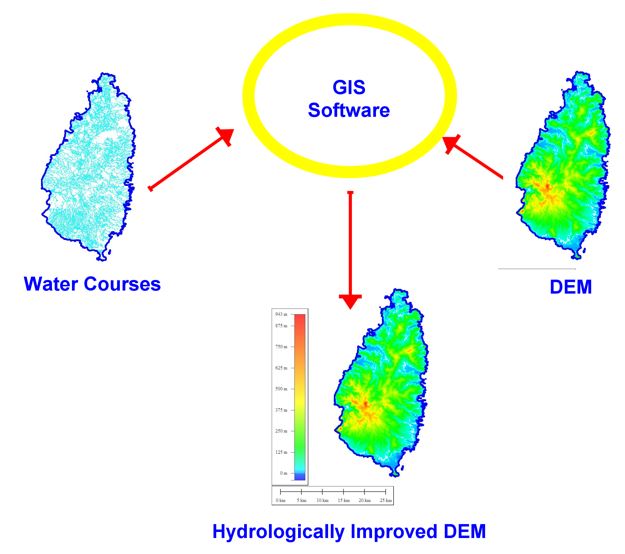
Figure 4: DEM enhancement workflow
Results:
In the use case two DEMs were presented for inspection. The first DEM is one created using topographic point information derived from photogrammetry. The second DEM is based on the global SRTM DEM and used in the case study to represent a third party DEM, where the user must evaluate its accuracy before using. The validation analysis of both DEMs found that the created DEM had an RMSe of 80cm with 95% confidence; however this was limited to 13 points, with 5 points rejected for having large residuals. The SRTM DEM was found to have an RMSe of 14m with 95% confidence. In both cases the DEMs met the expected accuracy as stated in their metadata, with no significant bias.
Although the quantitative assessment met the expectations of the DEMs, the qualitative assessments did not. The software recommended grid size was determined to be 90 meters. A review of the flow paths revealed that water courses were not well modeled as shown in Figure 5.
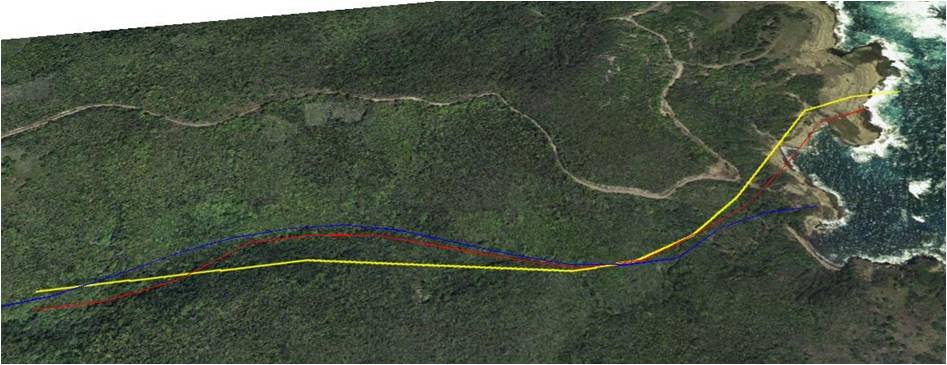
Figure 5: Flow Paths Overlays. Water courses shown in cyan, 90m Topo DEM in yellow, 30m SRTM DEM in red and modified SRTM in green
Conclusions:
In both DEMs tested, the absolute accuracy, as tested in this example is the standard for DEM quality. However, this may be irrelevant to the individual quality of derivatives such as slope, flow direction and accumulation. Different hydrologic modeling software will treat DEMs differently; however the models are highly dependent on good models of slope, flow direction, and flow accumulation. Similarly, DEMs suitable for land stability models must have good expressions of slope. The onus is on the modeler to identify discrepancies and ensure uncertainties in derivatives are budgeted in the models.
Due to the limitations of this study, the following considerations should be given:
- All DEMs used for hydrologic and landslide applications should have good expressions of slope - This is generally not possible with DSMs as there will exist too many local slope expressions between features. As such, surface points should be cleaned to reduce the points to the terrain, as previously stated, this can be done by filtering of the points and vegetation height correction.
- Removal/Filtering of topographic points will reduce the density and possibly reduce the optimum resolution that is recommended by the interpolator.
- DEMs resolutions should not be interpolated less than the software recommended grid sizes.
- The resolving DEM resolution will affect the scale of the analysis; Grid sizes of 10m is considered to be of high resolution in hydrologic and landslide modelling, but for overland flood modelling 5m and better is preferred. The problems with medium and low resolution DEMs was demonstrated in the flow paths shown in figure 4, which were not smooth and displaced because of the resolution.
- Although the case study analyzed topographic points, contour data can also be used; however processing of contours typically create artificial terraces in the DEMs.
- The choice of methodology will depend on the data and method used to capture the information.
- Validation points used in this study were insufficient in number, and locations. Points should be well distributed and of diverse landcover.
- DEMs can be optimized for hydrologic modeling by integrating water channel survey information. This includes the location of the water course, depth, cross sections and width. From both examples it was demonstrated that the information can be added during or after the DEM is made, with the later showing improved modeling.
- While no modifications were made to the water courses, the inspection did find some deficiencies. As the DEM quality may not have been suitable, these should be improved and the DEM remade. The water courses should be digitized again from the high resolution images, with the main flow path digitized from the higher to lower elevations as a continuous entity.
- Metadata and documentation is important in understanding the data, and the limitations of the data.
References:
More detailed resources available online at:
ESRI, 2012. An overview of the Interpolation toolset. http://resources.arcgis.com/en/help/main/10.1/index.html#/An_overview_of_the_Interpolation_tools/009z00000069000000/
ASPRS 2014. ASPRS Positional Accuracy Standards for Digital Geospatial Data. http://www.asprs.org/a/society/committees/standards/ASPRS_Positional_Accuracy_Standards_Edition1_Version100_November2014.pdf
Last update: 01-06- 2016