

This use case belong to a series of use cases dealing with the analysis of changing risk.
In the last (and most complicated) use case of this series users might want to analyze the combined effect of planning decisions they take now in relation to possible future scenarios. In other words, they would like to know which decision is the most "Change-proof". Here both the risk reduction alternatives as well as the possible future scenarios are defined, and for each combination hazard data is used in combination with elements-at-risk data for that particular situation. A matrix is made of alternatives and future years under different scenarios, and you calculate losses and risk for multi-hazard for each combination. This is then used to determine the risk reduction in future years under different scenarios. Also a Cost- Benefit analysis is carried out but now the benefits change through time. Finally also a Multi-Criteria Evaluation can be performed to select the best alternative
Keywords:
Alternatives; risk reduction; scenarios; future years; benefits; costs.
| Before you start: | Use case locations: | Uses GIS data: | Authors: |
|---|---|---|---|
| You can first read the procedure on this web-page before downloading the data-set and software and carry out the hands-on training exercises | The use cases in this chapter are related to a hypothetical situation on one of the small Caribbean islands |
Yes, the uses cases are accompanied by GIS exercises that utlize the ILWIS GIS software Download the data as Zip file (use save link as) Download the software as Zip file (use save link as) |
Cees van Westen |
Introduction:
This part integrates the previous components. It will allow you to analyze which risk reduction alternative is the best change-proof. The analysis follows the following steps:
- Analyse the changes in risk for risk reduction alternatives for the different scenarios in a number of future years (2020, 2030 and 2040);
- Calculate annualized risk for each combination of risk reduction alternative and future year;
- Calculate annualized risk reduction (benefit) for each combination of risk reduction alternative and future year by subtracting the annualized risk with and without the risk reduction alternative;
- Use these different values for annualized risk reduction (benefits) in a cost-benefit analysis that compares risk reduction alternatives by taking inot account their behaviour under different possible future scenarios;
- Determine the most "change proof" risk reduction alternative;
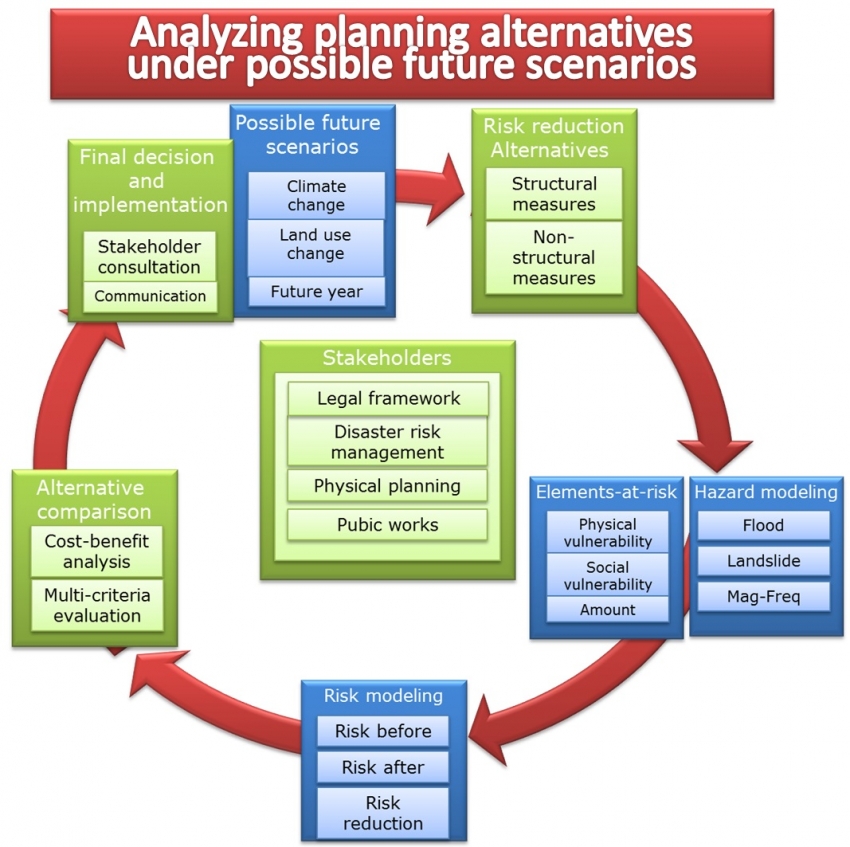
Flowchart:
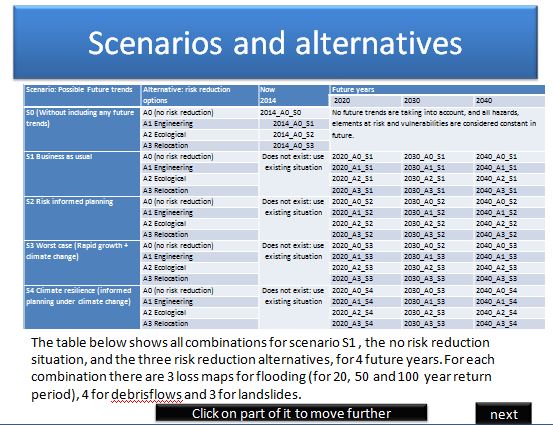
The following animation gives an overview of the data that is used in this use case. The table below shows the combination of possible future scenarios, future reference years, and risk reduction alternatives. You can click on any part of the table to move through the presentation.

Analysis steps:
Step 1: Loss analysis
- Adapt the script Loss_input and add the specific combinations of scenarios, alternatives and future years that you want to analyse.
- The table on the next page shows all the loss combinations that should be calculated for scenario 1 in order to be able to calculate the multi-hazard risk. So for each combination of scenario, future year and alternative we have loss for three hazard types (floods, landslides and debrisflow) and each of these for three return periods (20 , 50 and 100 years). For scenario 2 this would look similarly.
- For scenario 3 the losses are basically the same as for scenario 1, because we are using the same land use scenario, and the same hazard maps. Only the frequency of the hazard events will differ, but this has not effect on the individual losses, but only on the risk
- The Loss_input script might need many lines, with different combinations of scenario, year, alternative, hazard type and return period. You can use a text editor to copy and past, and find&replace text easier.
- Once the Loss_input script is completed, run it. It will take a considerable amount of time, so a coffee break might be useful
- After completion it might be good to copy the result file: Result_LP to another directory as a back-up.
The table below shows all combinations for scenario S1 , the no risk reduction situation, and the three risk reduction alternatives, for 4 future years. For each combination there are 3 loss maps for flooding (for 20, 50 and 100 year return period), 4 for debrisflows and 3 for landslides
|
Scenario: Possible Future trends |
Alternative: risk reduction options |
Future years |
||
|---|---|---|---|---|
|
2020 |
2030 |
2040 |
||
|
S1 Business as usual |
A0 (no risk reduction) |
Flood losses: FL_20_2020_A0_S1_PH FL_50_2020_A0_S1_PH FL_100_2020_A0_S1_PH Debris flow losses DF_20_2020_A0_S1_PH DF_50_2020_A0_S1_PH DF_100_2020_A0_S1_PH Landslide losses LS_20_2020_A0_S1_PH LS_50_2020_A0_S1_PH LS_100_2020_A0_S1_PH |
Flood losses FL_20_2030_A0_S1_PH FL_50_2030_A0_S1_PH FL_100_2030_A0_S1_PH Debris flow losses DF_20_2030_A0_S1_PH DF_50_2030_A0_S1_PH DF_100_2030_A0_S1_PH Landslide losses LS_20_2030_A0_S1_PH LS_50_2030_A0_S1_PH LS_100_2030_A0_S1_PH |
Flood losses FL_20_2040_A0_S1_PH FL_50_2040_A0_S1_PH FL_100_2040_A0_S1_PH Debris flow losses DF_20_2040_A0_S1_PH DF_50_2040_A0_S1_PH DF_100_2040_A0_S1_PH Landslide losses LS_20_2040_A0_S1_PH LS_50_2040_A0_S1_PH LS_100_2040_A0_S1_PH |
|
A1 Engineering |
FL_20_2020_A1_S1_PH FL_50_2020_A1_S1_PH FL_100_2020_A1_S1_PH DF_20_2020_A1_S1_PH DF_50_2020_A1_S1_PH DF_100_2020_A1_S1_PH LS_20_2020_A1_S1_PH LS_50_2020_A1_S1_PH LS_100_2020_A1_S1_PH |
FL_20_2030_A1_S1_PH FL_50_2030_A1_S1_PH FL_100_2030_A1_S1_PH DF_20_2030_A1_S1_PH DF_50_2030_A1_S1_PH DF_100_2030_A1_S1_PH LS_20_2030_A1_S1_PH LS_50_2030_A1_S1_PH LS_100_2030_A1_S1_PH |
FL_20_2040_A1_S1_PH FL_50_2040_A1_S1_PH FL_100_2040_A1_S1_PH DF_20_2040_A1_S1_PH DF_50_2040_A1_S1_PH DF_100_2040_A1_S1_PH LS_20_2040_A1_S1_PH LS_50_2040_A1_S1_PH LS_100_2040_A1_S1_PH |
|
|
A2 Ecological |
FL_20_2020_A2_S1_PH FL_50_2020_A2_S1_PH FL_100_2020_A2_S1_PH DF_20_2020_A2_S1_PH DF_50_2020_A2_S1_PH DF_100_2020_A2_S1_PH LS_20_2020_A2_S1_PH LS_50_2020_A2_S1_PH LS_100_2020_A2_S1_PH |
FL_20_2030_A2_S1_PH FL_50_2030_A2_S1_PH FL_100_2030_A2_S1_PH DF_20_2030_A2_S1_PH DF_50_2030_A2_S1_PH DF_100_2030_A2_S1_PH LS_20_2030_A2_S1_PH LS_50_2030_A2_S1_PH LS_100_2030_A2_S1_PH |
FL_20_2040_A2_S1_PH FL_50_2040_A2_S1_PH FL_100_2040_A2_S1_PH DF_20_2040_A2_S1_PH DF_50_2040_A2_S1_PH DF_100_2040_A2_S1_PH LS_20_2040_A2_S1_PH LS_50_2040_A2_S1_PH LS_100_2040_A2_S1_PH |
|
|
A3 Relocation |
FL_20_2020_A3_S1_PH FL_50_2020_A3_S1_PH FL_100_2020_A3_S1_PH DF_20_2020_A3_S1_PH DF_50_2020_A3_S1_PH DF_100_2020_A3_S1_PH LS_20_2020_A3_S1_PH LS_50_2020_A3_S1_PH LS_100_2020_A3_S1_PH |
FL_20_2030_A3_S1_PH FL_50_2030_A3_S1_PH FL_100_2030_A3_S1_PH DFL_20_2030_A3_S1_PH DF_50_2030_A3_S1_PH DF_100_2030_A3_S1_PH LS_20_2030_A3_S1_PH LS_50_2030_A3_S1_PH LS_100_2030_A3_S1_PH |
FL_20_2040_A3_S1_PH FL_50_2040_A3_S1_PH FL_100_2040_A3_S1_PH DF_20_2040_A3_S1_PH DF_50_2040_A3_S1_PH DF_100_2040_A3_S1_PH LS_20_2040_A3_S1_PH LS_50_2040_A3_S1_PH LS_100_2040_A3_S1_PH |
|
|
S2 Risk informed planning |
A0 (no risk reduction) |
Not filled in here because of the limited space but they would be looking like the ones filled in for scenario 1. |
||
|
A1 Engineering |
||||
|
A2 Ecological |
||||
|
A3 Relocation |
||||
|
S3 Worst case (Rapid growth + climate change) |
A0 (no risk reduction) |
Losses same as S1 A0 |
Losses same as S1 A0 |
Losses same as S1 A0 |
|
A1 Engineering |
Losses same as S1 A1 |
Losses same as S1 A1 |
Losses same as S1 A1 |
|
|
A2 Ecological |
Losses same as S1 A2 |
Losses same as S1 A2 |
Losses same as S1 A2 |
|
|
A3 Relocation |
Losses same as S1 A3 |
Losses same as S1 A3 |
Losses same as S1 A3 |
|
|
S4 Climate resilience (informed planning under climate change) |
A0 (no risk reduction) |
Losses same as S2 A0 |
Losses same as S2 A0 |
Losses same as S2 A0 |
|
A1 Engineering |
Losses same as S2 A1 |
Losses same as S2 A1 |
Losses same as S2 A1 |
|
|
A2 Ecological |
Losses same as S2 A2 |
Losses same as S2 A2 |
Losses same as S2 A2 |
|
|
A3 Relocation |
Losses same as S2 A3 |
Losses same as S2 A3 |
Losses same as S2 A3 |
|
Step 2: Risk Analysis
- Adapt the script Risk_input and add the specific combinations of scenarios, alternatives and future years that you want to analyse.
- Run the script Risk_Input and calculate the Annualized risk for the specific combinations of scenarios, alternatives and future years of scenario 1 and 2. These are the results indicated below in the green part.
|
Scenario: Possible Future trends |
Alternative: risk reduction options |
Future years |
||
|---|---|---|---|---|
|
2020 |
2030 |
2040 |
||
|
S1 Business as usual |
A0 (no risk reduction) |
Losses AR_2020_A0_S1) |
Annualized risk (AR_2030_A0_S1) |
Annualized risk (AR_2040_A0_S1) |
|
A1 Engineering |
AR_2020_A1_S1 |
AR_2030_A1_S1 |
AR_2040_A1_S1 |
|
|
A2 Ecological |
AR_2020_A2_S1 |
AR_2030_A2_S1 |
AR_2040_A2_S1 |
|
|
A3 Relocation |
AR_2020_A3_S1 |
AR_2030_A3_S1 |
AR_2040_A3_S1 |
|
|
S2 Risk informed planning |
A0 (no risk reduction) |
AR_2020_A0_S2 |
AR_2030_A0_S2 |
AR_2040_A0_S2 |
|
A1 Engineering |
AR_2020_A1_S2 |
AR_2030_A1_S2 |
AR_2040_A1_S2 |
|
|
A2 Ecological |
AR_2020_A2_S2 |
AR_2030_A2_S2 |
AR_2040_A2_S2 |
|
|
A3 Relocation |
AR_2020_A3_S2 |
AR_2030_A3_S2 |
AR_2040_A3_S2 |
|
|
S3 Worst case (Rapid growth + climate change) |
A0 (no risk reduction) |
|
|
|
|
A1 Engineering |
|
|
|
|
|
A2 Ecological |
|
|
|
|
|
A3 Relocation |
|
|
|
|
|
S4 Climate resilience (informed planning under climate change) |
A0 (no risk reduction) |
|
|
|
|
A1 Engineering |
|
|
|
|
|
A2 Ecological |
|
|
|
|
|
A3 Relocation |
|
|
|
|
- Calculate the Risk Reduction for the specific combinations of scenarios, alternatives and future years of scenario 1 and 2. These are the results indicated below in the green part below:
|
Scenario: Possible Future trends |
Alternative: risk reduction options |
Future years |
||
|---|---|---|---|---|
|
2020 |
2030 |
2040 |
||
|
S1 Business as usual |
A0 (no risk reduction) |
Losses AR_2020_A0_S1) |
Annualized risk (AR_2030_A0_S1) |
Annualized risk (AR_2040_A0_S1) |
|
A1 Engineering |
Risk reduction = AR_2020_A0_S1 - AR_2020_A1_S1 |
Risk reduction = AR_2030_A0_S1 - AR_2030_A1_S1 |
Risk reduction = AR_2040_A0_S1 - AR_2040_A1_S1 |
|
|
A2 Ecological |
Risk reduction = AR_2020_A0_S1 - AR_2020_A2_S1 |
Risk reduction = AR_2030_A0_S1 - AR_2030_A2_S1 |
Risk reduction = AR_2040_A0_S1 - AR_2040_A2_S1 |
|
|
A3 Relocation |
Risk reduction = AR_2020_A0_S1 - AR_2020_A3_S1 |
Risk reduction = AR_2030_A0_S1 - AR_2030_A3_S1 |
Risk reduction = AR_2040_A0_S1 - AR_2040_A3_S1 |
|
|
S2 Risk informed planning |
A0 (no risk reduction) |
Risk reduction = AR_2020_A0_S2 - AR_2020_A0_S2 |
Risk reduction = AR_2030_A0_S2 - AR_2030_A0_S2 |
Risk reduction = AR_2040_A0_S2 - AR_2040_A0_S2 |
|
A1 Engineering |
Risk reduction = AR_2020_A0_S2 - AR_2020_A1_S2 |
Risk reduction = AR_2030_A0_S2 - AR_2030_A1_S2 |
Risk reduction = AR_2040_A0_S2 AR_2040_A1_S2 |
|
|
A2 Ecological |
Risk reduction = AR_2020_A0_S2 - AR_2020_A2_S2 |
Risk reduction = AR_2030_A0_S2 - AR_2030_A2_S2 |
Risk reduction = AR_2040_A0_S2 AR_2040_A2_S2 |
|
|
A3 Relocation |
Risk reduction = AR_2020_A0_S2 - AR_2020_A3_S2 |
Risk reduction = AR_2030_A0_S2 - AR_2030_A3_S2 |
Risk reduction = AR_2040_A0_S2 AR_2040_A3_S2 |
|
|
S3 Worst case (Rapid growth + climate change) |
A0 (no risk reduction) |
|
|
|
|
A1 Engineering |
|
|
|
|
|
A2 Ecological |
|
|
|
|
|
A3 Relocation |
|
|
|
|
|
S4 Climate resilience (informed planning under climate change) |
A0 (no risk reduction) |
|
|
|
|
A1 Engineering |
|
|
|
|
|
A2 Ecological |
|
|
|
|
|
A3 Relocation |
|
|
|
|
|
|
New Return Period in Future Year for scenarios 3 and 4 |
||
|---|---|---|---|
|
Old Return Period |
2020 |
2030 |
2040 |
|
20 |
17 |
14 |
11 |
|
50 |
45 |
35 |
25 |
|
100 |
90 |
75 |
55 |
|
200 |
180 |
150 |
110 |
In the script Risk_input you can do that by adding the new return periods, for example:
|
Scenario 1: |
Scenario 3 |
|---|---|
|
run risk_calculation 2020 A0 S1 20 50 100 run risk_calculation 2030 A0 S1 20 50 100 run risk_calculation 2040 A0 S1 20 50 100 etc |
run risk_calculation 2020 A0 S1 17 45 90 run risk_calculation 2030 A0 S1 14 35 75 run risk_calculation 2040 A0 S1 11 25 55 etc |
- Adapt the script Risk_input and add the specific combinations of scenarios, alternatives and future years that you want to analyse.
- Run the script Risk_Input and calculate the Annualized risk for the specific combinations of scenarios, alternatives and future years of scenario 3 and 4. These are the results indicated below in the yellow part.
- Calculate the annualized risk for the combinations indicated and put these in an Excel table.
- Calculate the benefits for each situation by subtracting the annualized risk after implementation of a risk reduction alternative from the one before that.
|
Scenario: Possible Future trends |
Alternative: risk reduction options |
Future years |
||
|---|---|---|---|---|
|
2020 |
2030 |
2040 |
||
|
S1 Business as usual |
A0 (no risk reduction) |
|
|
|
|
A1 Engineering |
Benefit S1 A1 2020 |
Benefit S1 A1 2030 |
Benefit S1 A1 2040 |
|
|
A2 Ecological |
Benefit S1 A2 2020 |
Benefit S1 A2 2030 |
Benefit S1 A2 2040 |
|
|
A3 Relocation |
Benefit S1 A32020 |
Benefit S1 A3 2030 |
Benefit S1 A3 2040 |
|
|
S2 Risk informed planning |
A0 (no risk reduction) |
|
|
|
|
A1 Engineering |
Benefit S2 A1 2020 |
Benefit S2 A1 2030 |
Benefit S2 A2 2040 |
|
|
A2 Ecological |
Benefit S2 A2 2020 |
Benefit S2 A2 2030 |
Benefit S2 A2 2040 |
|
|
A3 Relocation |
Benefit S2 A32020 |
Benefit S2 A3 2030 |
Benefit S2 A3 2040 |
|
|
S3 Worst case (Rapid growth + climate change) |
A0 (no risk reduction) |
|
|
|
|
A1 Engineering |
Benefit S3 A1 2020 |
Benefit S3 A1 2030 |
Benefit S3 A1 2040 |
|
|
A2 Ecological |
Benefit S3 A2 2020 |
Benefit S3 A2 2030 |
Benefit S3 A2 2040 |
|
|
A3 Relocation |
Benefit S3 A32020 |
Benefit S3 A3 2030 |
Benefit S3 A3 2040 |
|
|
S4 Climate resilience (informed planning under climate change) |
A0 (no risk reduction) |
|
|
|
|
A1 Engineering |
Benefit S4 A1 2020 |
Benefit S4 A1 2030 |
Benefit S4 A2 2040 |
|
|
A2 Ecological |
Benefit S4 A2 2020 |
Benefit S4 A2 2030 |
Benefit S4 A2 2040 |
|
|
A3 Relocation |
Benefit S4 A32020 |
Benefit S4 A3 2030 |
Benefit S4 A3 2040 |
|
Step 3: Cost-Benefit Analysis
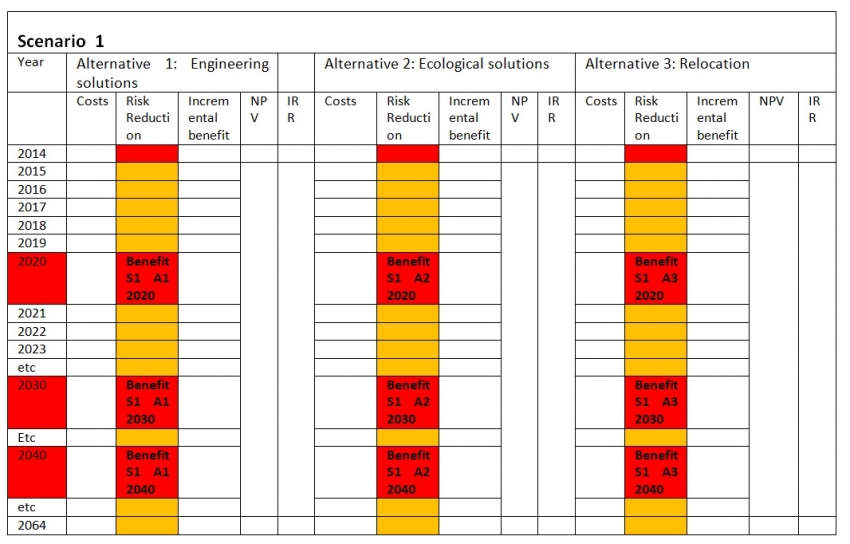
Once the benefits have been calculated, the cost-benefit can be calculated. If you compare the method explained in section 6.1 , the cost calculation stays the same, but the values for risk reduction (the benefits) are now different for future years (the ones indicated in red below). These values come from the benefits (annualized risk before - annualized risk after implementation of a risk reduction alternative). The orange values inbetween are interpolated values between the calculated ones (in the red cells).
- Create in Excel 4 tables with the cost-benefit calculations for the scenarios.
- Calculate the Net Present Value and Internal Rate of Return for the Scenarios
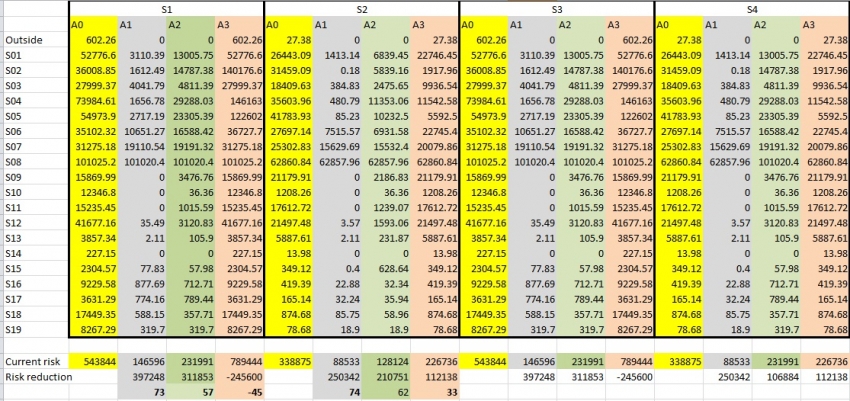
Results:
The results of the analysis are given below:
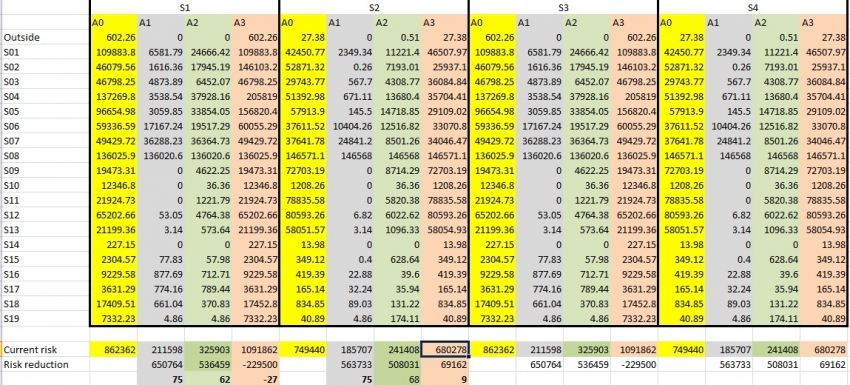
2020
The calculations for the year 2020 in terms of losses for combinations of the Alternatives (A0 - A3 ) and the Scenarios (S1 - S4):
2030
The calculations for the year 2030 in terms of losses for combinations of the Alternatives (A0 - A3 ) and the Scenarios (S1 - S4):
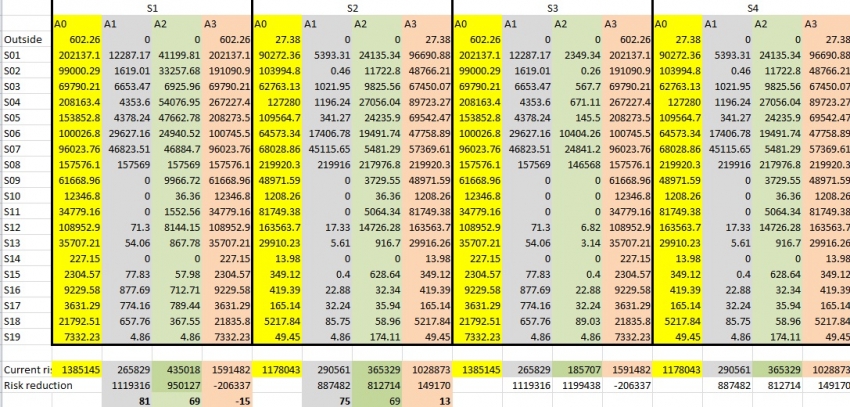
2040
The calculations for the year 2040 in terms of losses for combinations of the Alternatives (A0 - A3 ) and the Scenarios (S1 - S4):
Overall summary:
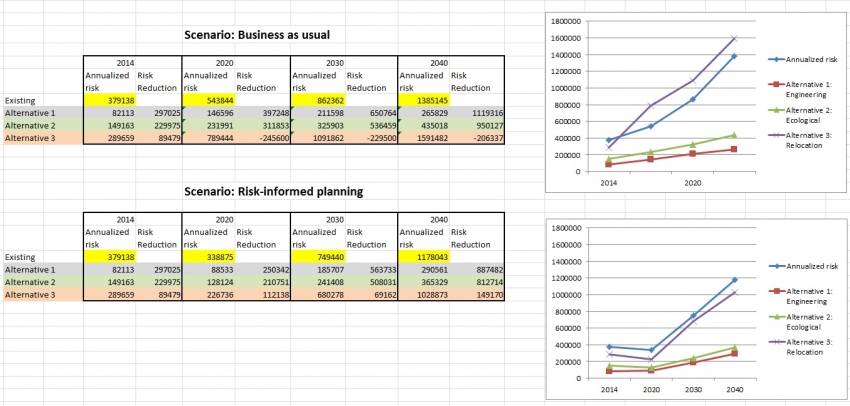
Conclusions:
The analysis that is carried out in this use-case is very extensive. It evaluates which risk reduction alternatives that are considered now are the best "change-proof" given a certain of possible future scenarios. The analysis requires a large amount of input data, in the form of hazard and elements-at-risk maps for all possible combinations of risk reduction alternatives, possible future scenarios and future years. The loss calculations is very extensive and requires to calculate several hundreds of options. This type of analysis may not be carried out easily, and requires many consulting partners. It is also useful to do this analyis using specific software, such as the Decision Support System (RiskChanges) resented in the next section.