

General introduction
By: Joan Looijen (ITC) and Cees van Westen
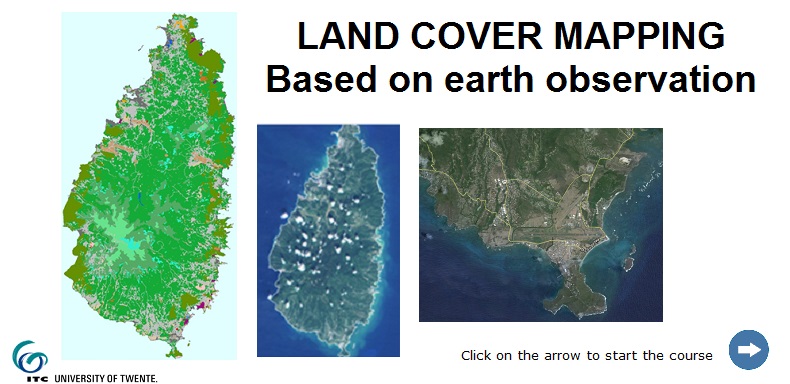
Land cover information and maps are essential in natural resource planning, environmental management and disaster and risk assessment and management.
Human activities have led to fast and large changes in land cover, which in turn have a negative impact on the environment as a whole. Deforestation, soil erosion, desertification, urbanisation, loss of biodiversity, they are all related to changes in land cover. Those changes in land use in turn increase the risk of flooding, mudflows, landslides, drought and climate change effects like sea level rise. On the other hand, proper land use and related ecosystem services can prevent or reduce the risk of hazards and disasters. A well-managed ecosystem can reduce the potential impact of natural hazards such as flooding, erosion and landslides. Ecosystem-based measures for hazard and risk reduction are increasingly proposed as alternatives for engineering measures. Therefore, land cover is an important data management element in hazard and risk management. Land cover maps show information on the cover of the earth.
Click on the image to start an animated presentation on land cover mapping from remote sensing, made by Joan Looijen (ITC). In this presentation an overview is given of the different steps in land cover classification and mapping based on earth observation.
Landcover maps for the Caribbean: CarLand project.
The Caribbean Land cover project (CarLand) which was operational some years ago responded to regional needs identified by donor organizations and national interests in the Caribbean. The regional project was a direct outgrowth of the support of a Global Development Alliance (US AID), an alliance for regional planning in MesoAmerica and the Caribbean. "The Mesoamerican and Caribbean Geospatial Alliance" (MACGA)was proposed by numerous alliance members to undertake concerted region-wide efforts in Central America and the Caribbean to aid and modernize the development, access, and applications of spatial data. The project aimed to create the baseline vegetation and land-cover map and data layer, using satellite imagery and ancillary data. Land use and natural vegetation maps were made using a hybrid image analysis approach, funded by USAID.
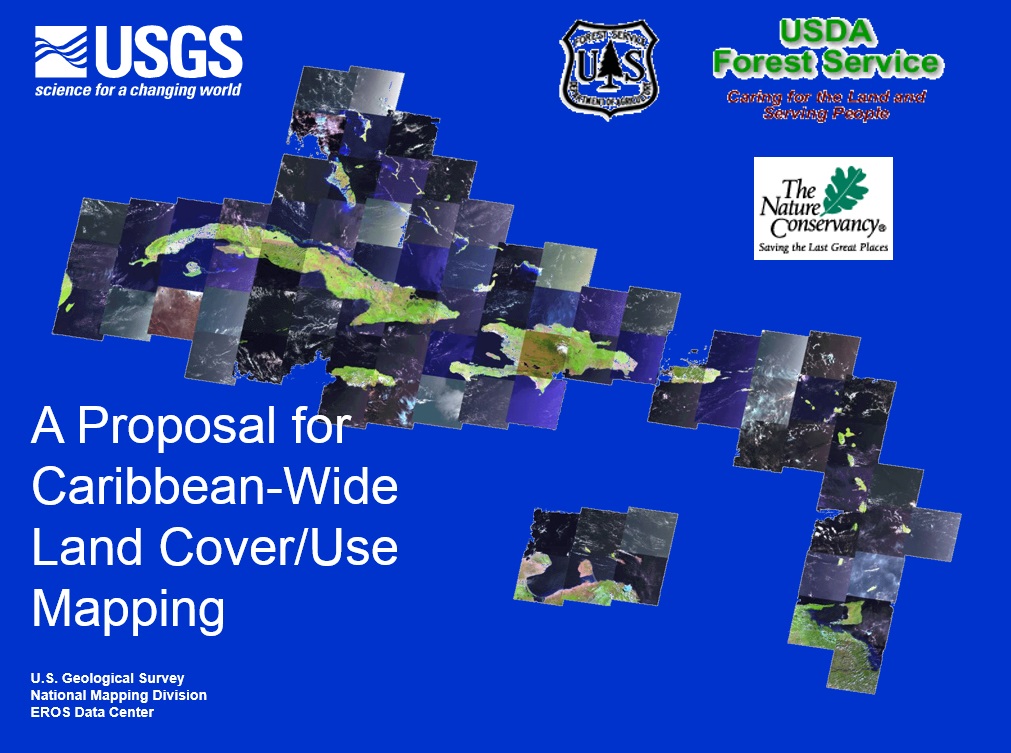
More information on the project can be found here.
Landcover maps for Dominica, Saint Lucia, Saint Vincent and Grenada can be downloaded as well.
Landcover mapping in the Caribbean: the Eoworld 2 initiative (ESA)
By: Colm J Jordan, Stephen Grebby, Tom Dijkstra, Claire Dashwood and Francesca Cigna (British Geological Survey, Natural Environment Research Council)
A number of Earth Observation information products / services were delivered to the World Bank (primarily via the CHARIM project) in the framework of the European Space Agency (ESA) " eoworld 2" initiative. The products services were produced by the British Geological Survey (BGS) in the Caribbean using a combination of satellite EO data, ground validation exercises and pre-existing data. The primary objective of this ESA project is to raise awareness within the World Bank (WB) of the capabilities of Earth Observation (EO) data and specialist service providers to supply information customized to the specific needs of individual projects. This project was set up within the ESA/WB eoworld initiative to contribute to the WB Caribbean Risk Information Program that is operating under a grant from the ACP-EU Natural Risk Reduction Program. This ESA project is focussed on " risk information services for disaster risk management in the Caribbean" a title that has been abbreviated to EO-RISC (Earth Observation for Risk Information Services in the Caribbean) internally by BGS. EO-RISC deliverables directly contribute to the CHARIM objectives e.g. by providing data and services that enable certain hazards such as landslides to be identified directly.
The project focused on three main activities:
- Generation of Digital Elevation Models for Belize, and some of the islands
- Generation of landslide inventory maps for Saint Lucia and Grenada
- Generation of landcover maps for Grenada, Saint Vincent and Saint Lucia.
The landslide inventory and land cover maps are vitally important to gain a full understanding of the events and the associated risk. However landslides are highly dynamic systems, and the land cover is also constantly changing so the requirement is to update these maps on an annual or bi-annual basis. The annual imagery used from 2010 to 2014 to create the landslide inventory highlighted patterns e.g. related to weather systems, however more data from inventories gathered in successive years would help to clarify potential thresholds for weather fronts and their impacts on the environment;
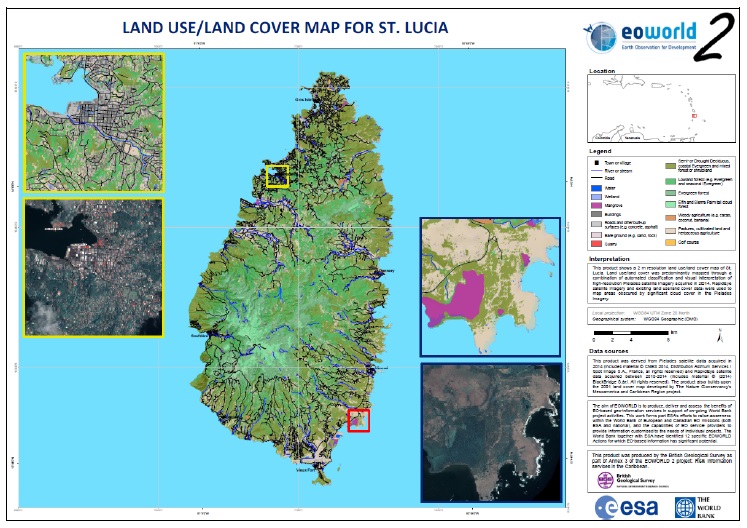
The objective of the land cover service was to generate land use/land cover maps for St. Lucia, Grenada, and St. Vincent & the Grenadines by exploiting recent high-resolution or very high-resolution optical satellite imagery. As well as land use/land cover, the objective was to utilise the imagery to produce a vector layer of water features (e.g. lakes, ponds, rivers) present in each of the areas of interest (AOI). With a preference on utilising imagery acquired using European and Canadian sensors, a set of recent images with acceptable levels of cloud cover was identified and obtained from the relevant archives for each of the three AOIs. The satellite data comprised Pleiades imagery (acquired between 2013-2014) and RapidEye imagery (acquired 2010-2014). These datasets have a spatial resolution (pixel size) of 2m and 5m, respectively, for the multispectral waveband images. Additionally, the Pleiades datasets includes a very high-resolution 0.5m panchromatic image.
Existing land use / land cover maps for the three AOIs (Grenada, Saint vincent and Saint Lucia) were produced as part of The Nature Conservancy" s Mesoamerica and Caribbean Region project (Helmer et al., 2007; 2008). These maps were derived at 30m resolution from satellite imagery with the aid of extensive field knowledge and observations. Accordingly, these maps represent useful baseline data to build upon for the land use/land cover mapping under this service.
To enable the most detailed information to be resolved, the Pleiades imagery was used as the primary dataset for generation of the new land use/land cover maps for the three AOIs; thus achieving a spatial resolution of 2m, which is equivalent to a mapping scale of 1:10,000. For each of the AOIs, land use/land cover was mapped using a combination of automated image classification, rule-based refinement and manual digitisation. The existing 30m maps were used to define the different land use/land cover types and identify representative areas in the imagery to help guide the initial automated classification and to subsequently validate the mapping. Water features and the basic road networks were manually digitised at 1:10,000-scale from Pleiades imagery that had been pan-sharpened to 0.5m resolution using the panchromatic image. Wherever available, existing vector layers were utilised as baseline information during mapping.
The land use/land cover maps were validated using a standard remote sensing approach, which involves comparing the land use/land cover class identities of a sample of pixels in the map with their " true" land use/land cover class. The " true" land use/land cover classes of these pixels were determined using a combination of the pan-sharpened Pleiades imagery and existing maps. Consequently, the maps for St. Lucia, Grenada, and St. Vincent and the Grenadines were found to have accuracies of 84.9%, 84.8% and 80.8%, respectively; which are within the desired target accuracy of 80-90%. Additional validation of the maps for St. Lucia and Grenada was achieved using point-sampled field observations at a number of locations.
Compared to the existing maps, the new land use/land cover maps derived for this service represent an order of magnitude increase in terms of spatial resolution " ” increasing from 30m to 2m. As a result, the new maps provide much more detailed information on the distribution of the different land use/land cover types in the AOIs. Moreover, a number of significant errors (due to misclassification) in the existing maps have been corrected in the new maps. Nevertheless, a relatively minor degree of confusion between inherently similar land use/land cover types (particularly vegetation) does persist. Overall, the results demonstrate the potential to utilise high-resolution satellite imagery to produce detailed and accurate land use/land cover maps more efficiently than through an equivalent field-based survey.
Figure: Example of one of the resulting land use / land cover maps generated by the British Geological Survey (BGS) for Saint Lucia.
The land use / land cover maps produced under this project can be downloaded here for:
References
Congalton, R. G. (1991). A review of assessing the accuracy of classifications of remotely sensed data. Remote Sensing of Environment, 37, 35-46.
Helmer, E. H., Schill, S., Pedreror, D. H., Kennaway, T., Cushing, W. M., Coan, M. J., Wood, E. C., Ruzycki, T.,& Tieszen, L. L. (2007). Forest formation and land cover map series-Caribbean Islands. U.S. Geological Survey/Earth Resources Observation and Science (EROS), Land Cover Applications and Global Change, International Land Cover and Biodiversity, Caribbean Land Cover Analyses.
Helmer E. H., Kennaway T. A., Pedreros, D. H., Clark, M. L., Marcano-Vega, H., Tieszen, L. L., Ruzycki, T. R., Schill, S. R. & Carrington, C. M. (2008). Land cover and forest formation distribution for St. Kitts, Nevis, St. Eustatius, Grenada and Barbados from Decision Trees classification of cloud-cleared satellite imagery. Caribbean Journal of Science, 44, 175-189.
Jordan, C. J. & Grebby, S. (2014) Risk Information Services for Disaster Risk management (DRM) in the Caribbean: Service Readiness Document. British Geological Survey Open Report ) OR/14/064 and ESA Technical Report.