

Summary
When undertaking a GIS analysis, it is important to ensure that all the data used are compatible and consistent. This use case provides an appreciation of some of the issues related to reviewing data quality and incompatibility before integrating into a national or project dataset. In order to highlight the problems, examples from Dominica, St. Lucia and St. Vincent are used to discuss the issues and possible mitigation. The first example demonstrates a case where data integration may be rejected; the second demonstrates projection/datum issues and mitigation; while the third example demonstrates the spatial referencing issues due to undefined projection/datum issues and its mitigation.
Use case intended for: Spatial analist
Keywords:
Projections, Datums, Homogenization, Rectification
| Before you start: | Use case Location: | Uses GIS data: | Authors: |
|---|---|---|---|
| To carry out similar analysis used in these examples, basic GIS skills are required. The reader is asked to refer to section 7.4 of the Data Management Book for related information on data standards. | This study uses examples from Dominica, St. Lucia and St. Vincent | Yes, data to be homogenized and higher quality (control) data | Tarick Hosein |
Introduction:
Incorrect or inconsistent data can lead to false conclusions and inadvertently lead to poor decision making and possible misdirected resources and investments. As such, it is important to align all data to a common geospatial framework so as to ensure spatial consistency of the data, thus increasing the reliability, integrity and validity of results. This chapter demonstrates methods of deciding on appropriate transformation and repairing the spatial referencing of data. However, where data integrity may be questionable due to data collected, conversions, and incompatible map and/or time scales then the analysis may need to determine the significance of the data on the analysis and may ultimately reject the data.
Objectives:
This chapter reviews and demonstrates some common issues in the integration of new datasets and the problems related to different spatial and temporal dataset qualities. A methodology is presented for deciding whether or not to accept the data based on quality tests or reject the data based on impact on the analysis.
Flowchart:
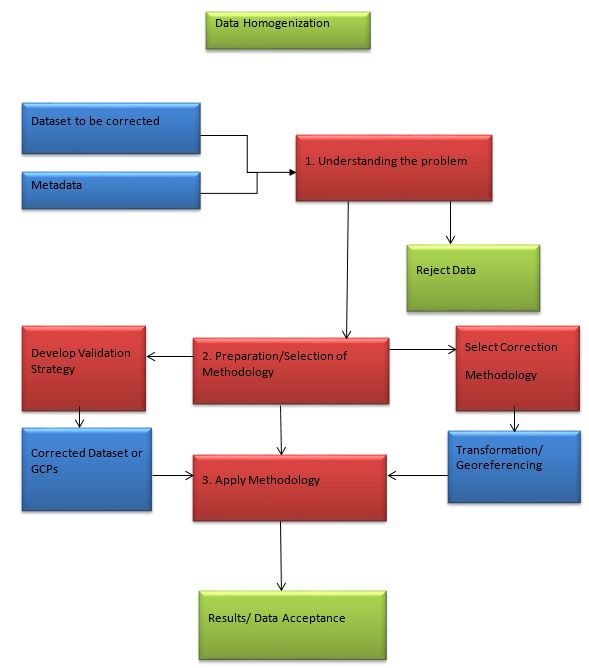
Flowchart of the methodology
Problems definition and specifications:
Most small island states are limited by resources and unable to acquire, reduce and manipulate geospatial data themselves. In addition, some islands must still resort to integrating old out-dated information from printed maps into their GIS databases. These problems are compounded by two issues: firstly the lack of national spatial data protocols and procedure that would otherwise guide data collection and address issues in integration (see DM 7.2 at http://charim.net/datamanagement/72); and lack of metadata regarding data paid for and collected by third parties and donated to the local states. In essence, many small island states do not have the luxury of rejecting data because it does not meet standards in accuracy, precision and documentation. As such, homogenization of collected data may have to be carried out provided it is possible and logical to do so. Homogenization has two component steps; firstly, spatially aligning data; and secondly ensuring the quality of the data is compatible. These two component steps are essential in any GIS analysis.
It is common to find different datasets with the same coordinate reference system having slight differences. These differences may be attributed to a number of sources including: the use of different transformation parameters; differences in the spatial accuracy and/or precision of the source and target data; limitations of the data capture methodology and equipment; and random errors associated with acquiring, processing, converting, transforming, publishing and other processes associated with creating the data. In some cases the inconsistencies can be much more prominent; nevertheless in all cases the issues must be addressed in order to improve the outcomes associated with using the GIS data.
In the following section, three examples are discussed; firstly a common problem regarding undefined georeferencing transformation information; the second example discusses issues of systematic shifts caused by wrong parameterization of projection and datum; finally, the third example discusses problems regarding issues of unsystematic shifts.
Most new data are published in the UTM projection and WGS84 datum, however the parameters that relate terrestrial measurements on the surface of the earth to the UTM/WGS84 coordinate system are continuously being improved especially when dealing with vertical - height information above mean sea level. As such, the examples discussed are for guidance and do not constitute a definite fix, especially in the absence of a national spatial policy.
Data requirements:
The requirements to homogenize data can be categorized into three components:
- Data to be homogenized - " source" data whose spatial position is different or unknown.
- Control Data - data which is in the " target" coordinate system.
- Documentation - metadata about the " source" and " target" data.
The source data refers to the data which needs to be corrected. As previously discussed, these data may be slightly or significantly spatially misaligned from the expected positions. The target data refers to control data, which is data that are in the correct (expected) geospatial position. Both source and target data can be vector, raster or image information.
Analysis steps:
General Application
1. Understanding the Nature of the Data and Problems
a. Review the Metadata and Documentation
Before data is integrated into a national dataset it needs to be carefully scrutinized. The geospatial expert needs to identify the nature of the data, this includes:
- Understanding the source and methodology used to produce the data.
- Understanding the limitations associated with collecting and producing the data, including the scale and both thematic and spatial accuracy.
- Understanding the limitations associated with using the data, including the scale and both thematic and spatial accuracy.
- Understanding the limitation and specifications associated with publishing the data, including the data formats, spatial resolution (for raster and image information), and coordinate system used.
Most of this information can be obtained from the dataset's metadata. As such, it is imperative that all contractors and data vendors/supplier provide completed metadata in an industry standard format; this condition should be included in all data supply contracts.
b. Decide if the Data is Acceptable or Not
Within a working national geospatial infrastructure, data may be rejected if its metadata is incomplete or missing. However, most small island states do not have the luxury of rejecting data and must bear the burden of making the most of the data that it has and deciding if to accept and use donated data that may lack relevant metadata. In situations where metadata is deficient, the geospatial expert must review the data and compare it to control information in an effort to determine the limitations of the source data and the feasibility for correcting the data.
2. Preparation for Harmonization
a. Determining the Correction Required
As part of an overall strategy, the geospatial expert should check the metadata, open the data, recognize any problems, and if required, determine a suitable methodology to correct the data. It is standard that projection information should be included along with data and metadata. However, often this is missing especially when data is exported and/or copied onto storage media. Depending on the formats, some information may be embedded into the files, while others require separated projection files. Good GIS software may allow for " on-the-fly" transformation, but this should always be checked by the geospatial expert to ensure that correct coordinate systems and transformation parameters are used.
b. Developing a Validation Methodology
Whether or not data is corrected, new datasets should be validated. This may be overlooked if a suitable validation methodology were applied and documented by the data contractor or donor. Depending on the nature of the data, the validation may seek to quantify the spatial and thematic accuracy. As previously discussed, if the accuracy cannot be determined using control/reference data, then comparison with existing data may be used to obtain a qualitative sense of the data. As part of any field validation exercise suitable equipment and sampling strategy has to be determined.
3. Correction and Validation of Dataset
It was previously established that in some cases data may be rejected. However, in most cases, especially for new digital data, some corrective action will be sought. Two such strategies include defining the transformation parameters and georeferencing. However, once corrected, validation of the data becomes important in assessing the validity of the data.
a. Projection and Datum Transformations
In some cases, especially when coordinate systems' projection files are missing or misunderstood by the software, redefining the projection and datum transformation parameters will solve the issue. However, depending on the data, some inherent errors may still exist and may need to be refined using georeferencing.For transformation parameters to be defined, there needs to be an understanding (in terms of transformation parameters) of the data's current and intended (target) coordinate system. Usually, each transformation will be in reference to UTM/WGS84 projection and datum. By configuring the parameters correctly when importing, data will be corrected when imported.
Each country should have a defined set of transformation parameters, approved and/or agreed upon by a NSDI or the national mapping agency. (See Data Management Book 7.2)
b. Georeferencing
Unlike transformations, georeferencing will involve associating common geospatial positions between the source and some target data. As previously mentioned, this is independent of the transformation coordinate system definition, and may still be required after such definition. Georeferencing, can take the form of a systematic or unsystematic relationship between where the data is (source) and where it should be (target). Systematic shifts would define the mapping between source and target mathematically using a global (applied to the whole dataset) linear or polynomial expression to relate 2D positions, in the form of shifts, rotations and scales. Unsystematic expressions map one system to another using smaller localized mathematical expressions between the defined common geospatial positions. Rubber sheeting is an example of unsystematic expression. The geospatial expert should determine the most suitable georeferencing relationship to apply. Further, limitations of the source and target datasets should be considered in determining a suitable georeferencing strategy.
c. Validation
For primary application, quantitative assessment is preferred over qualitative assessments. Quantitative assessments are true measures of accuracy, for example positional errors quantified by RMS values when the source data are compared to measured data. Qualitative assessments involve comparisons to existing data, including maps, and are not usually considered suitable for accuracy assessments for the following reasons (Congalton et al., 2009):
- Differences in acquisition and processing methodologies and subsequent limitations.
- Undefined, and/or differences in update frequency and acquisition strategy.
- Errors in existing data are rarely known.
- Existing data are usually older and do not reflect up-to-date changes
In quantitative assessments, the spatial accuracy (X,Y or E,N) of the control data should be of higher accuracy. Statistically, the control data should have a RMS compatible with the source data to a 95% probability (ASPRS, 2014). Therefore, when control data is chosen, it should be at least twice as accurate as the source data. This means that if the projected accuracy of the source data is 1 meter, then the control data should have a RMS of ½ meter. Ideally, the accuracy information should be outlined in the dataset's metadata. If not, then the geospatial expert should make a decision based on available information including the data source methodology and/or validation information.
Example applications
Example 1. Dominica: Road Layer Mismatch
Data used: Base data from Dominica consisting of a road layer and 2014 Pleiades satellite image.
In this example the road data is represented as a vector dataset (red lines). However, the dataset lacks metadata documenting the source of the data. Opening the data within a GIS software shows that the dataset is registered as UTM/WGS84. However, the road dataset onto the satellite image demonstrates lack of data integrity as shown in Figure 1.
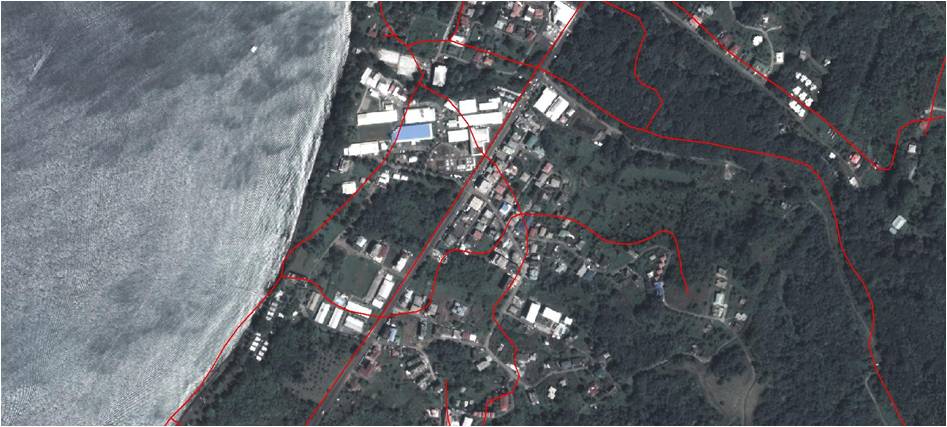
Figure 1: Road and Satellite Image Overlay
Corrective Actions:
The datasets demonstrate two problems; firstly the road layer seems to be out-dated as additional roads visible on the image are not shown in the vectors. Secondly there seems to be georeferencing issues with the satellite image as the road layer vectors do not coincide with the roads on the image. In this situation a ground sampling scheme should be developed to determine the coordinates of well defined points clearly visible on the satellite imagery. As the actual image captures a wide area, field sampling should utilize GPS systems working in RTK or Static modes, in order to capture the control to at least an accuracy of ½ metre representing ½ the pixel size on the ground. It is expected that rubber sheeting will be applied to correct the georeferencing. Many ground control points (GCPs) are required to perform this action with some GCPs retained for an accuracy assessment of the data once rectified.
Example 2. St. Lucia: Unspecified projection/datum
Data used: Base data from St. Lucia consisting of a coastline dataset and 2014 Pleiades satellite image.
In this example, the satellite image is considered to be up-to-date and accurate. In contrast, the coastline lacks metadata, but is considered to be of historical importance. Opening the data within a GIS software shows that the dataset has an unknown coordinate system and assumed (either by the software or user) to be in the same coordinate system as the satellite image. However, overlaying the two dataset reveals a shift as shown in Figure 2.
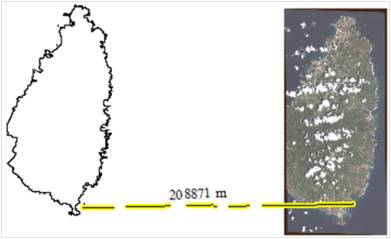
Figure 2: Shifts due to wrong projection/datum parameterization
After further investigation it was found that the dataset was digitized from a paper map based on St. Lucia 1955 grid coordinates. In the absence of any NSDI standards in the country for transforming projections and datums, the latest publicly available definition, as shown in Table 1, matching most of the datasets in the national GIS database, is used. In most GIS software, the definition may be defined manually as shown in Figure 3.
|
Parameters |
St. Lucia information defined by Fugro 2009, and used in subsequent national GIS datasets |
|---|---|
|
BWI Transverse Mercator Grid |
|
St. Vincent Datum of 1955 based on the Clarke RGS |
|
∆X = - 149 m ∆Y = +128 m ∆Z = +296 m |
|
0.9995 |
|
Central Meridian = 62º W latitude of origin = equator |
|
E =400,000m |
Table 1: St. Lucia transformation parameters 2009
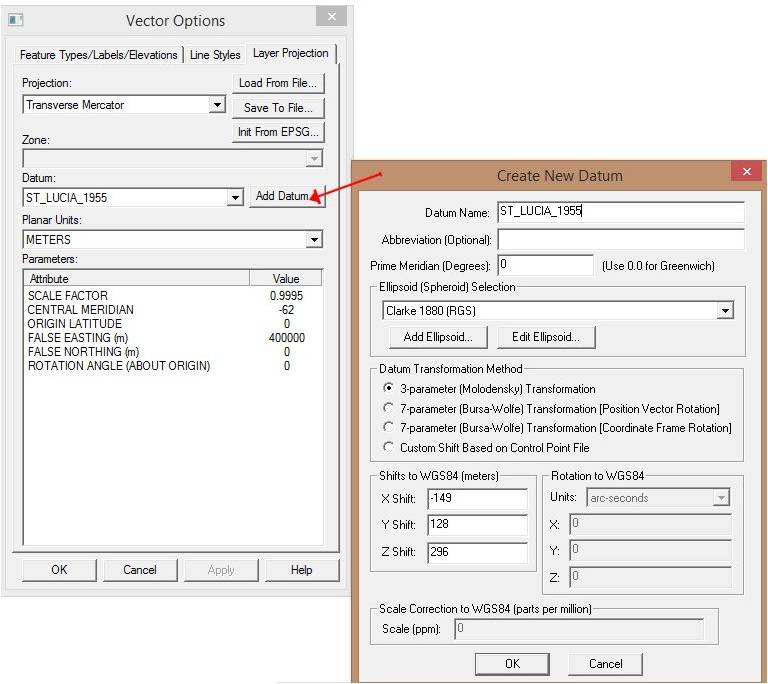
Figure 3: Defining the Projection and Datum Manually (example done using Global Mapper)
Corrective Action
Figure 4, shows an adequately transformed coastline into the UTM WGS84 coordinate system, matching the satellite imagery, as evident in the zoomed scene. In most cases, with consistent parameterization and embedded projection files, most software will automatically apply the correction, however if data is shared without the projection information or there is a difference in the parameterization then, problems as those shown and discussed will become evident.
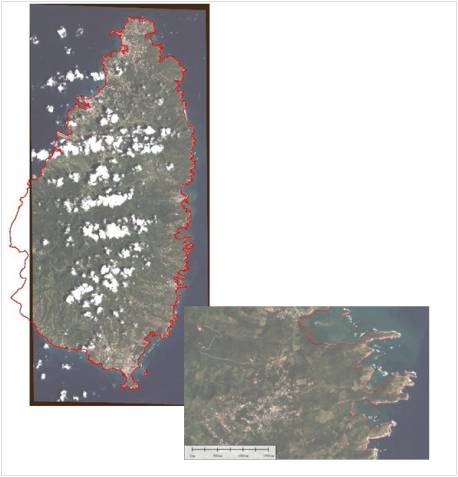
Figure 4: Shifting of datasets based on parameter definition
Example 3. St. Vincent: Correction using a control dataset
Data Used: Base data from St. Vincent consisting of two building maps, and 2014 Pleiades satellite image
In this example, there are two building datasets each from a different source. Again the metadata is missing. Both datasets are in UTM/WGS84 as read by the software. For visual purposes one layer is colored red while the other is displayed in yellow. One of the layers has more buildings, suggesting it has been updated. In order to determine which layer is correct, the georeferenced satellite image is imported and used as the base map. As seen in figures 5 and 6, the building layer, displayed as red, correctly matches the satellite image, while the layer displayed in yellow is shifted away from the satellite image.
It can be inferred that the layer displayed as yellow has been inadvertently shifted resulting in the misalignment of the data. This error is not a projection error, but a georeferencing issue. In order to correct this problem, the building layer colored red is used as the control " target data" , and the layer colored yellow is georeferenced to align its buildings with the red layer.
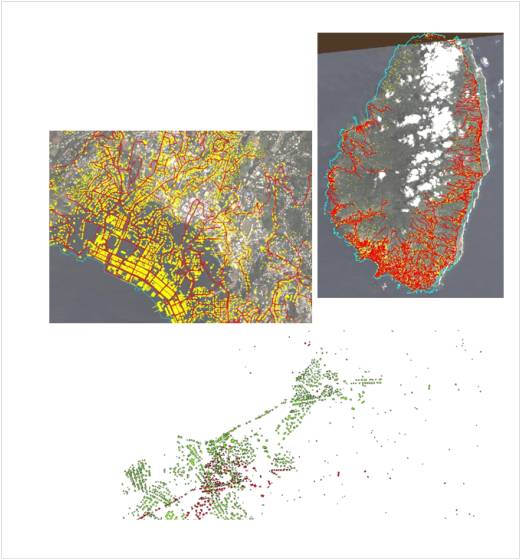
Figure 5: Overlaying problems based on the use of undocumented parameters
The workflow to correct the dataset involves importing both datasets, as shown in Figure 6, followed by rectification (or spatial adjustment) of the source dataset (to be corrected) to the referenced layer (layer with correct referencing) as shown in Figure 7. In this process the source layer is rectified to the reference layer (alternatively GCPs can be measured and used) using a linear global rectification. As part of the georeferencing, the linear transformation equation is obtained along with an RMS value that indicates how well the linear rectification fit has been expressed. In this application, the referencing is done between two vector layers, and the degree of uncertainty in selection of common features is removed as the software snaps to the vector information; as such if the RMS is high, it may suggest that the global linear rectification model is inadequate and another georeferencing methodology may be necessary.
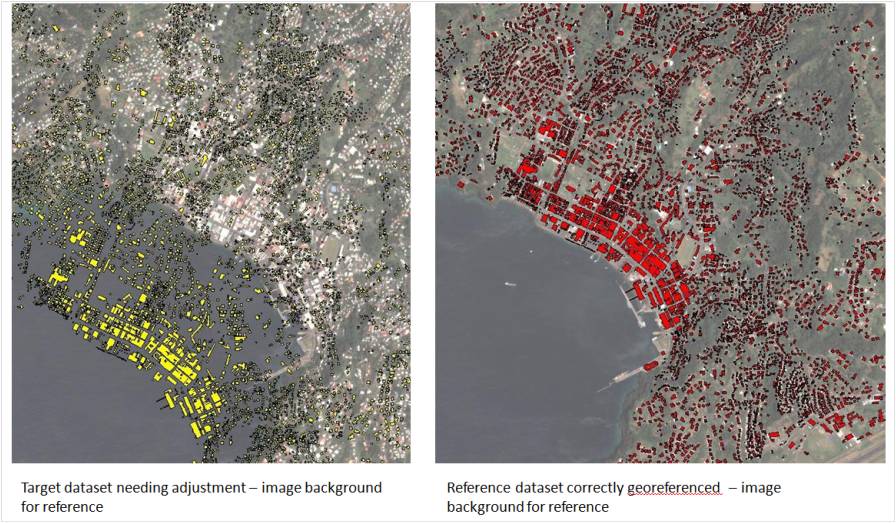
Figure 6: Problem definition, showing overlaying problems of the target building layer
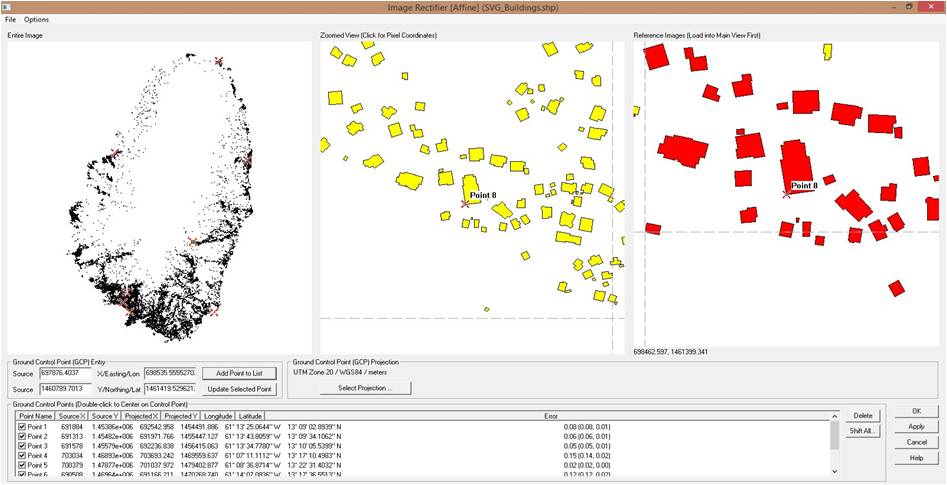
Figure 7: Rectification of the datasets (Example done using Global Mapper)
Corrective Action
The results, shown in Figure 8, show the two layers have been harmonized and consequently, overlay each other correctly. The spatial adjustment, as defined by the mathematical relationship between the two datasets, can now be used to correct other misaligned layers. The metadata for all datasets should be appropriately updated.
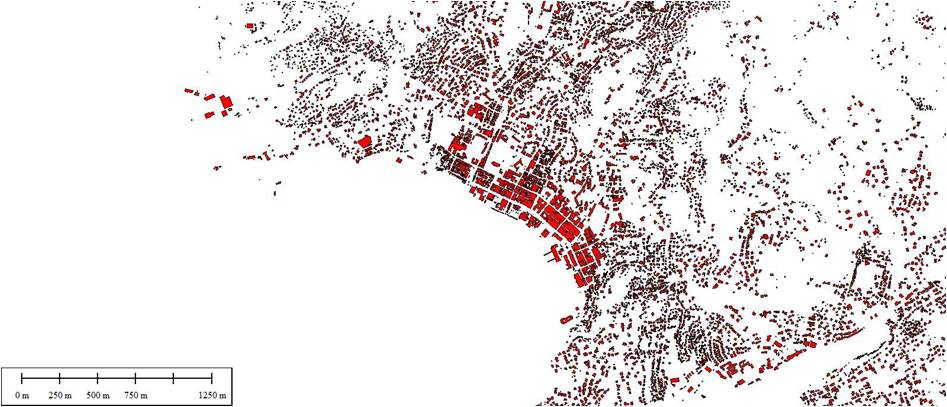
Figure 8: Overlay of the two datasets
Conclusions:
While most of the examples and discussions focused on coordinate system problems, homogenization also encompasses the quality of the data and related documentation including metadata. In essence, homogenization ensures that data have met a certain level of standards and is " fit for use" . When working with new data it is necessary to review the metadata and undertake some initial quality checks. If necessary, a corrective strategy should be developed and undertaken. All data should be validated and documented to ensure that GIS users can appreciate the history behind the dataset and use it with confidence. Finally, transformation parameters should be published as part of a NSDI policy along with standards for data collection, processing and publishing.
References:
Congalton, Russell G., and Kass Green. 2009. Assessing the accuracy of remotely sensed data: principles and practices. Boca Raton: CRC Press/Taylor & Francis.
Last update: 14 - 04 - 2016