

Summary
Where roads and highways cross rivers and streams, it is important to ensure that the flow of water is not obstructed. This use case provides an appreciation of the basic concepts behind the design of a road where it crosses water, particularly in locations that are prone to floods and introduces the reader to the required data and flow analysis methods. In order to illustrate the conceptual approach, examples from two locations in Belize with two different settings (steep and flat terrain) are outlined in which to investigate flood issues related to roads. The first location is the George Price Highway crossing of Mount Pleasant Creek crossing near Belmopan (steep terrain) and the second is the Ladyville area near the west coast and Belize City (flat terrain).
Use case intended for:
Engineer Keywords:
Watercourse crossing, bridge, culvert, hydrology, hydraulics
| Before you start: | Use case Location: | Uses GIS data: | Authors: |
|---|---|---|---|
|
To carry out some of the analysis in this Use Case, it would be useful to have some basic GIS skills in order to draw a catchment and measure some map distances and areas. To carry out the culvert hydraulic capacity calculations, it will be necessary to install and be able to use the free HY-8 culvert capacity calculator program from the U.S. Federal Highway Administration. |
This Use Case utilizes two locations in Belize |
Yes, SRTM digital elevation data and derived contours, national road vectors, urban extents and Bing maps aerial imagery. |
Mark Trigg, Robert Hack |
Introduction:
The construction of roads and highways involves the placement of a linear structure across the landscape which often crosses multiple rivers, streams, creeks and other water features. As part of a road design process, allowance is made for water to pass under the road by providing structures to convey the water safely under the road. Generally these conveyance structures will be bridges for the larger rivers and streams, and one or multiple culverts for the smaller watercourses. Bridges have a greater flow capacity, but can be more costly, while culverts are cheaper, but have smaller capacities and may not have the lifespan of a bridge.
As the amount of water flow will naturally vary in a watercourse and will depend on many factors, including: season, rainfall conditions and land use etc., the correct design of roads crossing watercourses and flood affected areas can be a challenging task. This is particularly true where there is little data or information upon which to base the design. Even with a well-designed crossing, there will still be times when there are more extreme flood events than that which is chosen for the road design.
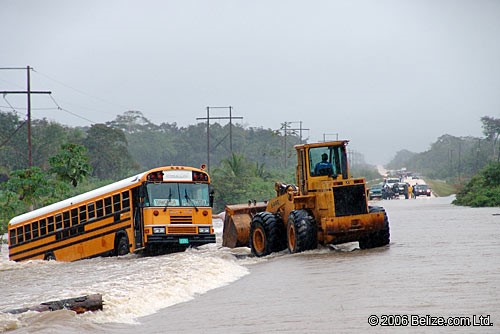
The consequences of poor design or extreme flood events on a road and its surrounding area are multiple and can be severe. There will be a disruption to the road network, risk to vehicles and passengers trying to pass through floodwaters on the road, flooding of surrounding areas, as well as damage to the road embankment and surface due to scour from flowing water and standing water saturation, to mention just a few. An illustration of these issues is provided in the photo below left of the George Price Highway crossing of Mount Pleasant Creek near Belmopan where flood waters flow over the top of the road, in this case, washing a bus off the road. The photo on the right below, shows the effect of scour at a culvert on a section of the Hummingbird Highway near Middlesex Village in Southern Belize where the entire section of the road has been damaged.
 |
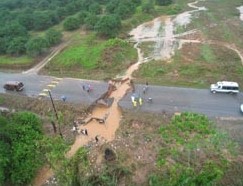 |
Image credit: Belize National Emergency Management Organization (NEMO).
Objectives:
The overall objective of this Use Case is to provide an appreciation of the basic concepts behind the design of a road where it crosses water, particularly in locations that are prone to floods. It provides an introduction to the methods and data required to adequately take into account road-flood interactions in the design of roads. It also illustrates some context specific issues by using two example road crossing locations with flood issues in Belize, one a simple flowing single river crossing and the other a more complex low lying standing-water crossing.
Flowchart:
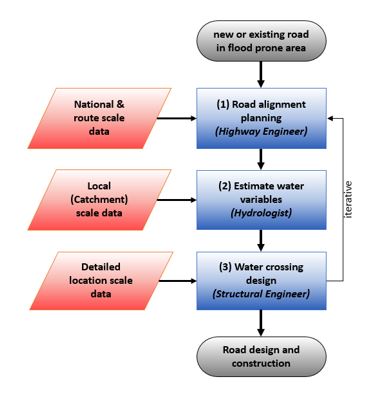
Figure 1: Simple Flowchart
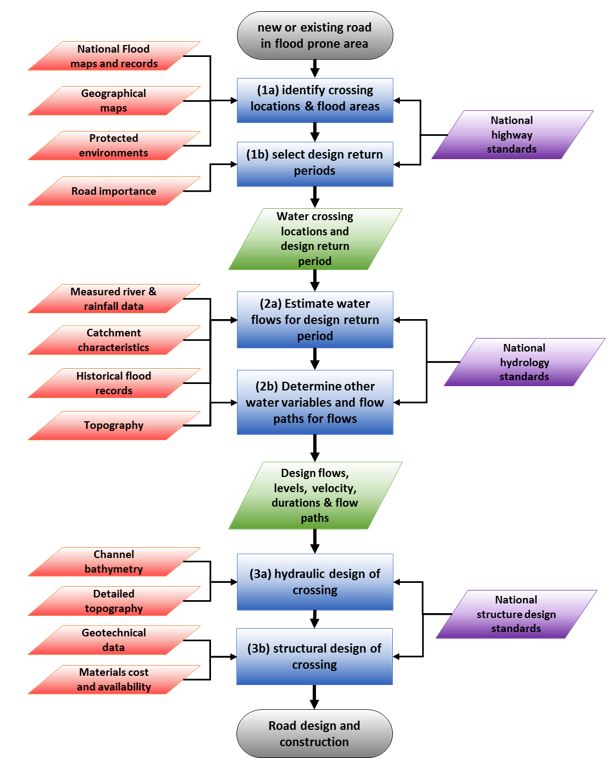
Figure 2: Detailed Flowchart
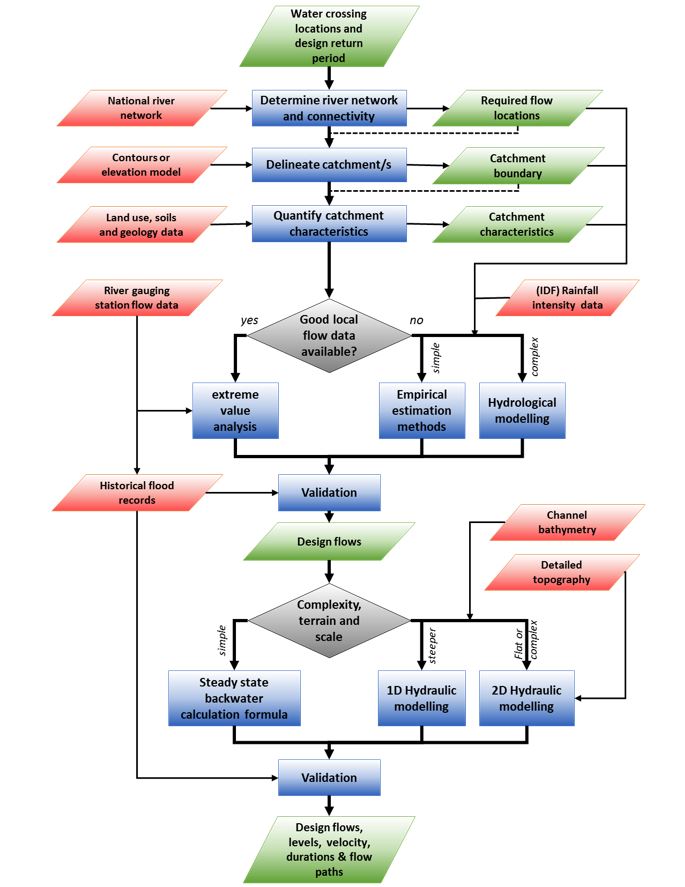
Figure 3: Detailed Hydrology and hydraulics process diagram (analysis step 2 above)
Use case study area description:
This Use Case utilizes two locations in Belize to illustrate two different settings (steep and flat terrain) in which to investigate flood issues related to roads. The first location is the George Price Highway crossing of Mount Pleasant Creek crossing near Belmopan (steep terrain) and the second is the Ladyville area near the west coast and Belize City (flat terrain). Although the illustrations are from Belize, the Use Case is written in a general manner so that the same thinking can also be applied in the Caribbean islands, where appropriate.
Problems definition and specifications:
We would like to build a road that crosses a watercourse (river, stream, creek etc.) and we need to allow the water to pass through or under the road under most flow conditions, so that the road remains passable. As flow will naturally vary in a watercourse and will depend on many factors, including: season, rainfall conditions and land use etc., we will need to allow for a range of flow conditions. The most important, in terms of designing a crossing, are the very high flow conditions. If the crossing cannot allow all this water through the structure without holding some back then water will build up behind the structure and cause flooding problems, including possibly overtopping the road and eroding the banks/road support. This means that in order to design a crossing of sufficient size, we need to know the more extreme flows that we expect at that location and what design return period the crossing should remain passable for. Finally, it is important to understand the wider catchment/basin context of the crossing in order to avoid inadvertently making conditions worse downstream while also allowing for future changes upstream.
Data requirements:
The actual data requirements for a road project are very extensive and we cannot detail all possibilities here. However, it is possible to group the data at different levels based on the scale under consideration. At the coarsest scale (National scale), route planning can be carried out with national and regional scale data, for example, existing maps and national river networks can show water crossing points and a national flood hazard map can provide a guide in terms of where to expect flooding problems along a route. The next scale down is the catchment scale (local scale) where an understanding of the character of the area that drains to the crossing point is required by the hydrologist. Knowing the character of the catchment area, allows a hydrologist to provide an estimation of what flows might be expected at the crossing. Finally, at the detailed scale, bespoke topographical survey data is required to carry out the detailed design for a crossing as exact levels and sizes are need for construction. The table below shows what kinds of data are used at what scales.
|
Scale\data types |
Topographic (Elevations and terrain) |
Hydrology (flows and catchment characteristics) |
Hydraulics (water levels and flood extents) |
Other (Auxiliary information) |
|---|---|---|---|---|
|
National (1:50,000) |
National elevation contours or digital elevation model (DEM) to identify steep and flat areas. |
Flood hazard maps. River networks. Spatial variation in rainfall. Climate context. |
General catchment slopes to identify backwater areas. Location of other surface water bodies and coastal boundaries. |
Environmentally protected or sensitive areas. Urban areas that may be affected, including downstream. |
|
Local (1:10,000) |
National DEM (e.g. SRTM) or local DEM (e.g. LiDAR) to define catchment and topography slope. |
Catchment rainfall-runoff modelling, river network, land use types, catchment specific gauged flow data. |
DEM and river networks to identify flow paths and processes. |
Catchment characteristics; geology, soil types etc., other catchment issues related to water, e.g. dams, abstractions, management plans. |
|
Detailed (1:5,000 and larger) |
LiDAR DEM or Detailed topographic survey with dGPS. For river channel and road embankment geometry. |
Locally measured flows at site. Historical flood data, frequency, eye-witness accounts of mechanisms. |
Locally measured water levels at site. Photographs or wrack marks from past events. Detailed local hydraulic model of channel and structure. |
Waterway structure details, types & dimensions. Bing & Google imagery. |
Table 1: Data types and scales (Methodology 3.2)
Analysis steps:
These analysis steps apply equally to both new road planning and the redevelopment of existing roads, although for redevelopment, mitigation options may be more limited.
General Application
1. Road alignment planning (typically the responsibility of a Highway Engineer)
1a. Identify crossing locations and flood areas.
This stage of the process is all about understanding the geographical context of the road and its water crossings. It starts by identifying the main route for the road and what watercourses it will cross. Information about existing flooding at these crossing locations can be gained from national flood hazard maps (see Belize NFHM Methodology Report and national flood hazard maps) and historical flood records, or even interviews with people living in the area. If possible, at this planning stage, route alignment can be adjusted to avoid the worst areas of flooding. This can sometimes be a more cost effective option than building large crossing structures in flood affected areas. The other consideration at this stage is the fact that a road can introduce a potential barrier to water flow and therefore become a major source of flood problems locally or have impacts on downstream areas. This is often the case for rehabilitation of existing road crossings that have become a cause of flood problems through, for example, insufficient flow capacity or changing upstream conditions. It should also be remembered that route alignment includes many other considerations (such as environmentally sensitive areas, land ownership etc.) in addition to flood aspects and a holistic catchment approach is required to address these issues successfully as a whole.
1b. Select design return periods
The protection standard for the road and its watercourse crossings need to be identified next. Often these are laid out clearly in national standards to ensure consistency of design and appropriateness for local conditions. As it is not feasible to allow for every possible extreme event, a design return period is often chosen based on the importance of the road and how much a particular standard of crossing will cost. More important national highways tend to be designed to a higher return period and smaller local roads a lesser return period. For example, in the UK, 1-in-100 years for urban areas and villages, 50 years for high value agricultural land, and 25 years for agricultural land. Some countries also have minimum crossing sizes to ensure ease of maintenance and the expected life of the structure often comes into design return period consideration.
2. Estimate water variables (typically the responsibility of a Hydrologist)
2a. Estimate water flows for design return period
Once the location of watercourse and associated issues have been identified, it is necessary to estimate the design flow for the crossing design. The design flow is a flow for a specific crossing design standard and return period. This can be as simple as estimating flows from the catchment (also known as a watershed) area upstream of a water crossing using the Rational method (see Belize NFHM Methodology Report) and design rainfall, or it can involve a complex rainfall runoff modeling exercise (see Belize NFHM Methodology Report). The Rational method, for example, is a simple way of estimating how much of the rainfall landing on a catchment becomes river flow at a particular location. It uses a runoff ratio multiplied by the catchment area to covert the rainfall to a river flow. There are many factors that need to be accounted for in estimating flows in order to do it well, and even then, there is often much uncertainty in the results, unless long term detailed flow measurements are available. From a practical engineering point of view, the important thing to bear in mind, are what assumptions have been used in deriving the flows and how sensitive are the flow estimates to those assumptions. Therefore it is also common to undertake at least a basic sensitivity analysis to see if this matters from a design point of view. The actual method used to determine design flows will be dependent on the complexity of the context and data available. However, even if very little data is available, some estimate can still be derived, enough to at least quantify the scale of the crossing capacity required. It is also common to undertake a basic Rational method application, even if a complex model rainfall runoff model is applied, in order to test that the model results are not unreasonable. For more detail of methods of deriving flows, please see the additional resource links at the end.
2b. Determine other water variables and flow paths
Once we have an assessment of design flows, we need to determine what that flow means in terms of water levels and velocities. These additional watercourse variables are often required for more complex water crossing design. For example, a bridge soffit needs to be sufficiently high above the flood water to avoid blocking flow and causing flooding. Also the velocity of flow may be required for scour calculations, to determine if extra bank protection is required in the vicinity of the water crossing. To translate a design flow into a water level or velocity, some basic understanding of the geometry of the water course channel and crossing capacity is needed. Calculations can be as simple as applying Manning's equation with some estimates of slope and channel size, to complex full 2-Dimensional hydraulic modeling of the crossing, requiring a full topographic survey. The chosen method needs to be appropriate to the scale, importance, and watercourse complexity of the crossing. For example, if the crossing is large (e.g. main river) and conveys an important highway, full hydraulic 2D modeling would be expected, however, if it is a small road culvert on an access road, a simple backwater Manning's calculation would be fine.
Finally, some understanding is required of where water will go (flow paths) if the crossing ends up blocking flows, for example, if a culvert becomes blocked or a flow event occurs that is higher than the design event. This allows appropriate mitigation, such as a reinforced road surface to allow flow to overtop with minimal damage. See Use Case 3.3.4 Flood mitigation for roads for more details. Also see the Belize NFHM Methodology Report.
3. Water crossing design (typically the responsibility of a Structural Engineer)
3a. Hydraulic design of crossing.
This stage of analysis is closely tied with stage 2b above, as the design of the crossing can affect the water variables estimated, and it is common to iterate between the stages to arrive at a final design. For simple culverts in non-complex contexts, it is common to use a culvert calculator program. There are a number of commercial programs available (e.g. CulvertMaster and Culvert Studio, to mention but two) and some free ones such as HY-8 from the U.S. Federal Highway Administration and they all do essentially the same job of allowing the engineer to estimate the hydraulics of the culvert given a design flow. Then the engineer can experiment with different sizes and arrangements of culverts to identify the best design for the purpose. For bridge crossing or culverts in flat areas, more complex 1 or 2-Dimensional hydraulic modeling is required (with extra associated data), as the designs are more complex or the temporary storage and more complex movement of the water needs to be taken into account. For large crossings in steeper areas, a 1D model approach is often sufficient to capture the hydraulic details of the river channels and the structures affect on the flow. For flat areas where floodplain storage is also involved, or there are alternative overland flow paths to the main river, then a 2D model will be necessary. Additionally larger crossings tend to be more costly and therefore require more detailed analysis.
3b. Structural design of crossing
The final stage of the process involves taking the hydraulic dimensions required for the watercourse crossing and designing the structural detail to integrate this into the road alignment. This will include design details such as the culvert/bridge approach wing walls, bank protection, road surfacing and bridge piers etc. Further hydraulic analysis may also be undertaken to assess the impact of scour on the structure, and this will provide information on where to provide additional protection to prevent erosion or undermining of the culvert, which can lead to its complete destruction. Impacts of the structure on the local ecosystem will often form part of an environmental impact assessment (EIA). This involves identifying plant and animal species that will be directly affected by the new structure (including upstream and downstream), and incorporating mitigation into the design of the structure. An example would be fish that pass through the reach that may be blocked by a new structure, requiring a low flow channel in the base of the culvert. (Also refer to Use Case 3.3.4 Flood mitigation for roads, for more detail on the actual road design issues).
Example applications
For the examples utilized in this Use Case, we use the following data:
- The vegetation corrected Digital Elevation Model (DEM) from the Shuttle Radar Topography Mission (SRTM) and contours derived from it. The corrected DEM is part of the CHARIM output from the National Scale Flood Hazard Assessment. See Use Case 8.6 National flood hazard assessment for river flooding.
- National road vectors and urban extents.
- History of local flooding identifying the problem, how often it occurs and to what approximate water levels (photographs and eye witness accounts).
- Rainfall intensities expected at a range of return periods for estimate of flows.
- Bing & Google maps aerial imagery.
(A) Steep terrain - Mount Pleasant Creek
George Price Highway crosses the Mount Pleasant Creek near Belmopan. Here, the flow in the creek annually exceeds the capacity of the culvert underneath the roads, causing the water to back up behind the road embankment and then flow over the top of the road, in this case washing a bus off the road. This road is also the only evacuation route from Belize City during hurricanes and therefore has a high importance for the country. This is an example of a crossing that is located in moderately steep terrain, where flowing water is the main issue and the analysis is relatively straightforward. For the existing road crossing, the culvert's hydraulic capacity appears to be insufficient. An additional point to note here is that part of the city of Belmopan is located in the upstream catchment and the urbanized area has been expanding in recent years leading to increased peak flows at the river crossing. This urbanization issue highlights the importance of accounting for potential future changes and their effects on the road crossing design.
In terms of data availability, there is no detailed topography data available for the location currently, only coarse 90m SRTM DEM data and derived contours. There is no measured flow data for the watercourse. There is a history of flooding with some pictures and eye witness accounts that are very useful in identifying that the limited culvert capacity may be part of the problem. Therefore we will use a simple hydraulic capacity assessment to assess the culvert and its upstream catchment land use, as this can be carried out with the limited data we have now and can be used to identify the relevant issues to consider. If further action is identified as necessary, due to the findings from this initial assessment, then specific and appropriate further data collection and analysis could be undertaken or commissioned. The steps are summarized below:
 |
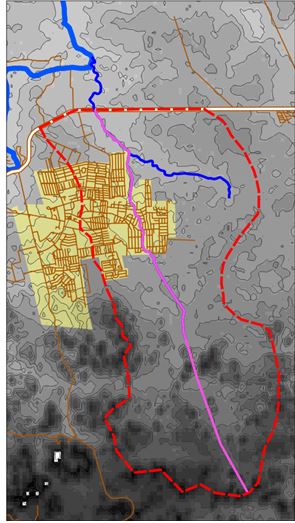 |
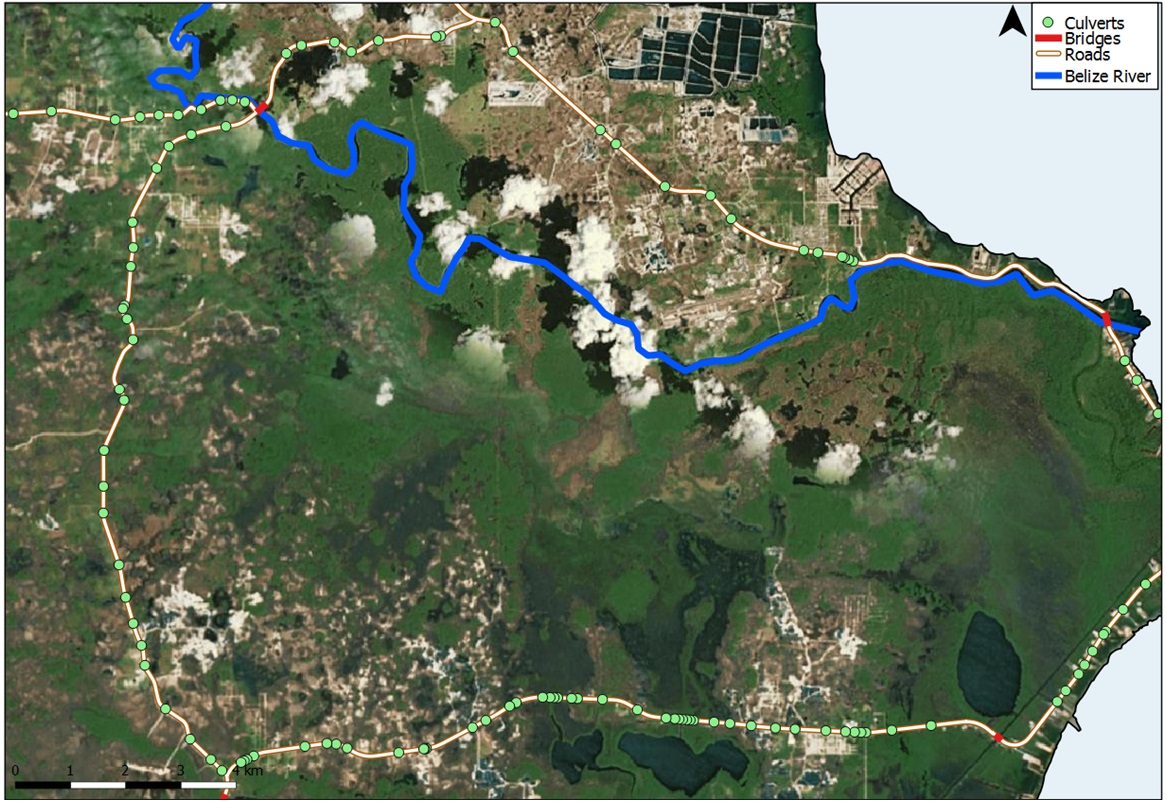
| (i)First identify the water network and highway crossing location. Both roads and river network are from the official Government national GIS layersand details are checked by overlaying with Bing aerial maps. Belmopan can be seen to the West of the Mount Pleasant Creek and Ten Cent Creek. These creeks drain into Belize River to the North. | (ii)Using topography data, identify the catchment area (red dotted polygon) and longest flow path (purple line). In this case, we use 10 m contours derived from the SRTM DEM data (shown in grey) and digitize the catchment by hand. There are automated methods to derive catchments from digital DEMs, but these can produce inconsistent results with poor accuracy DEMs (see Data Management Book 3.2 regarding DEM quality). |
 |
 |
|
(iii) There are no national standards in Belize to guide what Rainfall Intensity Duration Frequency (IDF) to use for engineering design. Study of the small amount of available rainfall intensity data has identified that Miami has similar conditions to Belize and with better long term data (for more details see the Belize NFHM Methodology Report). Miami IDF curves can be used as an analog for Belize. These can be found on the US NOAA, Precipitation Frequency Data Server (PFDS) http://www.nws.noaa.gov/oh/hdsc/index.html This rainfall intensity can then be used with the Rational Method to estimate a flow at the culvert. The Rational method calculates the peak discharge Qp = C I A with the runoff coefficient C, rainfall intensity I, and the drainage area A. |
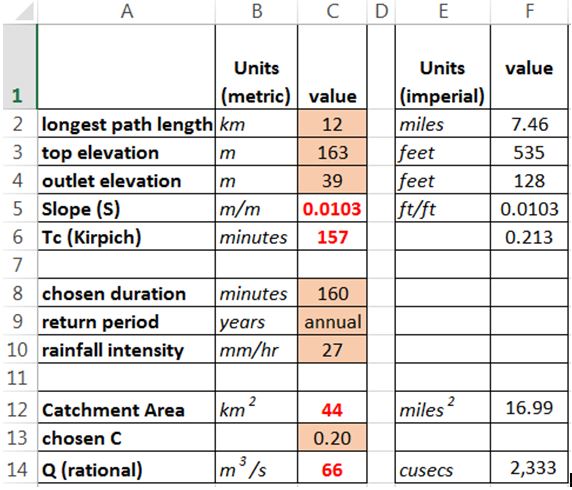
(iv) We then use a spreadsheet where we implement the Rational Method (formula and example calculator can be found here http://rational.sdsu.edu/), which calculates a flow at the culvert from the catchment area and rainfall intensity with an assumed runoff coefficient. From the GIS in (ii) we know the longest flow path in the catchment is 12 km and using the Kirpich formulae (see Belize NFHM Methodology Report), this gives a time of concentration for the catchment of ~157 minutes. This means we should use the 160 minute rainfall intensity data as this is the closest value in the IDF table to 157 minutes (or we can interpolate a more precise value). We choose an annual design return period in order to see if the culvert can pass the annual high flow. Together with the catchment area and an assumed runoff coefficient (see (v)), this gives us a flow of 66 cubic meters per second (cumecs).
|
 |
 |
|
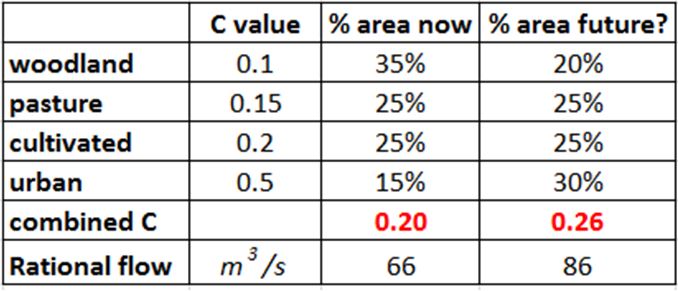
(v) Each land use type has a different response to rainfall and therefore requires different coefficients. For this catchment, we estimate the % area for each land use and sum the coefficient values weighted by the % area and arrive at the combined coefficient of 0.2. The Rational method is very simple and will produce different results with different assumptions, therefore it is always good practice to carry out a sensitivity test on chosen values. In this case, we assume that as Belmopan grows, the % of urban area in the catchment increases and calculate a new C and Q. This results in a new C of 0.26 and increased flow of 86 cumecs. |
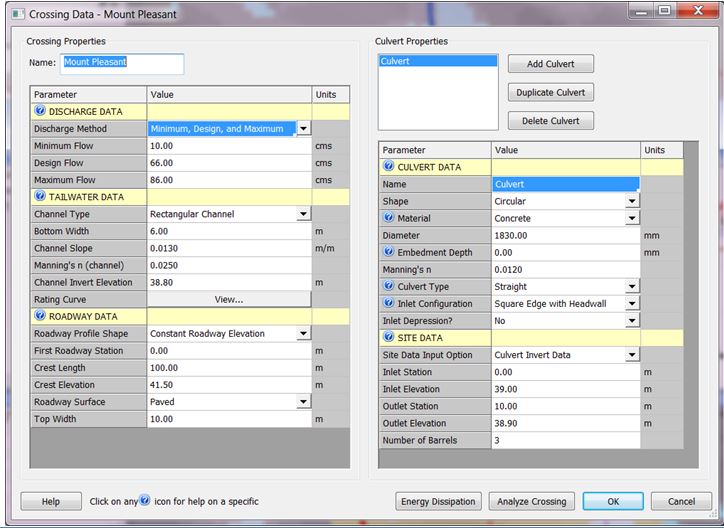
(vi) Now we have a design flow, we can use a culvert calculator such as HY-8 to calculate the hydraulic capacity of the culvert. The figure above shows the basic input data needed. We need some basic details about the culvert size and number of barrels, invert levels and flows. In this case, we have estimated some of the data from the SRTM DEM and pictures of the culvert. Ideally these data would be surveyed at the culvert for more accurate results. However, it is still possible to carry out a first pass analysis with the data we have got already.
|
 |
 |
|
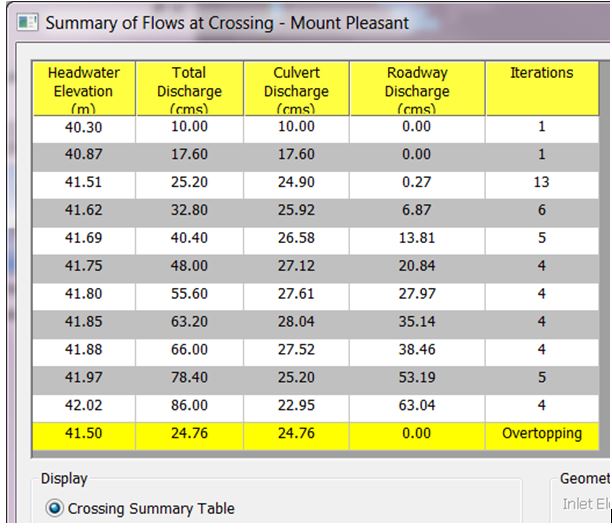
(vii) The analysis results in a table of results for a range of flows entered. In this case we entered 10, 66 and 86 cumecs to understand the behavior of the culvert over this range of flows. From the results we can see that the 3 barrel culvert has a flow capacity of around 25 cumecs, well below that required if the annual peak flow is around 66 cumecs.
|
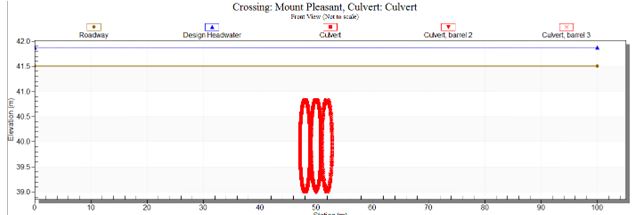
(viii) This figure shows the front view of culvert at the 66 cumecs flow. The brown line is the road deck and the blue line above it, is the water overtopping the road. The water overtops the road by ~0.4 m which matches observations and images of the flooding. If we experiment with the calculator by adding additional barrels, we find that we actually need ~9 barrels to take the 66 cumecs flow, so we can conclude that the culvert is significantly under capacity. |
Now we have a better understanding of the flood hazard related to the current route, we can start to explore options to address the problem. In this case, upgrading the capacity of the existing culverts is an obvious solution. However, this is not the only option, and a better approach may be to increase the capacity, while also considering more control on the urbanization and any vegetation clearance in the upstream catchment – a catchment management approach. Straightening the watercourse channel approaching the culvert (very locally) and increasing the channel capacity will reduce problems around the culvert a little by reducing friction losses through the culvert, but this will not fully address the main capacity issue. Straightening channels upstream in the general catchment could cause more problems by increasing the speed at which water arrives at the culvert, leading to a higher peak flow. The downstream confluence of the creek with the Belize River may also create some backwater problems at the culvert and should be checked. Another option might be to look for bypass routes to function when the main route is flooded. This could be through enlarging or connecting existing nearby urban access routes or building a new bypass route connecting to the east side of the city. It would be important to ensure that any bypass route is not affected by the same flood hazard as the existing route, or both will be blocked.
Results
For the Mount Pleasant Creek culvert, we found that the culvert is undersized for even the peak annual expected rainfall and may be exacerbated by future growth of Belmopan. We chose an annual design return period in order to see if the culvert can pass the annual high flow, because we know from reports and photographs that this is an annual problem. Ideally for a major highway, you would chose a higher return period flow for the design, for example, we might pick a 1-in-10 or 30 year return period. In Europe or the US, it is common to use very high return periods for major infrastructure, however, in tropical countries with regular high intensity rainfall, the cost of this level of design may be prohibitive and an appropriate local standard should be decided, depending upon road importance and design cost.
The level of analysis applied in this Use Case is relatively simple and should be considered as a first level analysis of the issues. An actual design by an Engineer for this particular crossing would go into much more detail than we have covered here. For example, detailed topography around the culvert would be surveyed (or LiDAR DEM used) and more detailed hydraulic modeling may be conducted. A more comprehensive assessment of hydrology and flows would be expected, with thorough sensitivity testing of the assumptions included in the assessment.
(B) Flat Terrain - Ladyville area.
The coastal Ladyville area, just to the west of Belize City, is an example of road construction in a very different context to that described in example (A). It illustrates a common challenge when crossing a river as it approaches the sea, where floodplains are wide and flat.
The terrain is very flat, with very little in the way of drainage slope to drive flow through culverts. The elevation is between zero and five meters above sea level, and therefore is subject to coastal storm surges as well as swampy conditions, particularly south of the Belize River. The water network is very complex, with floodplain lakes and swamps with very poor drainage, resulting in standing water for long periods. This means that it is very difficult to define a drainage catchment for a particular local water course and its associated road crossing. Therefore estimating flows, in order to carry out the hydraulic design of a culvert, is particularly challenging.
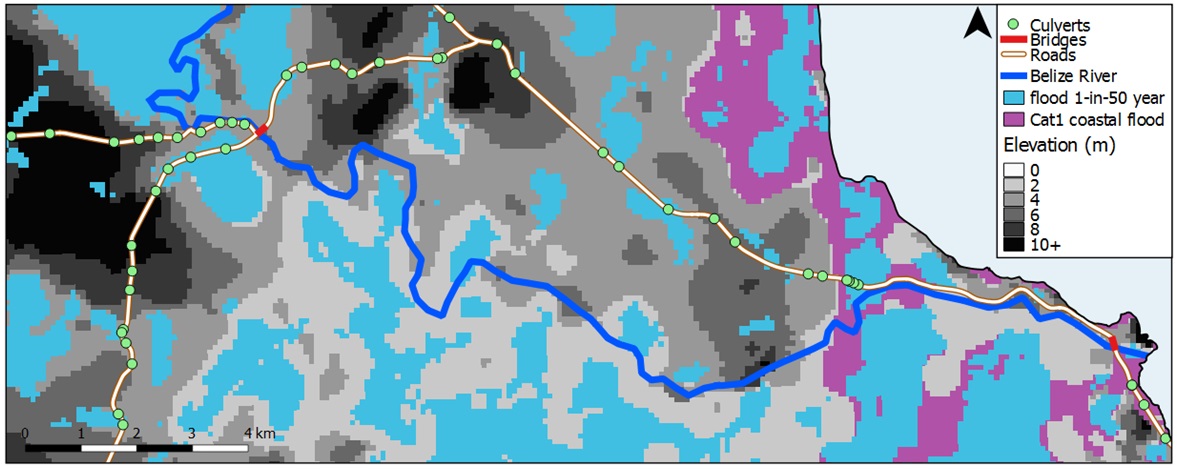
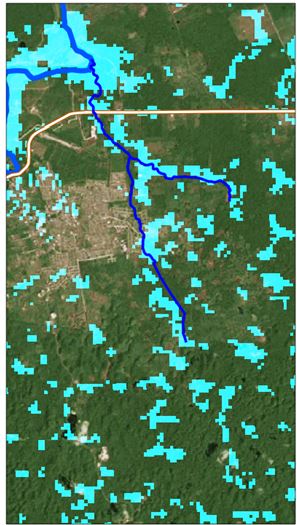
In fact, it may be impossible to define an exact water course crossing location, as a road may cut across flood affected areas which are not always wet. This is illustrated above with the national indicative flood hazard map showing river, rain and coastal flood hazard. In terms of hydrology, the area is very complex due to the low gradients and multiple sources of water. Large areas are flooded and swampy and drainage may be via shallow, low velocity flow across wide areas rather than just through rivers, as such, flows may even reverse under different hydraulic conditions. Building the road above flood levels may mean that the road embankment itself may obstruct this natural drainage and prolonged standing water may cause saturation issues for the road substructure even if a road surface is not flooded. There are also sections of the Phillip S.W. Goldson Highway which are parallel to the main Belize River and therefore may be subject to bank erosion as the river naturally attempts to meander across its floodplain. Culvert and bridge design for roads in these conditions is complex and multifaceted and often requires a full hydrological and hydraulic modeling exercise, with all the detailed topographical and hydrological data that entails.
By way of illustration, here we will consider the road section of the Burrell Boom Cut at the location where it crosses the Belize River (top left bridge in the image above) and discuss that steps would be required in analysis of this crossing area.
(i) The first stage of the process would involve a thorough hydrological study of the natural water systems in the area. This would show that the Belize River is the dominant watercourse and that it has a large catchment and therefore requires a detailed assessment of the design flows expected at the crossing location. The flow analysis would require something more sophisticated than the Rational Formula in this case, due to the size of the river and catchment, and would probably need a combination of gauged flow analysis (See Belize NFHM Methodology Report) (there are a number of river gauges on the river and hydrological modeling). The modeling would be necessary as, just upstream of our study location, the Belize River is connected to the Crooked Tree lagoons via the Black Creek and this connection functions as flood storage when the Belize River level is high, causing reverse flow in the Black Creek taking flood flows into the Crooked Tree lagoon system. This extra flood storage and the connectivity of the bi-direction flowing rivers will have a big influence on reducing the peak flow at the crossing location. However, after the peak of a flood event, the draining of this storage will also sustain high water levels in the river for longer, extending the length of the flood event.
(ii) Once we have a good understanding of the hydrology at and around the crossing area, a detailed hydraulic assessment of the crossing can be carried out. In this case, the location area is very flat and is low lying and the swampy lagoons downstream of the crossing will likely cause backwater effects at the crossing location. Backwater is a term used to describe when water levels are higher than they would be normally be when water flows freely. Here this would be due to the standing water downstream slowing the velocity of the river flow, causing an increase in the water levels upstream at the crossing. To understand this water system properly requires good topography data for the area and a hydraulic model that incorporates storage and the connections between the storage and can model the dynamics of the flows. A 2D hydrodynamic model would be ideal for this (see Belize NFHM Methodology Report).
(iii) Structural design. It is likely that due to the size of the river being crossed, a full bridge (rather than culverts) would be required. The hydraulic capacity of the bridge would need to be sufficient to pass the design flows. In addition here, we can see from the national flood hazard maps, that flood water is likely to come out of bank upstream of the crossing and flow down the floodplain and therefore is not just contained in the river channel at the bridge location. The whole road section may thus need elevating above the water levels expected in the river AND floodplain in this flat area to remain passable. However this will have the effect of blocking the flows in the floodplain and the water will back up behind the road embankment even if the bridge has sufficient capacity. One common solution to this, is to build a multiple span bridge over the whole floodplain, allowing water to pass freely under the road for the entire width of the floodplain. An example of this is shown in the picture below of the Waal river floodplains with 'De Oversteek' bridge construction, Lent, the Netherlands.
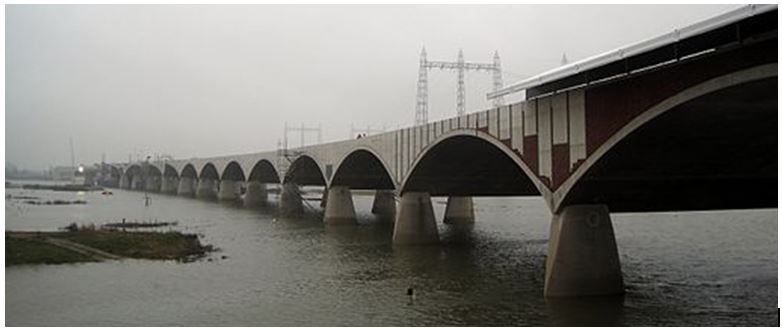
(source Bj.schoenmakers, Wikipedia)
While this method tends to have the least impact on the river and floodplain, it can be expensive. Another approach is to provide flood relief culverts on the approach road to the bridge to allow sufficient extra flow capacity for floodplain flows. An example of this is shown below for the River Eden in the UK, where a single span bridge is combined with 14 flood relief culverts at floodplain level and one small water way culvert (at a lower elevation).
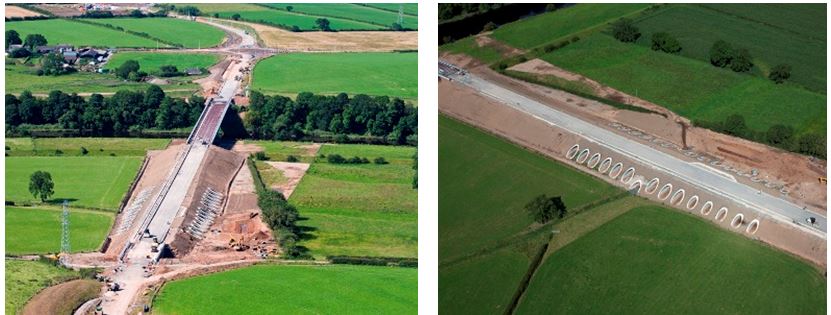
(Source: Cumbria County Council, UK, http://www.cumbria.gov.uk/)
The structural design stage often entails a number of iterations, where one or more initial designs are tested, by including the planned dimensions in the hydrodynamic model to assess the effect on the flows and hydraulics, as well as the effect of the flows on the bridge (e.g. scour velocities). The selected design is further refined as the full road crossing design evolves to include all relevant factors; traffic capacity, pier design, ecological mitigation requirements, scour protection etc.
For this level of assessment and road design, large amounts of data are required, much of it specific to the project. Often this data will require collection as part of the project. Examples of data that we might need for the Belize River crossing would be: (i) detailed topographic surveys in the crossing location and of the floodplain upstream and downstream, (ii) bathymetry of river channels and any lakes/swamps that may be important to the flood storage in the system, (iii) structure surveys for existing structures, (iv) water level surveys to identify hydraulic gradients, which may involve installing long term instrumentation to monitor how these change over seasons, (v) local rainfall monitoring and flow measurements for model input and calibration/validation, (vi) ecological and archaeological surveys to undertake environmental impact assessment.
Results
The end result of this often complex process should be a full crossing design appropriate to the context. It will include a full assessment of the crossing's impacts (and required mitigation) on the surrounding environment. There will be many choices that are made during the assessment and design process and these will often be a compromise between potentially conflicting factors, such as budget available and protection levels or environmental impact.
Conclusions:
The design of a road crossing water is a complex process, but hopefully this Use Case provides a straight forward break down of the key elements in the process. Watercourse crossings in areas with different terrain characteristics will often require different approaches in analysis method, e.g. those with flowing water and those with standing water. The final crossing design will be a compromise between cost, standard of protection or capacity and ideally there should be national standards to guide this compromise. Local context is vitally important for the design process and external consultants should include an element of research to access and collect local data in their methodology, for the design to be relevant.
Lack of national standards can be a real problem for the application of this design process and can result in inappropriate methods and standards being applied from other countries that do not experience the conditions specific to Belize and the Caribbean. However, it is possible to use other countries' data and methods if it can be demonstrated that they are appropriate. Ideally national hydrometeorological networks would be strengthened to collect required long term data that would underpin the development of these standards.
If the road crossing design is at a feasibility stage, then the results can inform decisions related to identifying appropriate funding for the full construction project, and may also identify other studies that are required before a final design can be finalized.
The rich quantity of data and information that results from a road design process can also prove invaluable for other projects in the area or even nationally. For example any topographical, hydrological or metrological data collected should be considered as a valuable national asset and should be retained by the roads agency or hydrological services so that this can provide ongoing value to the country in terms of other projects, national studies and research.
More detailed resources available online
The reader is referred to the Methodology Book section 3.4 fluvial flood modeling for more detail or the many excellent free web resources listed below for more detail on the methodology summarized in this Use Case. Just remember to ensure the application of the methods is appropriate to Caribbean conditions, i.e. high intensity tropical/subtropical rainfall and hurricanes.
References
Design Manual for Roads and Bridges: Volume 4 Geotechnics and Drainage (Vol4, Sec2). UK Highways Agency. (http://www.dft.gov.uk/ha/standards/dmrb/vol4/section2.htm)
The Fluvial Design Guide. UK Environment Agency (http://evidence.environment-agency.gov.uk/FCERM/en/FluvialDesignGuide.aspx)
Engineering in the water environment: good practice guide. Scottish Environment Protection Agency (http://www.sepa.org.uk/water/idoc.ashx?docid=fa231e19-ed87-4417-91d1-fda918bc56c0&version=-1)
Roadway Design, Drainage manuals and handbooks. Florida Department of Transport. (http://www.dot.state.fl.us/rddesign/Drainage/ManualsandHandbooks.shtm)
Last update: 15-07-2016