

This section introduces the definitions for landslide inventory, susceptibility, hazard and risk, and discusses the various scales of analysis and the characteristics of the Windward islands that will guide a user in selecting the appropriate analysis methods for a particular scale of analysis.
Keywords:
Landslides, definitions, mass movements, scales
|
Author |
Links |
|---|---|
|
Cees van Westen |
|
Definitions: landslide inventory, susceptibility, hazard and risk
The terminology used here follows that of the Guidelines for landslide susceptibility, hazard and risk assessment and zoning, produced by the comprehensive landslide research project "SAFELAND, Living with landslide risk in Europe: Assessment, effects of global change, and risk management strategies", funded by the European Commission. The guidelines were also worked out as a publication by Corominas et al. (2014), based on a large number of literature sources, among which Fell et al (2008), TC32, UN-ISDR (2004).
 Landslide inventory: The collection of landslide features in a certain area for a certain period, preferably in digital form with spatial information related to the location (as points or polygons) combined with attribute information. These attributes should ideally contain information on the type of landslide, date of occurrence or relative age, size and/or volume, current activity, and causes. Landslide inventories are either continuous in time, or provide so-called event-based landslide inventories, which are inventories of landslides that happened as a result of a particular triggering event (rainfall, earthquake). More information on landslide inventories can be found in Data Management Book 4.3 and Use case 9.3.
Landslide susceptibility map: A landslide susceptibility map contains a subdivision of the terrain in zones that have a different spatial likelihood that landslides may occur. The likelihood may be indicated either qualitatively (as high, moderate low, and not susceptible) or quantitatively (e.g. as the density in number per square kilometres, or area affected per square kilometre). Landslide susceptibility maps should indicate the zones where landslides have occurred in the past and where they may occur in future and possibly also the run-out zones. More information on landslide susceptibility can be found in Section 4.3, and Use Case 8.3 and 8.4.
Landslide hazard map: The subdivision of the terrain in zones that are characterized by the expected intensity of landslides within a given period of time, or the probability of landslide occurrence. Landslide hazard maps should indicate both the zones where landslides may occur as well as the run-out zones. Landslide hazard maps differ from landslide susceptibility maps as they would indicate for specific zones, what can be expected, with which frequency and with which intensity. A complete quantitative landslide hazard assessment includes:
- Spatial probability: the probability that a given area is hit by a landslide.
- Temporal probability: the probability that a given triggering event will cause landslides
- Volume/intensity probability: probability that the slide has a given volume/intensity
- Run-out probability: probability that the slide will reach a certain distance downslope
Depending on the scale of the hazard assessment, and the available input data, hazard may be expressed in different ways, for instance as failure probability, safety factor, or as the expected landslide density for a given return period.
Landslide Risk Map: a sub-division of the terrain in zones that have a certain frequency and magnitude of losses that might occur within a given period of time and for a given set of elements-at-risk as a result of landslides. The losses may be expressed qualitatively as classes of Frequency-loss combinations, or quantitatively as exposure (quantification of the number/length/area of elements-at-risk exposed to hazards), monetary losses (e.g. Average Annual Losses) or population losses (societal or individual risk). Risk is analysed by calculating losses as a multiplication of vulnerability and exposure for certain hazard scenarios with a given frequency.
Figure 2: Components of landslide inventory, susceptibility, hazard, vulnerability, exposure and risk analysis.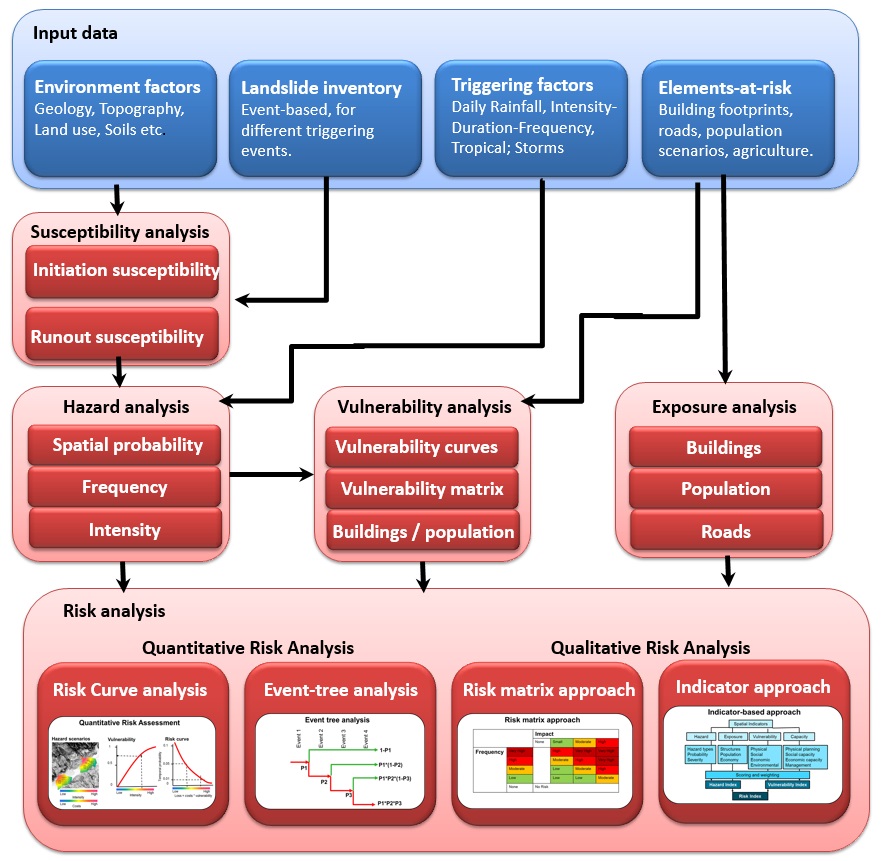
Figure 2 gives the framework for landslide risk assessment with an indication of the various components. The first component deals with the input data required for a landslide susceptibility, hazard and risk assessment, focusing on the data needed to generate susceptibility maps for initiation and runout, triggering factors, landslide inventories and elements-at-risk. The input data will be discussed in the Data Management Book (Section 2.3 and section 4.3). Elements-at-risk are the population, properties, economic activities, including public services, or any other defined values exposed to hazards in a given area (See session 5.2). They are also referred to as "assets". Elements-at-risk also have spatial and non-spatial characteristics. There are many different types of elements-at-risk and they can be classified in various ways. The way in which the amount of elements-at-risk is characterized (e.g. as number of buildings, number of people, economic value or the area of qualitative classes of importance) also defines the way in which the risk is presented.
The next block is susceptibility assessment, which can be divided into two components. The first susceptibility component is the most frequently used, and deals with the modelling of potential initiation areas (initiation susceptibility), which can make use of a variety of different methods (inventory based, heuristic, statistical, deterministic), which will be discussed in the next session 4.3. The resulting maps may form the input as source areas in the modelling of potential run-out areas (runout susceptibility).
The third block deals with landslide hazard assessment. Hazards are characterized by their temporal probability and intensity derived from frequency magnitude analysis. Intensity expresses the severity of the hazard, for example maximum movement velocity, total displacement, differential displacement, depth of the moving mass, peak discharge per unit width, or kinetic energy per unit area. The hazard component in the equation actually refers to the probability of occurrence of a hazardous phenomenon with a given intensity within a specified period of time (e.g. annual probability). Landslide hazard assessment heavily depends on the availability of so called event-based landslide inventories, which are inventories of landslides caused by the same triggering event. Only by linking landslide distributions to the temporal probability of the triggering event, it is possible to carry out a magnitude-frequency analysis. Event-based landslide inventories are also used to determine the spatial probability of landslide initiation and runout, and to determine the size probability of potential landslides for a given return period.
The fourth block focuses on vulnerability assessment and indicates the various types of vulnerability and approaches that can be used. The focus is on the use of expert opinion in defining vulnerability classes, and the application of available vulnerability curves or vulnerability matrices. Most of the focus is on determining physical vulnerability of elements-at-risk. Other types of vulnerability (e.g. social, environmental, and economic) are mostly analyzed using a Spatial Multi-Criteria Evaluation, as part of a qualitative risk assessment. More information on vulnerability is given in session 5.3.
The fifth block refers to the exposure analysis. Exposure indicates the degree to which the elements-at-risk are actually located in an area affected by a particular hazard. The spatial interaction between the elements-at-risk and the hazard footprints are depicted in a GIS by map overlaying of the hazard map with the elements-at-risk map (Van Westen, 2009).
The last block gives the concept of risk assessment which integrates the hazard, vulnerability and amount of elements at risk (Van Westen et al., 2008). They are characterized by both spatial and non-spatial attributes. Risk analysis can be carried using a number of methods, subdivided in qualitative and quantitative methods, which are further explained in chapter 5.
For further explanations on hazard and risk assessment the reader is referred to textbooks such as Alexander (1993), Okuyama and Chang (2004), Glade, Anderson, and Crozier (2005). Smith and Petley (2008) and Alcantara-Ayala and Goudie (2010).
Scales of landslide zonation
Landslide zoning can be carried out at different scales. Table 1 gives an overview of the scales of analysis that are applicable for the Windward Islands. Although at international level there is a certain agreement with respect to the scales defined for hazard zonation, these may differ depending on the size of the country. The four Caribbean countries are all relatively small in size, ranging from 306 km2 (Grenada) to 754 km2 (Dominica). In comparison to other countries this is actually very small for a national scale assessment and would be comparable to a medium scale assessment for other countries. Given the relatively small size of the Windward Islands the national scale of around 1:50,000 is similar to what would be called a medium scale in larger countries. There are many objective where landslide information is important. These are summarized in Table 1, and links to examples are given to the related use cases.
Table 1: Landslide mapping scales and types of landslide zoning
|
Scale |
Objective of the study |
Requirements |
Use Case |
|---|---|---|---|
|
National scale 1:50,000 5 m pixel size |
Multi-Hazard exposure and risk analysis. |
Inventory, susceptibility, exposure, holistic vulnerability |
|
|
National land use maps. |
Inventory, susceptibility |
||
|
National road network management |
Inventory, susceptibility |
||
|
National forest and watershed management |
Inventory, susceptibility |
||
|
Local scale 1:10,000 1 m pixel size |
Local land use planning |
Inventory, susceptibility |
|
|
Planning new buildings |
Inventory, Susceptibility, hazard and qualitative risk |
||
|
Planning relocation of buildings |
Inventory, Susceptibility, hazard and qualitative risk |
||
|
Input data for land subdivision process |
Inventory, Susceptibility, hazard |
||
|
Input data for building permit |
Inventory, Susceptibility, hazard |
||
|
Early Warning |
Hazard |
||
|
Site investigation scale >1:5,000 1 m pixelsize |
Design guidelines for buildings |
Hazard and quantitative risk |
|
|
Design guidelines for roads |
Hazard and quantitative risk |
||
|
Design of mitigation measures for buildings |
Hazard and quantitative risk |
||
|
Design of mitigation measures for roads |
Hazard and quantitative risk |
||
|
Early Warning |
Hazard and quantitative risk |
Landslide zoning may serve as an important input data for land developers/planners or engineers developing critical infrastructure (such as roads). In all three events it is important to consider so-called hazard scenarios, which relates to the occurrence of a number of landslides triggered by a rainfall event with a certain magnitude-frequency relation.
The techniques to obtain input data for the landslide inventory and susceptibility maps vary in a wide range, resulting in various levels of quality and quantity of data. In general, some common input data are used for all cases, i.e. landslide inventories, geologic, geomorphologic and soil maps. The scale of analysis has a large influence on the type of input data that can be collected, as is further explained in Data Management Book, Section 2.3.
Based on Table 1 and the data availability situation in Dominica, Saint Lucia, Saint Vincent and Grenada it is currently only possible to generate landslide susceptibility maps at the national scale, and it is not possible to generate a national landslide hazard map, as we are not able to represent spatial, temporal, size and run-out probability for landslides for the entire islands at a scale of around 50.000, giving the limitations in the available data. These limitations are mostly related to lack of sufficient information between the relation of the frequency and magnitude of triggering events (extreme rainfall) and the landslide caused by them. At a national scale it is currently only possible to generate a qualitative map that shows the subdivision of the terrain in zones that have a different likelihood that landslides of a type may occur, without actual information on the frequency of landslides for different return periods, the size probability and the run-out probability. At best it is possible to generate national scale qualitative landslide hazard maps that have semi-quantitative descriptions of the legend classes, indicating the expected landslide densities for different return periods.
More detailed information may be available at local scales, although there it will still be quite difficult to properly characterize the hazard in terms of landslide density and frequency. Risk can be analysed using qualitative methods (e.g. risk matrix approach). At site specific level enough data should be available to generate quantitative hazard and risk maps as the basis for prevention actions (e.g., prohibition to build in at very high risk exposed areas), mitigation measures (e.g., construction of control works) or preparedness activities (e.g., organization of evacuation plans and installation of warning systems).
Complexity of the study areas
The islands also have a relatively small population, ranging from 72,000 (Dominica) to 182,000 (Saint Lucia). The population is concentrated mostly along the coast, due to the steep centres of the islands. Therefore the population density figures in Table 4.2 are not representative for the actual settlement areas. The urban centres in most of the countries are relatively poor developed, with many unused buildings. Development of residential areas takes place in the hills surrounding the capitals, which lead to building constructions in landslide prone areas. Since building control is relatively weak or absent, there is no consideration of optimal sites for construction with respect to natural hazard avoidance. The islands have road networks that have very limited redundancies. Primary road networks generally follow the coastlines, passing a number of flood and debris flow prone gulleys, and passing stretches below steep cliffs next to the coast line. Some stretches that pass the higher parts of the islands (e.g. Dennery to Castries in Saint Lucia, Airport road in Dominica) are specifically landslide prone.
All island are volcanic origin with a series of volcanos in the centre part of the island, some of which are considered active (especially Sourfriere volcano in Saint Vincent, and 9 in Dominica). Soufriere volcano in Saint Vincent has produced a series of volcanic debrisflows in historic times. The submarine Kick-em-Jenny volcano, north of Grenada has produced several tsunamis in historic times.
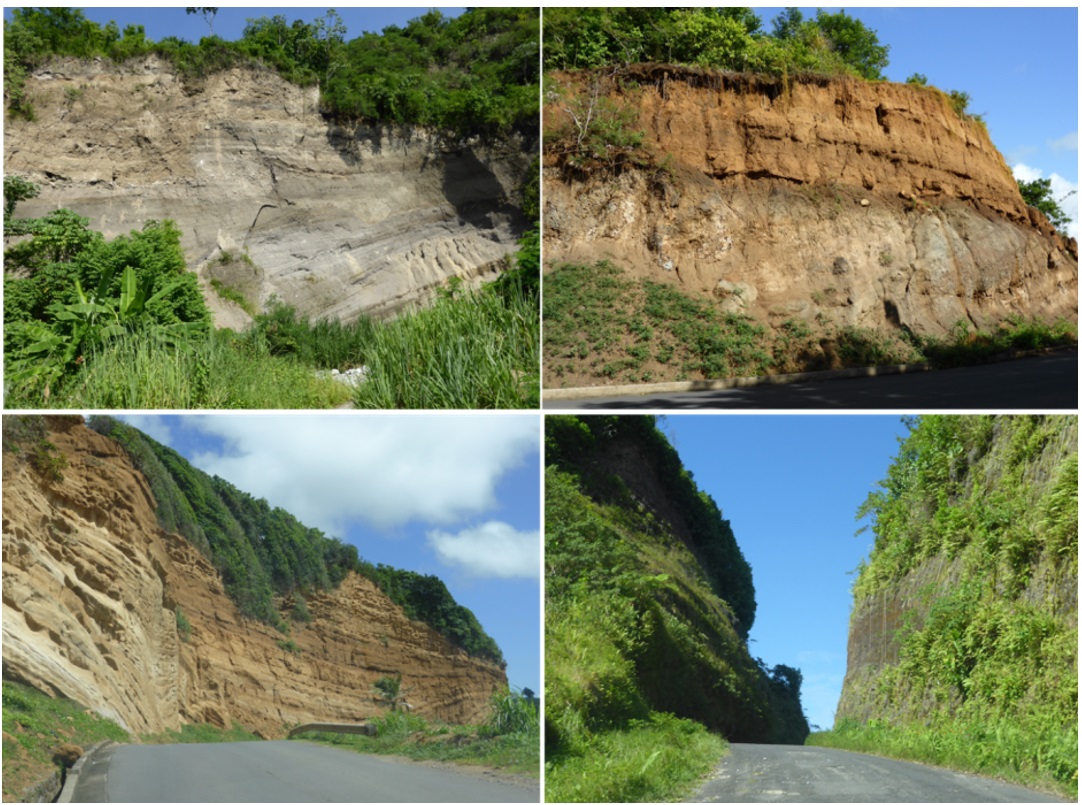
The geology of the islands is composed of volcanic rocks with strongly varying composition, such as ignimbrites, lava flows, lahar deposits, and volcanic ashes. They are very heterogeneous and have not been mapped in great detail in any of the islands. There is often a vague difference between the term rocks and soils in engineering terms, as many of the volcanic deposits have a relative low degree of cementation and consolidation. Also due to the intense tropical weathering unconsolidated materials may be very thick (See Figure 3). These deposits may sustain near vertical road cuts which are stable, however, when weathering is taken into account such road cuts may cause problems in future.
The large heterogeneity of volcanic deposits is unfortunately not portrayed in the available maps for the islands. The geological maps are rather general and do not focus on the specific volcanic deposits. The soil maps are more detailed and show a large differentiation, but they are focusing on pedologic soil characteristics for agriculture purposes.
Figure 3: Examples of outcrops in volcanic deposits indicating that the differentiation between rocks and soils is often arbitrary due to the relative degree of consolidation of the volcanic deposits, their heterogeneity and the effect of weathering.
The landslides in the islands are predominantly shallow soil slides and flow slides, which may turn into debrisflows, or hyper concentrated flows that affect buildings and bridges located in the lower channels. Landslides occur mostly in the soil cover, which is of varying thickness, and doesn't seem to be related to one particular type of soil. Landslides may occur in different land cover types, and also landslides occurring in tropical forests or plantation areas are quite common in the area. Most of the landslides seem to be first time failures, and relatively few are reactivations of older landslides.
Although the main type of landslide is shallow soil slides, rock falls are also quite common along the steep cliffs and may affect roads in several of the islands (e.g. Stowe area in Dominica). Deep seated landslides are relatively rare. One of the most spectacular ones is located in Dominica (See Figure 4).
Due to the tropical climate the vegetation recovery within the areas affected by landslides is extremely fast. For instance, the landslide that killed one person in a relocated settlement in Manning village in December 2013, was already completely vegetated by September 2014. This forms one of the major obstacles in the landslide inventory mapping from images. Unless the images are taken within a few months after the triggering event, it becomes very difficult to recognize them as such.
Landslides are very common along the road network (See Figure 5). They are in most of the cases related to failures upslope of the road with landslide materials covering the road. However, also quite some examples are found where landslide occurs below the road, due to poor drainage, and where roads are undercut by landslides. There are relatively few examples where the road is on an active moving landslide (most examples are found along the airport road in Dominica).
Figure 4: Several landslide examples that have caused destruction in the target countries. Upper left: A landslide at Rose Bank on South Leeward island in St. Vincent and the Grenadines; Upper right: Deep-seated landslide which caused the damming of Mathieu river in Dominica, leading to a devastating debris flow in 2011 along Layou River. Lower Left: Shallow flow slide killing a family and obstructing the road along the leeward road in Saint Vincent. Lower right: Debris flow at Fond St. Jacques during Hurricane Tomas in 2010.
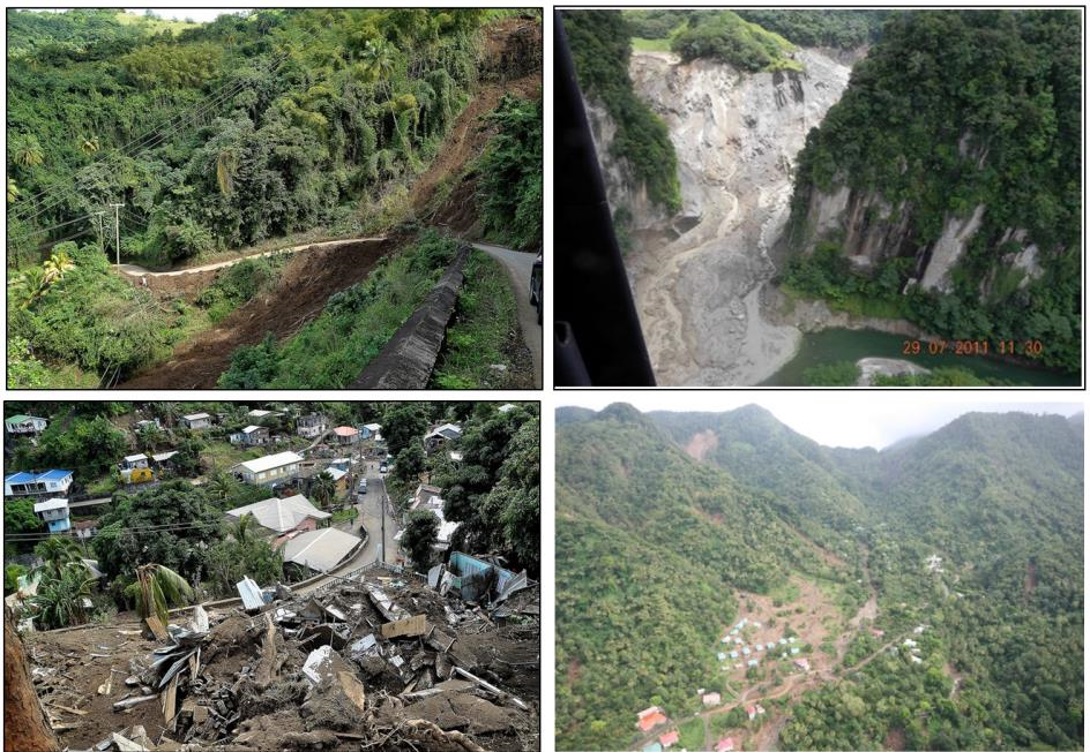
Figure 5: Google Earth image showing the large landslide on the confluence of Mathieu River and Layou River in Dominica that created a dammed lake which broke out catastrophically later.
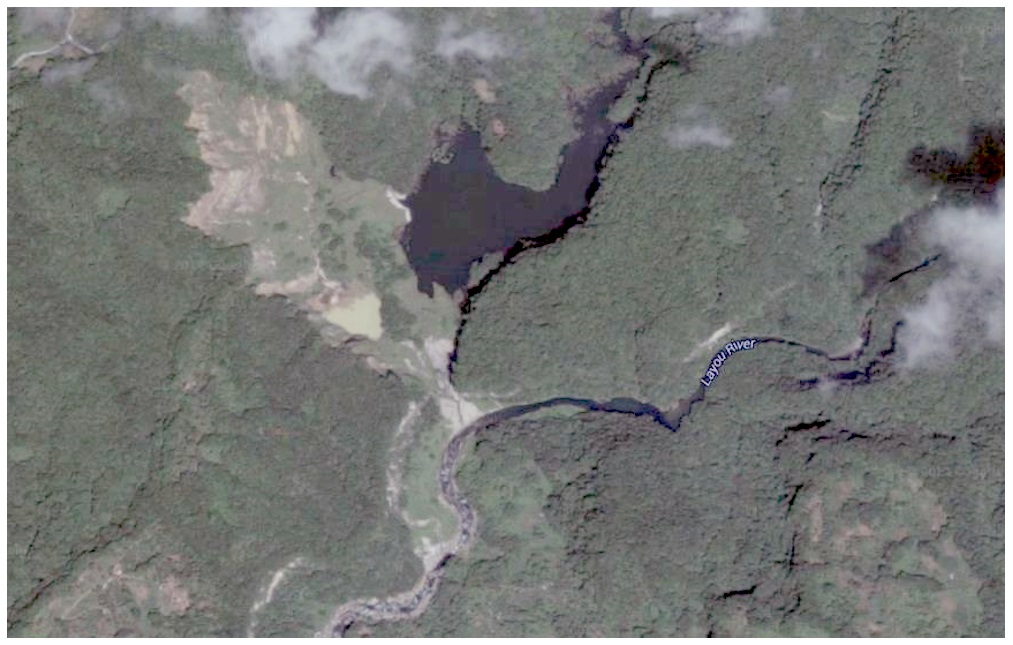
Figure 6: Examples of landslide problems along the road corridors. Upper left: A landslide at the tunnel entrance in St. George, Grenada that happened 21/9/2014. Upper right: A landslide affecting the road from Roseau to the airport, Dominica. Lower Left: Landslide that destroyed primary road in Belmont area, Saint Vincent. Lower Right: Rockfall in road to Stowe, Dominica.

References
Alcantara-Ayala, I. and Goudie, A.S. (2010) Geomorphological Hazards and Disaster Prevention. Cambridge University Press. Cambridge. 291 pp
Alexander, D. (1993). Natural disasters. UCL Press Ltd., University College, London.
Dai, F.C., Lee, C.F., Ngai, Y.Y., 2002. Landslide risk assessment and management: an overview. Engineering Geology, 64: 65-87
Fell, R., Corominas, J., Bonnard, C., Cascini, L., Leroi, E., Savage, W.Z., (2008). Guidelines for landslide susceptibility, hazard and risk zoning for land use planning. Engineering Geology, 102, 85-98
Glade, T., Anderson, M., Crozier, M.J., (2005). Landslide Hazard and Risk. John Wiley & Sons, Ltd., Chichester, England, 802 pp
Hungr, O., McDougall S., Wise M., Cullen, M. 2008. Magnitude : frequency relationships of debris flows and debris avalanches in relation to slope relief. Geomorphology 96: 355 : 365
IAEG 1990. Suggested nomenclature for landslides. International Association of Engineering Geology Commission on Landslides,, Bulletin IAEG, No. 41,.13-16.
IUGS Working Group on Landslides, Committee on Risk Assessment, 1997. Quantitative ris assessment for slopes and landslides : the state of the art. In D. Cruden & R. Fell (editors). Landslide risk assessment. A.A. Balkema, Rotterdam. pp. 3-12
Lee, E.M., Jones, K.C. 2004. Landslide Risk Assessment. London:Thomas Telford Books
Okuyama, Y., and Chang, S.E. (eds) (2004). Modeling spatial and economic impacts of disasters. Springer, Advances in spatial science. 329 pp
Smith, K. and Petley, D.N. (2008). Environmental hazards. Assessing risk and reducing disaster. Taylor & Francis, London.
UN-ISDR, 2004. Terminology of disaster risk reduction. United Nationas, International Strategy for Disaster Reduction, Geneva, Switzerland http://www.unisdr.org/eng/library/lib-terminology-eng%20home.htm
Van Westen, C.J., Castellanos Abella, E.A. and Sekhar, L.K. (2008) Spatial data for landslide susceptibility, hazards and vulnerability assessment : an overview. In: Engineering geology, 102 (3-4), 112-131
Van Westen, C.J. (ed) (2009). Distance Education course on the use of spatial information in Multi-hazard risk assessment. http://www.itc.nl/Pub/study/Courses/C11-AES-DE-01
Varnes, D.J. 1984. Landslide hazard zonation: a review of principles and practice. Natural Hazard Series. Vol. 3. UNESCO, Paris