

Dominica

Total area:
751 km2
Population:
69,625 (2000), 71,293 (2011)
Coastline:
148 km
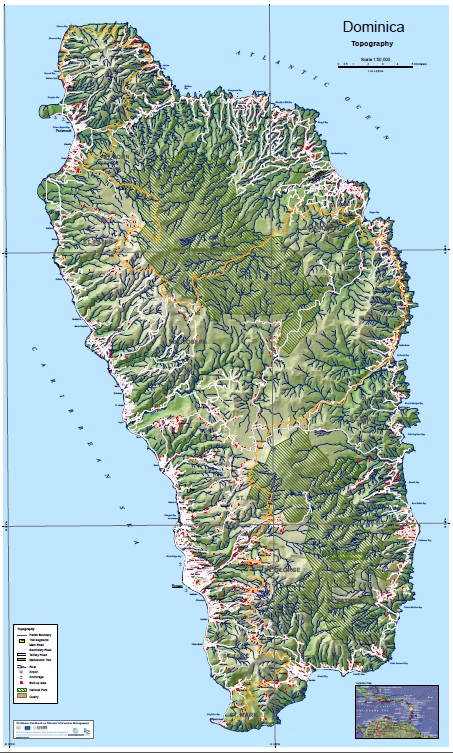
Terrain:
Rugged mountains of volcanic origin, Max. elevation: 1,447 m
Natural hazards:
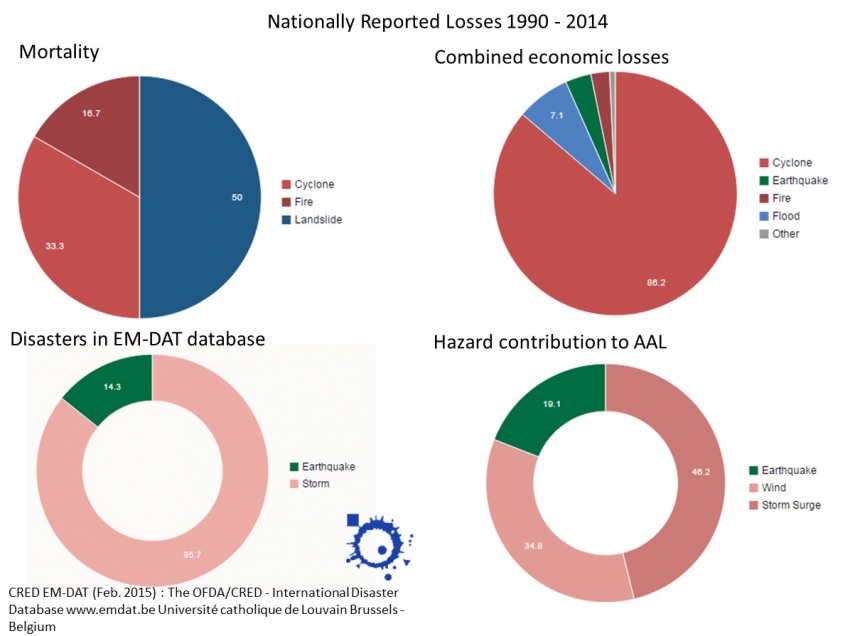
Flash floods are a constant threat; destructive hurricanes can be expected during the late summer months, 10 active volcanoes. Dominica experiences some of the highest annual rainfall amounts in the region which are heavily influenced by orographic effects. Since 1950, Dominica has been exposed to 13 named tropical storm systems passing within 40 km of the island. Since 1979, the island has been impacted by 15 tropical systems including 11 hurricanes. Dominica is considered the most geologically active island in the Caribbean. Dominica has eight volcanoes. Earthquake activity originates from two sources, tectonic activity associated with plate movement and magma displacement associated with volcanic activity. The severe topography of the island favors landslide potential and flooding from the island's many streams; this is a significant recurrent event.
Basic country statistics (2014)
(from http://www.preventionweb.net/countries/dma/data/)
More statistical information is available from: http://data.worldbank.org/country/dominica
|
Population |
People |
72,003 |
|---|---|---|
Urban |
% Total population |
68.969 |
Rural |
% Total population |
31.031 |
Urban population growth |
% Annual |
0.864 |
Population density |
People / km2 |
96 |
GDP (Gross Domestic Product) |
Million US$ |
504.815 |
GDP per capita |
Million US$ |
7,175.63 |
Capital stock |
Million US$ |
2,028 |
GFCF (Gross Fixed Capital Formation) |
Million US$ |
108.709 |
Social Expenditure |
Million US$ |
66 |
Gross Savings |
Million US$ |
-18.333 |
Total reserves |
Million US$ |
87.051 |
Natural disaster impact (2014)
(from http://www.preventionweb.net/countries/dma/data/)
8-year moving average 2005-2013 |
Extensive [%] |
Intensive [%] |
|
|---|---|---|---|
DataCards |
23 |
100 |
0 |
Deaths |
1 |
100 |
0 |
House destroyed |
2.63 |
100 |
0 |
House damaged |
114.63 |
100 |
0 |
Injured people |
1 |
100 |
0 |
Displaced people |
5.63 |
100 |
0 |
Combined economic loss (US$) |
1,711,651.77 |
100 |
0 |
Probabilistic risk results. Average Annual Loss (AAL) by hazard
(from http://www.preventionweb.net/countries/dma/data/)
Hazard |
Absolute |
Capital |
GFCF |
Social |
Total |
Gross |
|---|---|---|---|---|---|---|
[Million US$] |
stock[%] |
[%] |
exp[%] |
Reserves [%] |
Savings [%] |
|
Earthquake |
13.06 |
0.644 |
12.014 |
19.924 |
15.003 |
-71.237 |
Wind |
23.83 |
1.175 |
21.921 |
36.354 |
27.375 |
-129.983 |
Storm Surge |
31.63 |
1.56 |
29.096 |
48.254 |
36.335 |
-172.529 |
Multi-Hazard |
68.52 |
3.379 |
63.031 |
104.532 |
78.713 |
-373.748 |
Spatial data and hazard assessment activities:
Hazard Mapping has been completed in several areas and gIS map datasets have been prepared. Past initiatives have produced several hazard maps including landslide risk, volcanic hazard assessment, multiple hazard map, storm hazard, wind, wave, seismic, structural and human structural. Additionally digital base maps at a scale of 1:25,000 have been prepared and include roads, contours, beaches, rivers, rainfall, electric lines, schools settlements, ports, and quarries.16 Maps are maintained by the physical planning unit of the Ministry of Housing, Lands, Settlement and Water Resources. ODM currently does not have a GIS mapping capability and lacks equipment, software and trained GIS professional staff. As a result, ODM is unable to use the hazard mapping tools developed.
Download the World Bank GFDRR Country Report on Dominica
Global Assessment Report on Disaster Risk Reduction 2015
Click the image to download the report for Dominica.