

Saint Vincent and the Grenadines

Total area:
389 km2 (Saint Vincent 344 km2) with 32 islands and cays
Population:
104,574 (2009)
Coastline:
84 km
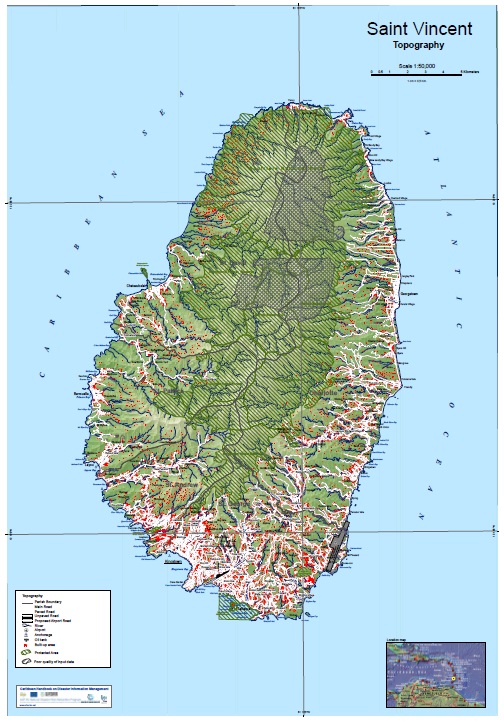
Terrain:
Volcanic, mountainous. Max. elevation: 1,234 m
Natural hazards:
Landslides, particularly on the larger islands, are a significant hazard and the risk is increased during the seasonal rains. Coastal flooding is a major concern particularly relating to storm surge and high wave action. The Grenadines are more susceptibleto drought. The active volcano La Soufriere, located on the north end of St. Vincent is another risk factor, posing threats from shallow earthquake and eruption events. Since 1900, St. Vincent has been hit by 8 named storms, the strongest being Hurricane Allen (Category 4), which passed between St. Lucia and St. Vincent in 1980. Prior to that, Hurricane Hazel, a Category 1 storm passed some 38 km south of St. Vincent in 1954. These Islands were also severely affected by Hurricane Lenny in 1999, a Category 4 storm. The 1939 eruption of the volcano Kick-‘em-Jenny located some 100 km reports S of Grenada, generated a 2-meter high tsunami.
Basic Country Statistics and Indicators (2014)
(From: http://www.preventionweb.net/countries/vct/data/)
More statistical information is available from: http://data.worldbank.org/country/vct
|
Population |
people |
109,373 |
|---|---|---|
|
Urban |
% Total population |
49.848 |
|
Rural |
% Total population |
50.152 |
|
Urban population growth |
% Annual |
0.711 |
|
Population density |
People / km2 |
280.4 |
|
GDP (Gross Domestic Product) |
Million US$ |
725.556 |
|
GDP per capita |
Million US$ |
6,485.679 |
|
Capital stock |
Million US$ |
2,645 |
|
GFCF (Gross Fixed Capital Formation) |
Million US$ |
175.828 |
|
Social Expenditure |
Million US$ |
37 |
|
Gross Savings |
Million US$ |
-46.177 |
|
Total reserves |
Million US$ |
135.097 |
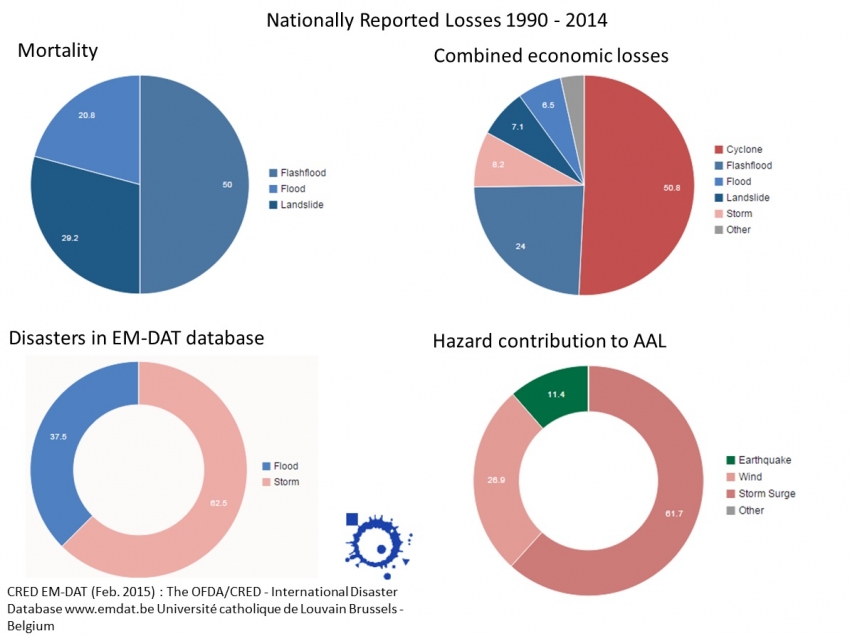
Nationally Reported Losses 1990 - 2014
(From: http://www.preventionweb.net/countries/vct/data/)
|
8-year moving average 2005-2013 |
Extensive [%] |
Intensive [%] |
|
|---|---|---|---|
|
DataCards |
13.88 |
100.00 |
0.00 |
|
Deaths |
2.00 |
100.00 |
0.00 |
|
House destroyed |
7.50 |
100.00 |
0.00 |
|
House damaged |
428.00 |
100.00 |
0.00 |
|
Injured people |
5.75 |
100.00 |
0.00 |
|
Displaced people |
448.25 |
50.00 |
0.00 |
|
Combined economic loss (US$) |
4,255,254.06 |
100.00 |
0.00 |
Probabilistic risk results, Average Annual Loss (AAL) by hazard
(From: http://www.preventionweb.net/countries/vct/data/)
|
Hazard |
Absolute |
Capital |
GFCF |
Social |
Total |
Gross |
|---|---|---|---|---|---|---|
|
Earthquake |
2.79 |
0.105 |
1.587 |
7.490 |
2.065 |
-6.042 |
|
Wind |
6.58 |
0.249 |
3.742 |
17.665 |
4.871 |
-14.250 |
|
Storm Surge |
15.11 |
0.571 |
8.594 |
40.564 |
11.185 |
-32.722 |
|
Tsunami |
0.01 |
0.000 |
0.006 |
0.027 |
0.007 |
-0.022 |
|
Multi-Hazard |
24.49 |
0.926 |
13.928 |
65.746 |
18.128 |
-53.035 |
Spatial data and hazard assessment activities:
Progress in preparation of hazard maps is limited. Mapping and GIS capability is managed largely through the Ministry of Planning with some use in other ministries. NEMO supports limited GIS and mapping capacity. To date risk mapping in St. Vincent is limited. Volcanic risks have been mapped and some coastal vulnerability analysis has been completed. A limited number of base maps have been prepared in a GIS format and include roads, contours, rivers and coastline, and agricultural and urban land use. These are variously available through the Ministry of Planning and NEMO.
Download World Bank GFDRR report on Saint Vincent and the Grenadines
Global Assessment Report on Disaster Risk Reduction 2015
Download the summary for SVG