

This use case shows how to interpret landslides from high resolution satellite images and how to generate a landslide inventory map for Dominica.
Keywords:
Landslide; image interpretation
| Before you start: | Use case Location: | Uses GIS data: | Authors: |
|---|---|---|---|
| Read chapter 4 from the methodology book, and sections 2.4 and 4.3 from the Data Management Book | This use case deals with the island of Dominica | Yes, this use case requires GIS data and Remote Sensing data | Cees van Westen and Diana Patricia Lozano Zafra with support from Jerome DeGrafff. |
Introduction:
Landslide inventories are the basis for assessing landslide susceptibility, hazard and risk (Soeters and Van Westen, 1996; Aleotti and Chowdury, 1999; Ardizzone et al., 2002; Dai and Lee, 2008; Van Westen et al., 2008). They are essential for susceptibility models that predict landslide on the basis of past conditions. If these are not sufficiently available more emphasis should be given on expert assessment and evaluation. Therefore we need to know where landslides happened in the past. The conditions under which landslides happened in the past are analyzed and the relevant combinations are used to predict future ones. We need to understand the causal relations between landslides and the causal factors. These conditions differ for different landslide types, and therefore landslides should be classified into different types. Temporal information is essential to estimate the frequency of landslides. Therefore we need to know when they happened. Landslide inventories are also used to validate landslide susceptibility, hazard and risk maps.
Landslides are generally isolated, rather small but frequent occurring events. In a tropical environment such as Dominica they are visible for some time but quickly become difficult to recognize. Fresh landslide scarps become overgrown by vegetation within a few years after they happen. Signs of landslides become also difficult to interpret from images, when the image is taken more than a few months after the landslide occurrence. On the other hand major triggering events such as tropical storms might cause many landslides at the same time, and then it is important to rapidly map the landslides triggered by that event so that we can link the temporal probability of the triggering rainfall to the spatial probability of landslide occurrence.
The generation of landslide inventories and a landslide database that covers a certain period of time is a tedious procedure. The methods that are considered useful for the generation of landslide inventory maps can be classified into the following main groups (Van Westen et al., 2008):
- Image interpretation from aerial photographs, high resolution satellite images, or hillshading images derived from detailed Digital Elevation Models. Also image interpretation using multi-temporal images from Google Earth has become a useful tool for landslide inventory mapping.
- (Semi) automatic classification of landslides from satellite images or Digital Elevation Models.
- Based on spectral information by detecting fresh landslide areas from multi-spectral satellite images;
- Based on altitude information by detecting landslides from multi-temporal high resolution (LiDAR) DEMs, or through radar interferometry
- Field investigation, by mapping landslide signs, scarp area, accumulation areas, and verification of landslides mapped through image interpretation and/or classification;
- Community reporting, by interviewing local people on locations, dates and impacts of past landslide event;
- Archive studies, by studying newspaper archives, old reports, road maintenance reports etc., as explained in use case 8.1.
Image interpretation can be defined as the study of the imaged objects of the earth surface, the extraction of those features relevant to the object of study, the analysis of the selected features with the objective to come to a deduction of their significance for the specific field of study (Soeters and Van Westen, 1996). Stereoscopic image interpretation is important tools to recognize and map landslides. The interpretation of images is an empirical and subjective process. It is a systematic scanning of a stereo model assisted by logical and scientific evidences. Stereo image interpretation (API) is an art as much of a science, and it requires well trained, experienced investigators.
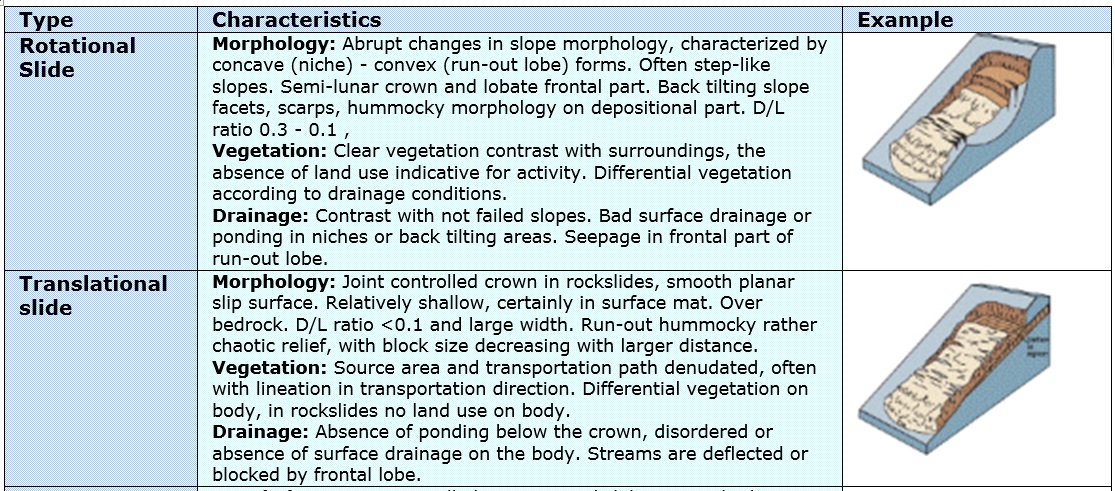
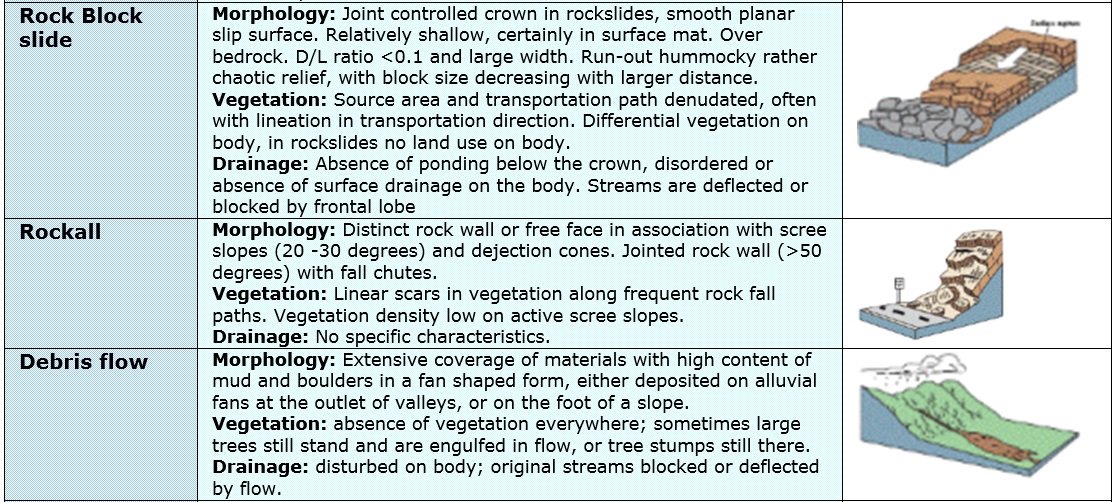
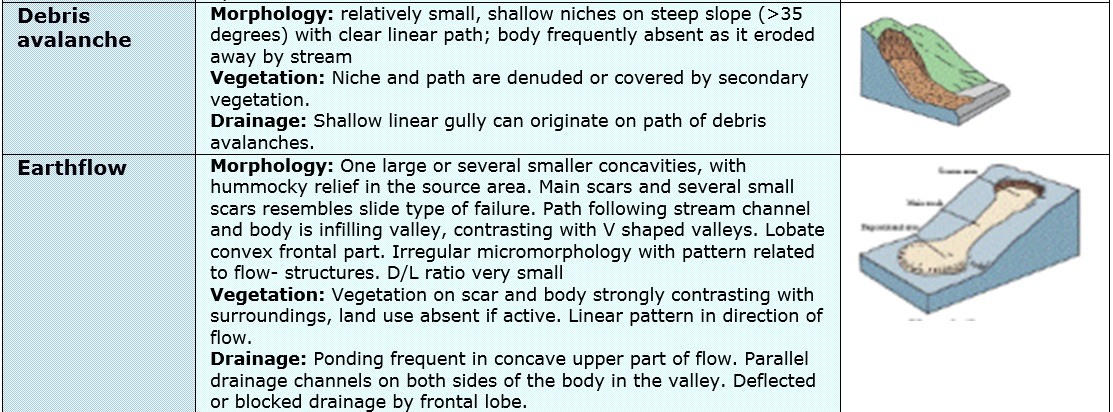
Landslide interpretation using information related to morphology. That is why it is so important to interpret landslides using stereo image interpretation. An interpreter can recognize landslides on the basis of a number of diagnostic features. These are related to morphology, vegetation and drainage characteristics. They are also used to classify landslides, as illustrated in the figure below (Soeters and Van Westen, 1996)
 |
 |
 |
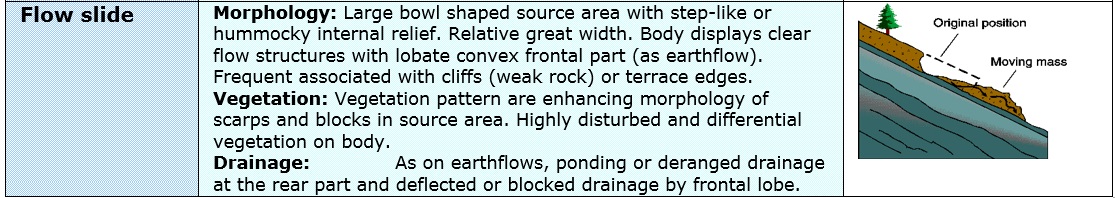 |
Figure: Diagnostic features that can be used in the image interpretation for landslide classification. Click on the image to enlarge
Landslides can be mapped either as points or as polygons.
- Landslide point mapping is much faster, and allows the interpreter to cover larger areas. This is particularly useful when rapid mapping has to be carried out, in a short time after the occurrence of a major event, such as tropical storm, hurricane or earthquake. The point should be located in the scarp area of the landslide, and not in the center of the accumulation area, because otherwise it will be difficult to correlate the landslide with the causal factors. When mapping landslides as point, no information is stored on the size of the landslide, and therefore it will be very difficult to use a point-based landslide inventory in subsequent susceptibility and hazard assessment.
- Landslide polygon mapping is preferred, as it gives a much better representation of the landslide features. Different parts of the landslide (e.g. scarp, transportation zone, accumulation zone) should be mapped separately. The landslide polygons belonging to the same landslide will receive the same unique identifier for the landslide, plus a code for the landslide part. Also information should be interpreted on the type of landslide (following a classification like Varnes, 1984), the sub-type (e.g. rotational, translational, complex), the activity or last activity. The characteristics indicated in the table often cannot all be directly interpreted from image interpretation. Also in the field it is sometimes difficult to determine these afterwards. Therefore, when doing image interpretation often a simplified checklist is used which is illustrated in the figure below. A simplified checklist that can be used in image interpretation is given below. The figure also shows an example of a landslide and the way it is interpreted using polygons with identifiers and an associated attribute table.
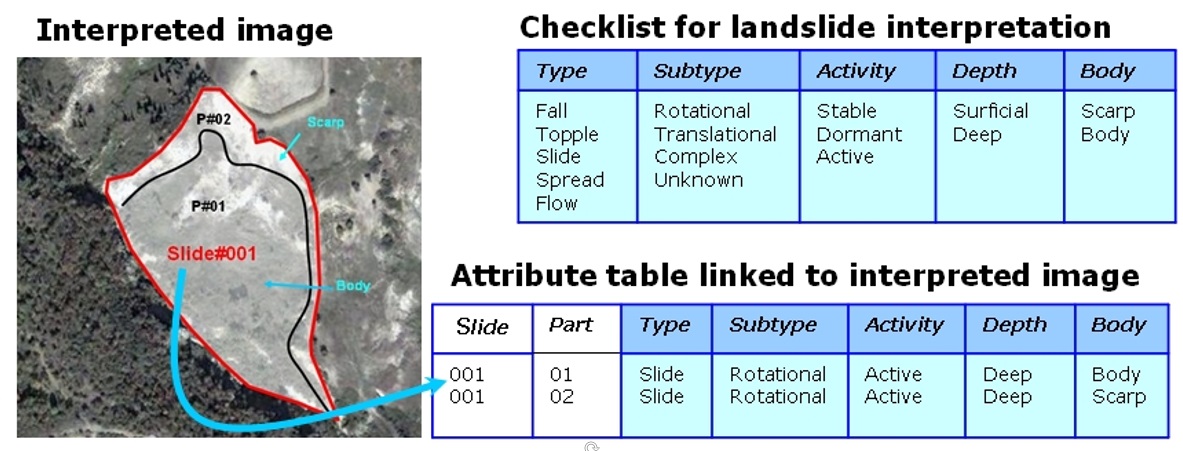
Figure: Example of a landslide interpretation, using polygons to separate scarps and accumulation areas, and a simple checklist that can be used during the image interpretation (Click to enlarge).
Objectives:
The main objective of this use case is to generate a national-scale landslide inventory map in Caribbean islands with suffer severe limitations with respect to the availability and quality of historical landslide inventories and suitable images.
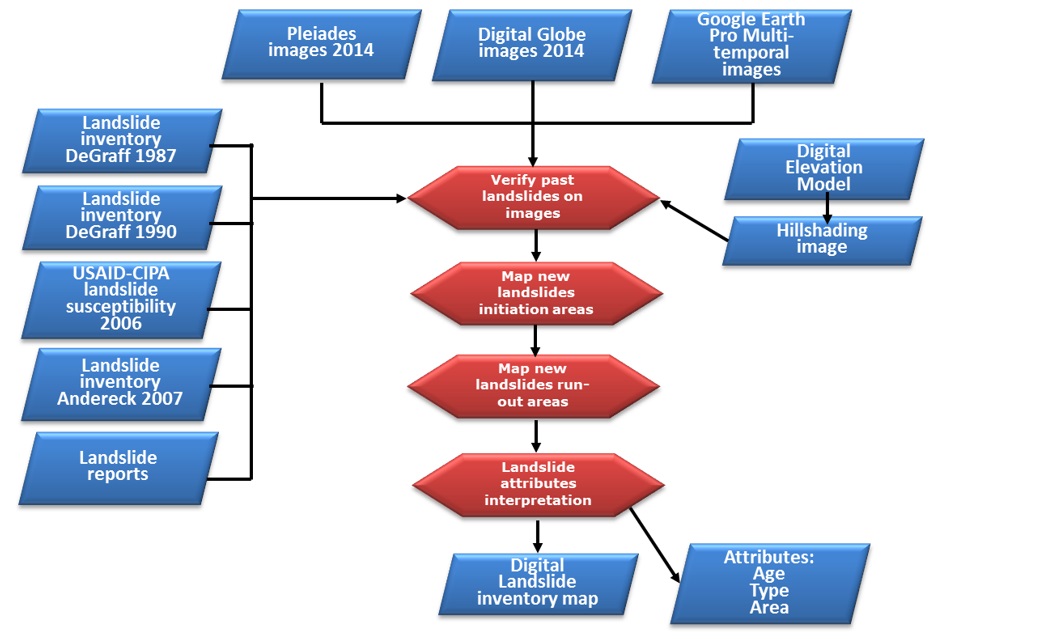
Flowchart:
The method used for generating the landslide inventory in Dominica is illustrated in the flowchart below. We started by collecting all available landslide inventories. But, as these were in most cases not sufficiently, reliable or available, we also decided to collect landslide inventories ourselves. This was done using image interpretation and field work. Image interpretation played a major role in generating updated landslide inventories.
Use case study area description:
The study area for this use case is the island of Dominica, which has a volcanic origin with locally very steep and rugged terrain, large areas with tropical forests and a relatively small population (around 72000). Dominica has a rugged and steep terrain in the middle of the islands, with deep-cut valleys and high vertical coastal cliffs alternated with flat and wide valleys, and undulating coastal plains. Due to this, the population is concentrated mostly along the coast. Practically all rocks in Dominica are of volcanic origin, with the exception of a small unit consisting of limestone on the Leeward side. Dominica is characterized by a series of 8 major volcanoes (SRU, 2000). Due to their volcanic origin, the geologic units are complex, including ignimbrites, lava flows, lahar deposits, and volcanic ashes. All of them are very heterogeneous (vertical and horizontal changes) and have not been mapped in detail for Dominica. Dominica contains 9 potentially active volcanos, and has experienced a number seismic swarms related to the volcanism in different parts of the island. Dominica is characterized by a humid tropical climate. The rainy season is normally from May to November, when the rainfall intensity is concentrated over a short period which triggers most of the landslides, flooding, and erosion in the study area. Daily rainfall data are available from 2 rain gauges for the period 1982 to 2013, which show that the mean annual rainfall ranges from 1,757 mm in the Canefield station on the western side to 2,622 mm in the Melville Hall station on the eastern side. The annual rainfall ranged from 1,263.2 mm in 2000 to 2,451 mm in 2011 for the Canefield rain gauge, with an average value of 1,757 mm . The climate of Dominica is more variable than would seem at first glance. Its location in the trade wind belt would lead to classification as a humid tropical climate. However, the high central peaks modify conditions leading to a highly seasonal climate on the western (leeward) coast and weakly seasonal on the eastern (windward) coast. Dominica is frequently affected by tropical storms and hurricanes, which create severe windstorm, storm surge, flooding and landslide damage. Major events were Edith (1963), David (1979), Klaus (2984), Hugo (1989), Marilyn, Luis Lenny (1995), Dean (2007) and Erika (2015)
Data requirements:
We obtained through the EU FP7 Copernicus project INCREO (http://www.increo-fp7.eu/) the possibility to order very high resolution satellite images (Pleiades images, with 0.5 m spatial resolution for panchromatic and 2 m multi-spectral) for Dominica (See Table 1). We received the images that were obtained in the first months of 2014.
Table 1: Available satellite images for Dominica
|
Satellite |
Date |
Type |
Columns, Rows |
|---|---|---|---|
|
Downloaded from google Earth |
Various covering the island, but all with very high resolution |
Colour image |
35120, 63354 |
|
Digital Globe |
13 FEB 2014 |
Cloud cover 3.6 % pixel size 2 meters |
6983, 30999 |
|
Pleiades |
2014 03 08 |
0.5 meter panchromatic 2 meter multispectral. Covers North west part of the island |
43814, 80743 |
|
Pleiades |
2014 01 17 |
0.5 meter panchromatic 2 meter multispectral. Covers middle part of the island |
7009, 18049 |
|
Pleiades |
2014 03 08 |
0.5 meter panchromatic 2 meter multispectral. Covers Northwest part of the island |
10921, 20183 |
|
Pleiades |
2014 01 17 |
0.5 meter panchromatic 2 meter multispectral. Covers east part of the island |
47246, 101040 |
The high resolution images from 2014 covered different parts of the island, and also had sometimes serious cloud coverage which didn't allow us to map the entire island.
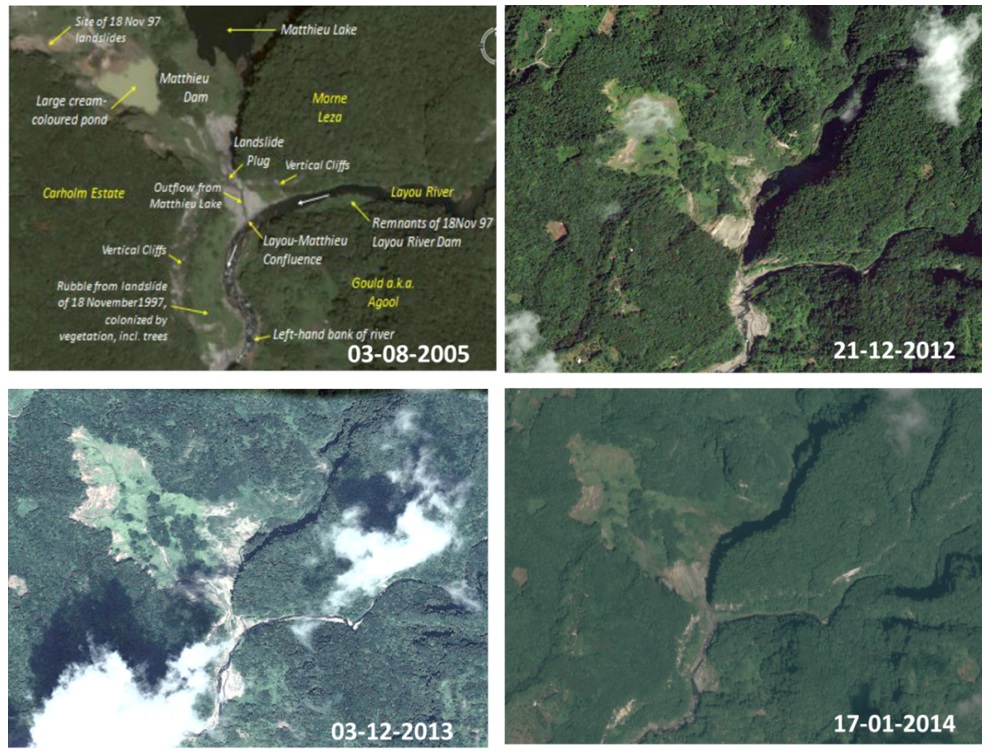
We decided to carry out an extensive interpretation of landslides using different sets of satellite images, and also using historical imagery from Google Earth Pro. Figure 1 gives an example of the use of multi-temporal satellite images for analysing the changes in landslide distribution and activity over time. This figure shows the Matthieu landslide, which was described by DeGraff and Rogers (2003), DeGraff et al (2010) and Arlington (2014). It is possible to see the situation in 2005, 8 years after the damming in 1997, and the situation after the breaking of the landslide dam in 2011.
Figure 1: Example of multi-temporal images for the Matthieu landslide. The upper left image is from Arlington (2014), the upper right and lower left are from Google Earth, and the lower right is a Pleiades image.
Analysis steps:
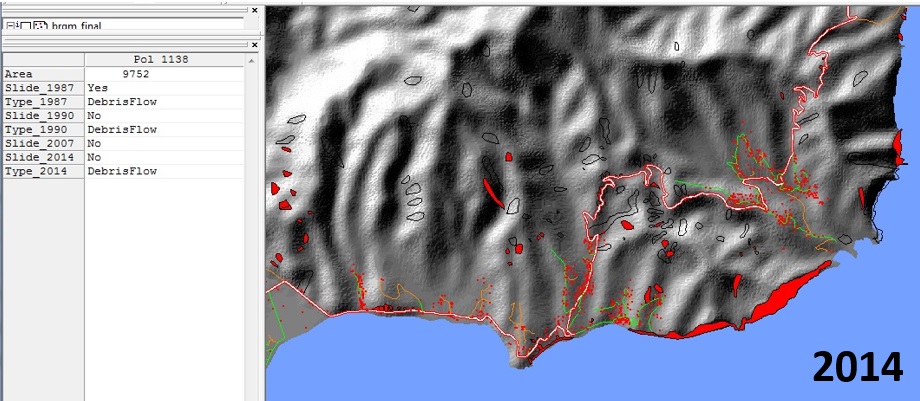
Landslide were mapped for different periods: 1987, 1990, 2007, 2014 and 2015. The historical landslide inventories for Dominica came from the work carried out by J. DeGraff from the US Forest Survey for the OAS in the late 1980's. He carried out detailed image interpretation of landslides using the available black and white aerial photographs, and made a classification of landslide types. It is important to mention that the mapping by DeGraff was not related to a specific triggering event. This landslide inventory was obtained as a shapefiles of points and as a pdf document of the scanned original maps. When analysing the shapefile and comparing it with the pdf, it was noticed that some points were missing and that the points were located in the middle of each landslide. So in order to use these inventories for the landslide susceptibility it had to be complemented and modified placing each point on the scarp area of the landslides. For Dominica, the inventory of 1987 had a total of 900 landslides which were interpreted by DeGraff on black and white aerial photographs from 1984 on scale 1:25.000, and which were classified as Debris Flow (541), Debris Slide (338) and Rockfall or rockslide (20). The landslide inventory made in 1990 comprises of 186 additional unclassified landslides. A landslide inventory map for a small part of the eastern side of Dominica, focusing on the villages of Grand Fond, Petite Soufrie and Mourne Jaune, was carried out in 2007 by Zachary Andereck (Andereck, 2007). He used a Quickbird high resolution satellite image from January 2005 for image interpretation. Field mapping took place in June-July 2006.
However, these are far from complete, and an attempt was made to update these using several sources of information: interpretation of high resolution satellite images, collection of historical information on the dates of occurrence of past landslide events, collection of available data from the national emergency management organisation and from road maintenance records. The resulting landslide inventory map contains many more landslides than were initially available. Landslides were also classified based on their type, and a differentiation was made between initiation and runout areas. The existing historical landslide inventories were integrated into a multi-temporal landslide inventory map , which was made using extensive image interpretation using high resolution satellite images, complemented with historical high resolution images from Google Earth Pro, where the history slicer (allowing to switch to images from different dates) in combination with the relief exaggeration turned out to be very useful for mapping landslide features. All landslide from the historical inventories were checked, and where needed, classified. All other landslides were also classified into landslide types according to Varnes (1984). The polygon-based inventory not only contained landslide initiation areas but also run-out areas, including valleys that had been affected by debris flows and areas that are prone to landslides as quarries, cutslopes and cliffs. Coastal landslides were also mapped.
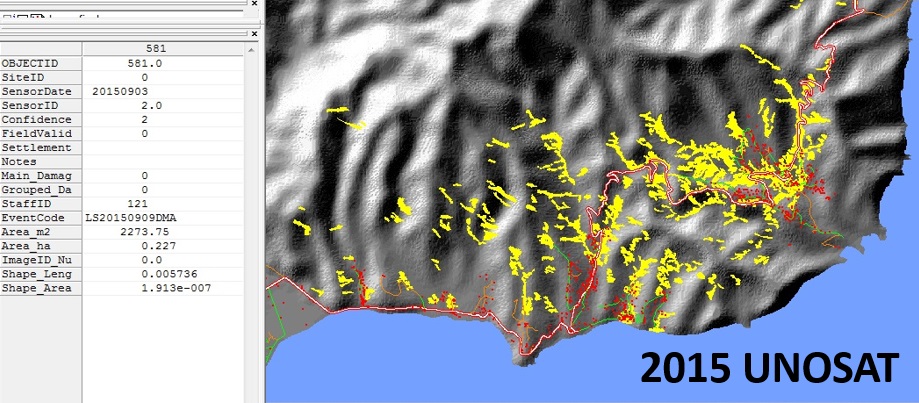
The last event for which an inventory was obtained was tropical storm Erika, which triggered many landslide in Dominica on 27 August 2015. Landslides were mapped by UNOSAT. Their map illustrates satellite-detected landslide areas in the southeastern part of Dominica. UNITAR-UNOSAT analyzed imagery collected by the WorldView-2 satellite on 03 September 2015 and detected the presence of landslides over multiple areas in this portion of the island. A total of about 700 landslides were detected in the analyzed areas. The zone covered by this map is one of the most affected as populated areas and agricultural lands suffered damage. Some parts of the island could not be analyzed due to the heavy cloud cover. Later a field investigation was carried out by BRGM
Results:
We incorporated in our inventory also the landslides from the previous inventories and checked these in the images. Many of these were no longer visible on the images from later years, although when using older images from around 2005, many of them could still be detected, even though many were revegetated. During the process we also were in contact with Jerome DeGraff, who carried out the landslide inventories in 1987 and 1990, and we compared his results with ours. He also provided us with examples of landslides interpreted from images, such as the one shown below.
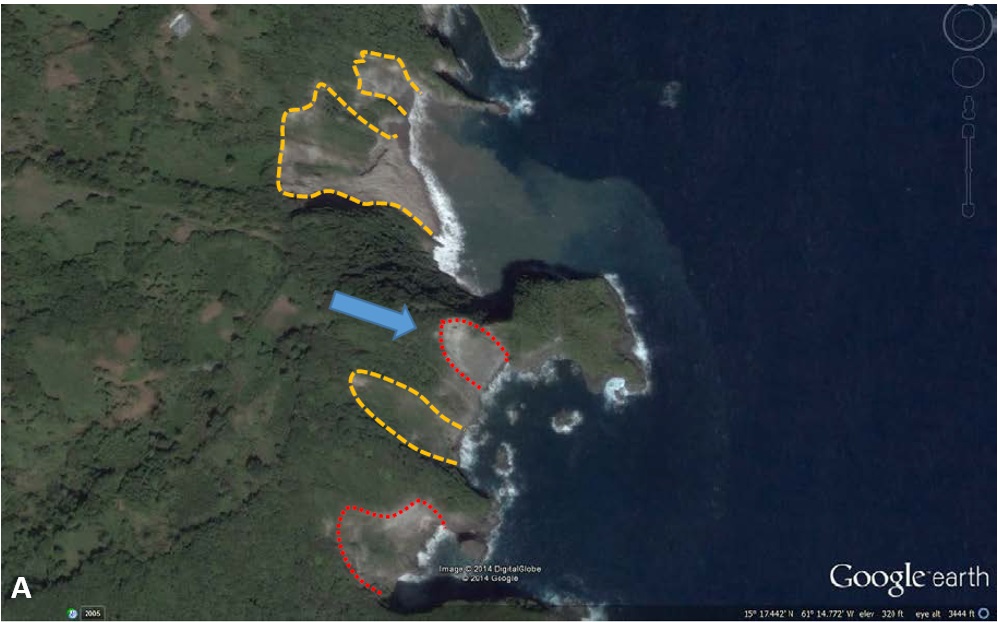
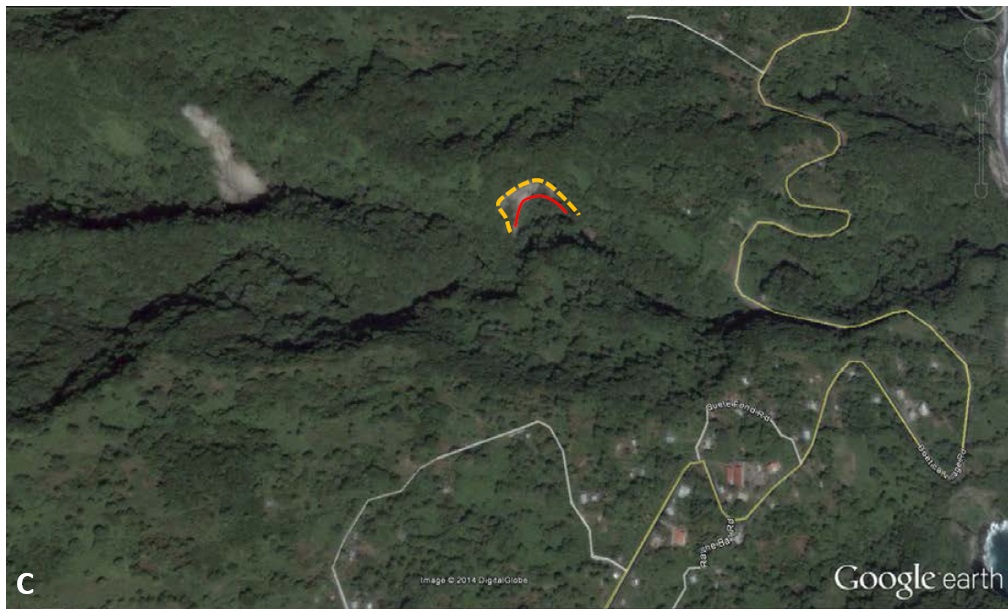
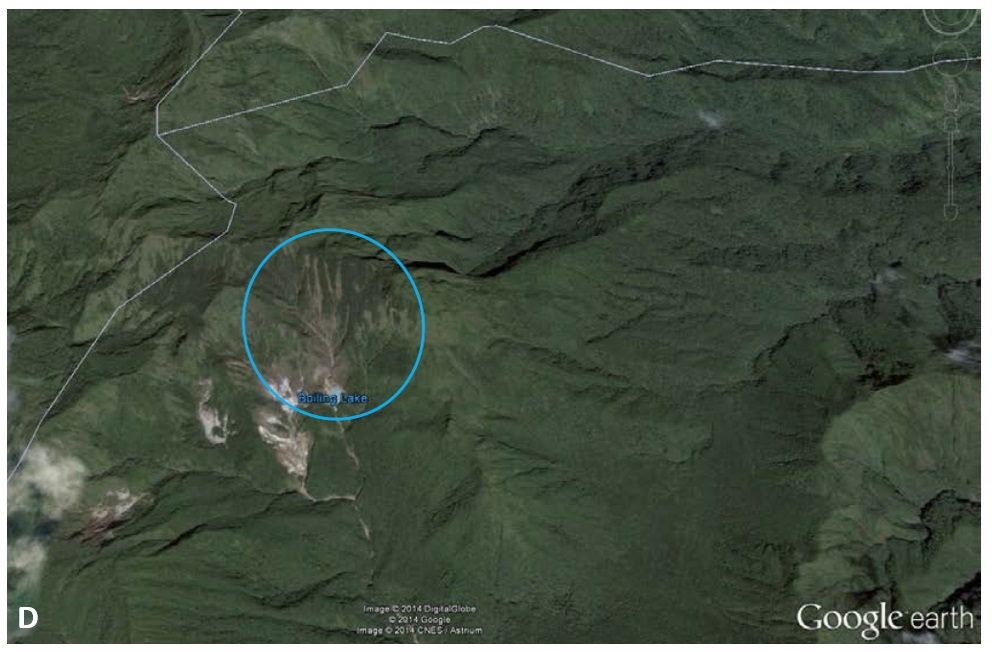
Below you can see four examples of landslides interpreted from Google Earth images, based on a commentary from DeGraff:
Example A is from a coastal area in the SE part of Dominica. The photo shows the interpretation with gold dashed lines outlining debris slides and red outlining rock slides. The blue arrow on the lower photo points to a rock slide where you can see the rock exposed in the upper head scarp area.
Example B shows landslides that can be found where pioneer vegetation species are covering the landslide scar and deposit. The new vegetation typically appears a brighter (lighter) green compared to surrounding vegetation. This debris flow was probably initiated during Hurricane Hugo (1989). The debris flow passes under the road (and penstock) between Laudat and what was then called " Freshwater Lake" and now is noted as " Letang" . A closer view of this debris flow shows that cleared fields also have a similar contract in vegetation color to the landslide scars (squared areas below the road in the lower left quadrant of photo). The dashed gold line outlines where the debris flow initiated. There is an overlapping pattern that could be interpreted as retrogression of the initiation area upslope and/or some lateral enlargement of the initiation area. The dashed red line encloses the deposit made from the debris transported sown the debris flow path to the river valley. Where sufficient area exists on relatively low gradient, fan shaped deposits will be found. According to DeGraff in the Eastern Caribbean these depositional areas are relatively rare. So most debris flow evidence will be limited to the scar where it initiated and the path where the flow passed to the nearest drainage area.

Example C shows clearly recognizable fresh landslides, which will appear as a brown to reddish-brown against the background of the vegetation (especially within forested vegetation). The Event in the upper left is a debris flow starting with the arcuate scar where movement was initiated extending downslope to the natural channel. There are faint lines showing fluvial erosion of the bare soil exposed by the debris flows passage. There may be a small amount of deposit at the very bottom next to the channel. But most of the mobilized material was likely transported downstream. The indicated landslide is a debris slide. The gold-colored dashed line shows the top of the headscarp. The solid red line is the upslope edge of the slide mass extending to the channel. The arcuate bare area (compare to the first image) is diagnostic for a debris slide. It would also occur in a rock slide. This example is interpreted as a debris slide due to the lack of resistant escarpments suggesting resistant rock with only a thin soil. The presence of the debris flow shows that a significant thickness of weathered soil overlies the bedrock in this area.
Example D is an image of the Boiling Lake area. There is a faint set of parallel lines on the slope above (and north) of the lake. Closer inspection (within blue circle) shows a number of debris flow scars (partly re-vegetated). It is worth noting because several coalesce into a single runout path toward the lower slope. This is not an uncommon occurrence with debris flows on steep slopes.
We interpreted the landslides as polygons, separating between scarp and body, assigning a unique identifier to each landslide and describe each landslide with a number of attributes. We made a complete classification for all landslides. Also the mapping of coastal landslides was carried out.
The landslide inventories were checked in the field during a fieldwork period of 3 weeks in September-October 2014. During the fieldwork several of the features that were identified through image interpretation as potential landslides, were actual bare field or other features. As the stereo-image interpretation focused not only on the absence of vegetation in potential landslide areas, but more on the morphological characteristics of old landslides, many more landslides were interpreted than the ones caused by the 2013 Christmas eve event. However, for these older ones, it was difficult to establish the age. During the fieldwork also specific emphasis was given to the collection of landslide inventories along the road network. For this purpose landslide data was collected through the following means:
- Image interpretation of landslides along roads, and subdivision of roads into segments with different characteristics in terms of cut slopes, upslope and downslope terrain, and geology.
- In the countries fieldtrips were carried out together with the road engineers in order to know the locations where landslides have occurred in the past;
- Road maintenance records were collected from which information related to the number, data and volume of landslides was extracted for a number of triggering events.
- The road segments identified through image interpretation were checked in the field, and additional information on road characteristics was obtained. Some of the countries had road databases, with information on each road section. However, they were not geo-located and this proved to be a difficult work.
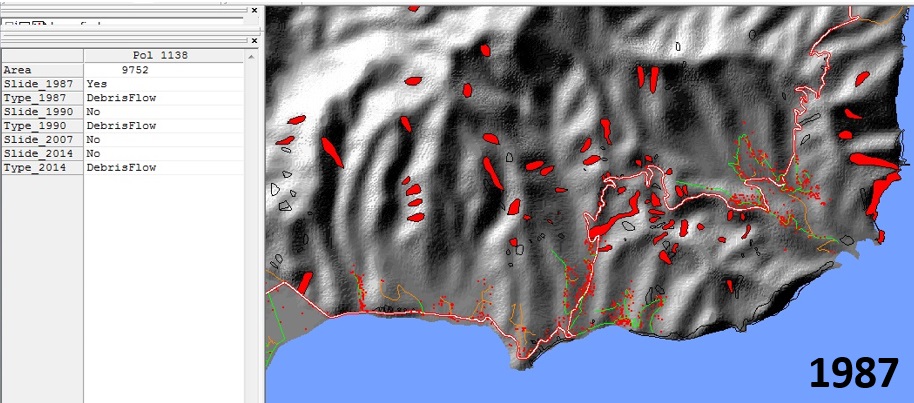
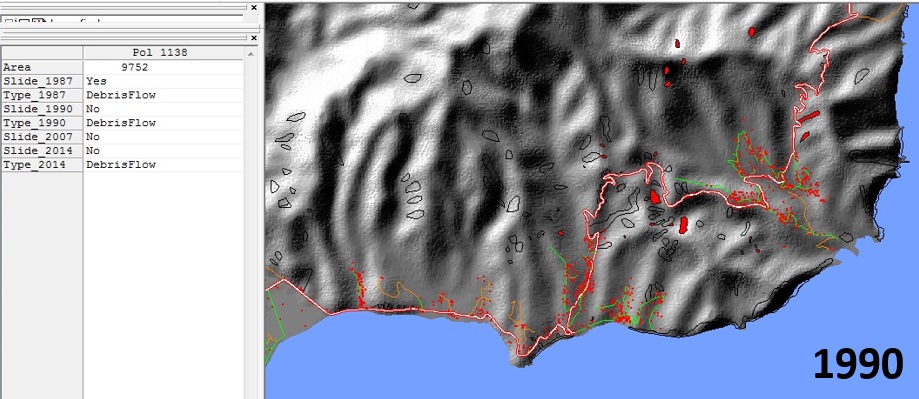
Landslide were mapped for different periods: 1987, 1990, 2007, 2014 and 2015. The following figures show the Google Earth image of the Southeastern part of Dominica and the landslide inventories for the different periods.

The baseline study for landslides in Dominica is the work carried out by Jerome DeGraff from the US Forest Service for the OAS in 1987. He carried out detailed image interpretation of landslides using detailed stereoscopic image interpretation of 1:20,000 scale black and white aerial photographs, which were taken in 1984, so five years after the occurrence of Hurricane David, which was very destructive in Dominica. The aerial photos covered the entire island with the exception of a mile wide strip from north to south in the east-central part of the island. Unfortunately, the rain gauge data for this event is missing. We only received rainfall data from the Canefield station since 1982 and the data around August 28 1979 for the Melville Hall station is missing. DeGraff differentiated mapped landslides with a minimum size of 2000 m2 and also differentiated between main landslide types (fall, slide, flow). He also carried out extensive field checking in 1986. DeGraff clearly mentions in the report (DeGraff, 1987) that in this environment it is difficult to identify landslides that are older than a few years, and that the landslides caused by Hurricane David (5 years before the photos were taken and 7 years before field checking in January 1987) were difficult to recognize due to revegetation with undergrowth and young trees. He indicated that rockslides and rockfall are very frequent along the cliff coasts, and that most of these slope are considered landslide prone. Also inland cliffs in ignimbrite present frequent rockfall problems.
DeGraff revisited the area several years later in 1990 to check the quality of the earlier landslide zonation, and he mapped the landslide that occurred in the years 1987-1990 (DeGraff, 1990). In this period two hurricanes produced significant rainfall amount (1987 Emily, 1988 Gilbert, and 1989 Hugo) and also a number of tropical storms and other rainfall events occurred. He mapped 183 new landslides, of which 31 along the roads. The failures there occurred after hurricane Hugo. Only 5 of the new landslides were rockslides and the rest debris slides and debris flows, with shallow depth. He concluded that 77 of the 151 new landslides that occurred in soil were more frequently occurring in managed vegetation areas (cultivated crops) than in secondary rainforest and natural vegetation.
In 2006, under a USAID programme, a multi-hazard assessment was carried out for Dominica (USAID 2006). This included a landslide susceptibility assessment, which also incorporated a limited data collection for new landslides. The report indicates that a detailed landslide inventory was beyond the scope of the work. An aerial photo analysis was carried out using 1:10,000 scale black and white aerial photos from 02/02/1992. The study reports that 685 points were collected using GPS. It is not clear whether these are all new landslides, and how many of these were already reported by DeGraff (1987, 1990). Unfortunately the landslide inventory map from this study is not available.
A landslide inventory map for a small part of the eastern side of Dominica, focusing on the villages of Grand Fond, Petite Soufrie and Mourne Jaune, was carried out in 2007 by Mr. Zachary Dean Andereck, who did a Master thesis for the University of Miami (USA) (Andereck, 2007). He used a Quickbird high resolution satellite image from January 2005 for image interpretation. Field mapping took place in June-July 2006. He reported that the local people indicated that most of the landslides occurred on 21/11/2004, as a result of several days of intense precipitation followed closely by a magnitude 6.3 earthquake. He identified landslides at 1:1500 (?) scale. He reported 246 landslides in this relatively small area (225 km2).
Road maintenance and clearance reports were obtained from the Ministry of Public Works and Ports for five rainfall events: September 3/2009 (tropical storm Erica), October 31/2010 (Hurricane Tomas), September 28/2011 (tropical storm Ophelia), November 28/2011, and April 17-25/2013. An example of the latter is given in Table 4-3. Unfortunately no information was available for earlier events, as this type of data is not kept in a database. The reports don't have any spatial references for the landslide locations, they only have the road sections starting and end point where landslide clearance had been done and the amount of money spent for clearance. To locate those areas and prepare them as geo-spatial dataset, the available high resolution images and thematic maps of the island were used.
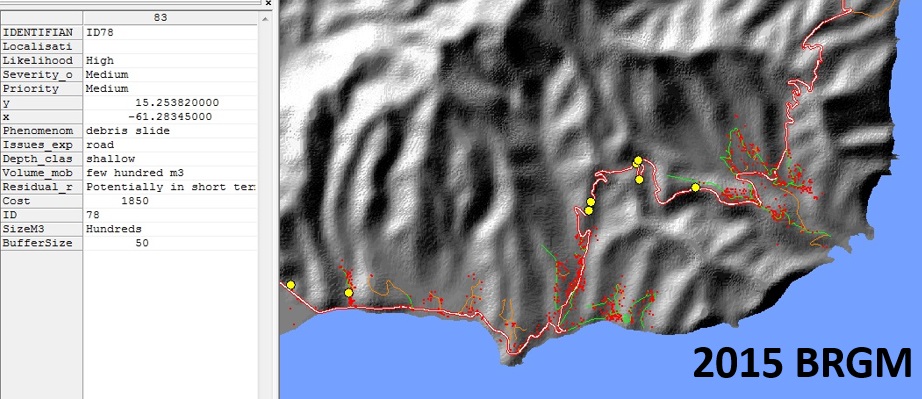
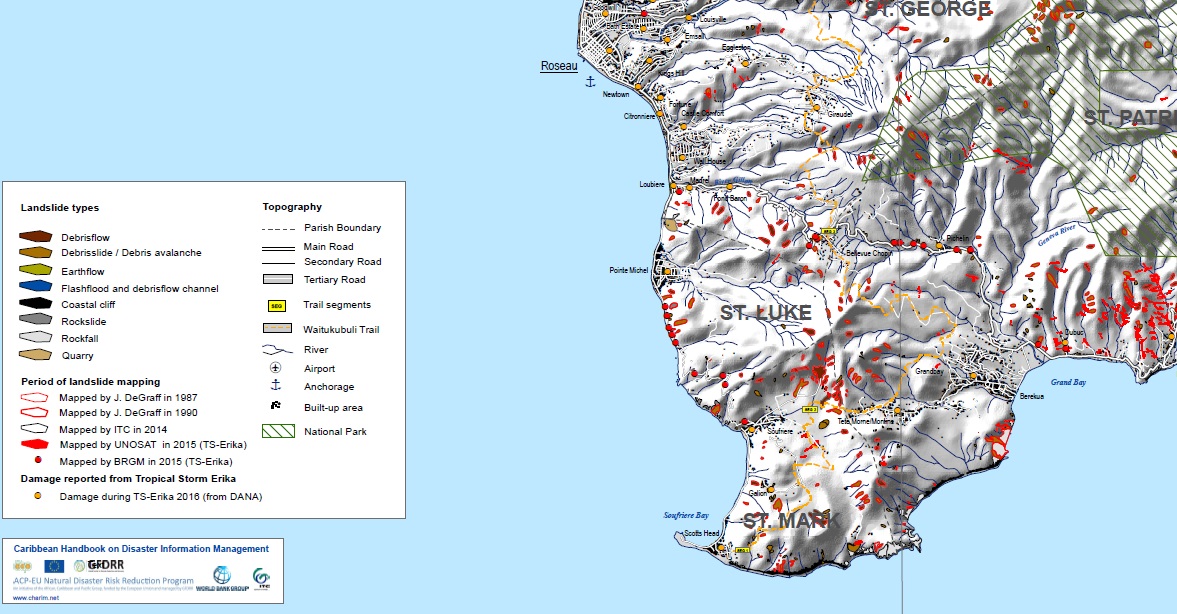
The results of the extensive image interpretation that we carried out in 2014 are shown on the right hand side, as well as those for the 2015 Erika Event by UNITAR-UNOSAT. It is interesting to see the large difference in the number of landslides mapped by UNOSAT (Using automatic classification from satellite images) and BRGM (using helicopter overflights and field visits). Unfortunately the UNOSAT dataset doesn't contain a differentiating between erosional and accumulation areas, and the landslides are not classified. The BRGM team mapped the landslides as points, and they did a full classification. However, they only focused on the most problematic landslides in the country.
The resulting landslide inventory map is shown in the figure below. Table 2 and table 3 give a summary of this landslide inventory that includes the previously mapped landslides. It was not possible to indicate the dates of landslides in the inventory, due to a lack of data. Therefore the date information was collected in the form of tables.
|
|
1987 (DeGraff) |
1990 (DeGraff) |
2007 (Andereck) |
2014 (CHARIM) |
2015 (UNOSAT) |
2015 (BRGM) |
|---|---|---|---|---|---|---|
|
number |
980 |
183 |
161 |
896 |
1554 |
99 |
|
Area (hec) |
584 |
9 |
3 |
52 |
183 |
- |
|
Study area (km2) |
752 |
752 |
38.8 |
752 |
752 |
752 |
|
Density |
0.00777 |
0.00012 |
0.00077 |
0.00069 |
0.00243 |
|
|
percent |
0.777 |
0.012 |
0.077 |
0.069 |
0.243 |
|
|
nr/km2 |
1.30 |
0.24 |
4.15 |
1.19 |
2.07 |
0.13 |
Table 2: Summary of landslide inventories, with number, area, area density and number density.
|
Type
|
1987 DeGraff |
1990 DeGraff |
2007 Andereck * |
2014 VanWesten |
2015 UNOSAT
|
2015 BRGM |
Total |
|---|---|---|---|---|---|---|---|
|
Debris flow |
483 |
28 |
21 |
120 |
- |
4 |
656 |
|
Debris slide |
318 |
142 |
125 |
464 |
- |
50 |
1099 |
|
Debris Avalanche |
0 |
5 |
2 |
65 |
- |
20 |
92 |
|
Rockfall / Rockslide |
8 |
5 |
11 |
183 |
- |
11 |
218 |
|
Coastal Cliffs |
0 |
0 |
0 |
47 |
- |
- |
47 |
|
Unknown |
81 |
3 |
2 |
17 |
1554 |
4 |
1661 |
|
|
890 |
183 |
161 |
896 |
1554 |
89 |
3773 |
Table 3: Summary of landslide information for the available landslide inventories for Dominica. The numbers indicate new landslides mapped in the various years. * Andereck (2007) only mapped landslides in a small part on the eastern slope of the island.
Figure: Resulting landslide inventory map for Dominica
Conclusions:
This use case tried to generate the best possible landslide inventory as input for susceptibility and hazard assessment at a national scale. There were many limitations of data availability and time. Nevertheless, in order to be able to make a reliable landslide hazard map that also represents future changes the following recommendations are given:
Establishment of a national landslide database.
Currently there is no single organizations responsible for generating and maintaining landslide data in Dominica. The Ministry of Public Works generates road clearance reports that could be easily converted into a landslide database. However, the current situation is that these data get lost after some years. The Office of Disaster Management receives information about emergencies, which also include landslide events. However, when we asked them for a database they were not able to provide one. Also the spatial planning division requires landslide data for generating land use plans, and for building permit issuing. The current practice is that landslide data is collected by external parties within international projects. There is a need to develop a national landslide database, which requires that one organization is made responsible for generating and maintaining such a database, and where several other organizations should contribute. This will require additional funding from a donor agency to set it up. The landslide inventory should be stored in a web-mapping application, with a Google Earth or other background, where various national and international organizations can consult the existing landslide information, and where new landslide events can be added by government organizations, local people, news media, NGO's etc. A close collaboration with the online newsmedia in Dominica (http://dominicanewsonline.com/) is highly recommended, as they have reported many landslide events, with additional photo or video footage, which could be easily linked to a geolocation, and stored in such a database so that the information is not lost. It is very important to get better data on the location, type, damage and especially the date of landslide events, so that in future a correlation between rainfall characteristics and landslide incidences, and the establishment of rainfall thresholds, and frequency/magnitude relationships can be properly carried out. These reported events would be stored in a separate database, which is used by the national responsible organization for landslide inventory mapping, as the basis for checking. These are added to the actual database only after they have been checking by an expert. This will also allow the continuation of the landslide database in future. It is essential that there is a close collaboration between the various national organizations that have to deal with landslides. However, one organization should be the nodal agency responsible for setting-up the national landslide database.
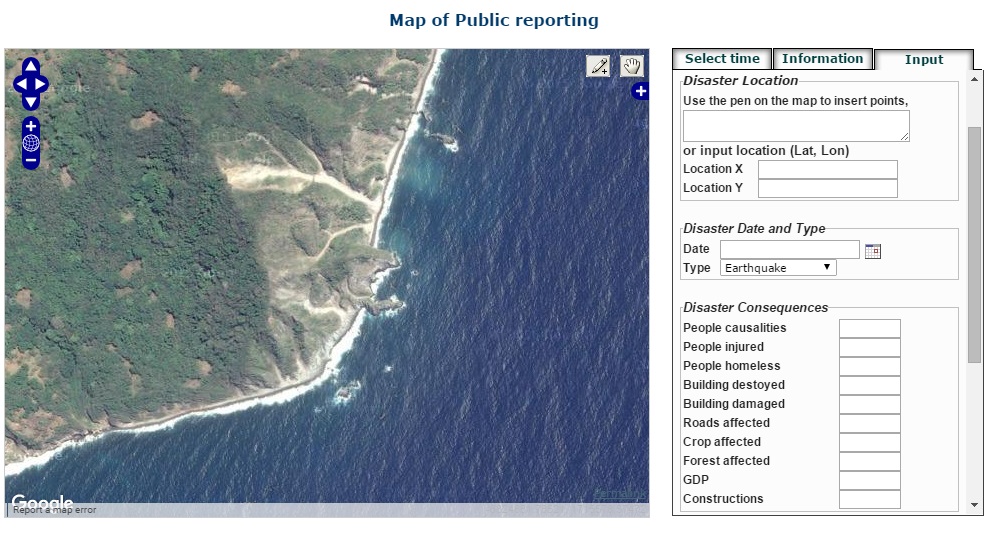
Figure: Example of a landslide reporting application and landslide database developed in another region (http://drm.cenn.org/index.php/en/disaster-reporting/public-reporting)
Improvement of the HydroMet system for Dominica
We were only able to obtain daily rainfall data for two stations (Mellville hall, and Canefield) and some project-related rainfall data from the DOMEX project. In order to be able to make better predictions for landslides as well as floods, and droughts it is essential that the HydroMet system is improved. Continous recording stations should be installed in more locations, and the data should be made available through the web. Given the small size of Dominica it may be desirable that the CIMH would take the lead in this.
Further training and discussion
The current version of the landslide inventory map should be discussed extensively with the experts in the various government departments, but especially with the Spatial Planning Division and the Ministry of Public Works. The use of this map in land use planning, building permit issuing and land subdivision process should be further discussed. Also recommendations with respect to landslide hazard assessment at the local and detailed level should be discussed with the local organizations. Further training on the use of the maps and the method for generating them would also be important, especially when one government organization would be give the responsibility for generating and maintaining a national landslide database, this organization should also be trained in using that data for updating the national and local scale landslide hazard maps. Further training is also required in the use of spatial data and the sharing of spatial data throguh the GeoNode.
We recommend that the landside inventories, susceptibility and hazard maps are updated once more detailed input data become available (e.g. the LiDAR data) or after a major triggering event.
References:
Aleotti, P. and Chowdury, R. 1999. Landslide hazard assessment: summary review and new perspectives. Bull. Eng. Geol. Env. (1999): 21-44, pp 21- 44
Andereck, Z. D. (2007). Mapping Vulnerability of Infrastructure to Destruction by Slope Failures on the Island of Dominica , WI : A CASE STUDY OF GRAND FOND , PETITE SOUFRIERE , AND MOURNE JAUNE. Faculty of Miami University.
Anderson, M., & Holcombe, E. (2013). Community-Based Landslide Risk Reduction: Managing Disasters in Small Steps. The World Bank, Washington DC, 447p.
Ardizzone, F., Cardinali, M., Carrara, A., Guzzetti, F. and Reichenbach, P.: Impact of mapping errors on the reliability of landslide hazard maps, NHESS, 2(1/2), 3–14, 2002
Chacon J, Irigaray C, Fernandez T, El Hamdouni R (2006) Engineering geology maps: landslides and geographical information systems. Bull Eng Geol Environ 65:341–411.
Corominas, J., & Mavrouli, O. C. (2011). Guidelines for landslide susceptibility, hazard, and risk assessment and zoning. Retrieved from http://safeland-fp7.eu/results/Documents/D2.4.pdf
Corominas, J., van Westen, C. ., Frattini, P., Cascini, L., Malet, J.-P., Fotopoulou, S., … Smith, J. T. (2014). Recommendations for the quantitative analysis of landslide risk. Bulletin of Engineering Geology and the Environment, 73(2), 209–263. doi:10.1007/s10064-013-0538-8
Dai, F.C., Lee, C.F. and Ngai, Y.Y. (2008). Landslide risk assessment and management: an overview . Engineering Geology, 64 (1), 65-87
Cruden, D. M., & Varnes, D. J. (1996). Landslide Types and Processes. In A. K. Turner & R. L. Schuster (Eds.), Landslides Investigation and mitigation. Transportation Research Board. Spetial report 247. (pp. 36–75). Washington, D. C.: Transportation Research Board.
DeGraff, J.V. 1990a. Post-1987 Landslides on Dominica, West Indies: An Assessment of LandslideHazard Map Reliability and Initial Evaluation of Vegetation Effect on Slope Stability, Submitted to The Commonwealth of Dominica and the OAS
DeGraff, J.V. 1990b, Potential Landslide-Dam Hazard Below Freshwater Lake, Commonwealth of Dominica, West Indies, Report submitted to Commonwealth of Dominica and the OAS
DeGraff, J. V., 1991: Determining the significance of landslide activity: Examples from the Eastern Caribbean. Caribb. Geogr., 3, 31–42.
DeGraff, J. V., 1995, Natural Hazards Vulnerability of the Dominica Hydroelectric Expansion Project: Caribbean Disaster Mitigation Project Final Report, Organization of American States, Washington, DC, 26 p.
DeGraff, J. V., 1997, Technical Assessment of the Landslide-Dam Emergency, Commonwealth of Dominica, W.I.: U.S. Agency for International Development Report, Office of the U.S. Foreign Disaster Assistance, Washington, DC, 24 p.
DeGraff, J.V., James, A. and Breheney, P., 2010. The Formation and Persistence of the Matthieu Landslide-Dam Lake, Dominica, W.I.. Environmental & Engineering Geoscience, Vol. XVI, No. 2, May 2010, pp. 73–89
DeGraff, J.V., Romesburg, H.C., Ahmad, R, and McCalpin, J. 2012. Producing landslide-susceptibility maps for regional planning in data-scarce regions. Nat Hazards (2012) 64:729–749
DeGraff, J. V. and Rogers, C. T., 2003, An unusual landslide dam event in Dominica, West Indies: Landslide News, No. 14/15, pp. 8–11.
DeGraff, J.V., Bryce, R., Jibson, R.W., Mora, S., and Rogers, C.T. 1989. Landslides: Their extent and significance in the Caribbean. In E.E. Brabb and B.L. Harrod (eds), Landslides: Extent and Economic Significance. p. 51-80. Rotterdam: A.A. Balkema
DeGraff, J. (1990). Post 1987 landslides in Dominica, West Indies: An assessment of landslide-hazard map reliability and initial evaluation of vegetation efect on slope stability. Fresno, California.
Fell, R., Corominas, J., Bonnard, C., Cascini, L., Leroi, E., & Savage, W. Z. (2008). Guidelines for landslide susceptibility, hazard and risk zoning for land use planning. Engineering Geology, 102(3-4), 85–98. doi:10.1016/j.enggeo.2008.03.022
Garnier C. and Legendre Y. – coll. Devenoges Q. (2015) – Technical assistance mission to the Government of Dominica - Expertise on land movements following the passage of tropical storm Erika, 26 - 28/08/2015. Final report. BRGM/RC-65203-FR, 67 p., 52 ill., 4 app.
James, A., & De Graff, J. V. (2012). The draining of Matthieu landslide-dam lake, Dominica, West Indies. Landslides, 9(4), 529–537. doi:10.1007/s10346-012-0333-9
Jordan, C. J. & Grebby, S. (2014) Risk Information Services for Disaster Risk management (DRM) in the Caribbean: Service Readiness Document. British Geological Survey Open Report ) OR/14/064 and ESA Technical Report.
Malamud, B. D., Turcotte, D. L., Guzzetti, F., & Reichenbach, P. (2004). Landslide inventories and their statistical properties. Earth Surface Processes and Landforms, 29(6), 687-711.
Soeters, R., & Westen, C. J. van. (1996). Slope instability recognition, analysis and zonation. In A. K. Turner & R. L. Schuster (Eds.), Landslides Investigation and Mitigation. Transportation Research Board Special Report 247. (pp. 129–177). Washington, D. C.: Transportation Research Board.
UNITAR-UNOSAT (2015) Landslide Affected Areas in Southeastern Dominica. http://unosat-maps.web.cern.ch/unosat-maps/DM/LS20150909DMA/UNOSAT_A3_LS...
Van Westen, C.J., Castellanos Abella, E.A. and Sekhar, L.K. (2008) Spatial data for landslide susceptibility, hazards and vulnerability assessment : an overview. In: Engineering geology, 102 (2008)3-4, pp. 112-131