

Use case intended for: Planner
Keywords:
spatial planning, national land use planning, multi-hazard risk assessment, planning process
| Before you start: | Use case Location: | Uses GIS data: | Authors: |
|---|---|---|---|
|
Read relevant parts of Chapter 7 of the Methodology Book. Readers are also recommended to consult relevant methodology chapters and use cases for different types of hazards that they are concerned with. |
Grenada | No |
Richard Sliuzas |
Introduction:
This chapter briefly describes a process that could be used to guide the making of a National Land Use Plan (NLUP) that would explicitly include disaster risk reduction elements. It draws on Grenada's recent experience in making a National Physical Development Plan, as Grenada has perhaps made more progress in this area than many other Caribbean countries. Given that each country has its own legislation and administrative structure some names and terms may not be directly transferable form one situation to another, but the general approach could be adapted to each specific circumstance.
A NLUP provides an integrated and coherent framework to promote and guide sustainable land use development in a country. A NLUP does this by:
- Formulating national land use and project proposals that are complementary to current socio-economic policies and proposals for national development.
- Providing a strategic planning framework to facilitate:
- Rational allocation of land for competing uses and interests.
- Providing consistent guidance to regulate and control development.
- More detailed planning at the sub-national and local levels.
-
Adopting and implementing appropriate development policies and projects that:
- Maintain the ecological integrity of the biophysical environment.
- Maintain the integrity of the cultural landscape including traditional economic activities (agriculture, forestry), significant historical and archeological sites, and the form and character of urban and village development.
- Safeguard suitable lands with tolerable levels of risk for affordable housing, viable agriculture, and environmentally sensitive tourism and industrial development.
- Manage the demands on the infrastructure systems (water supply, waste disposal, transportation facilities, etc.) and ensure efficient use of existing and proposed systems.
- Safeguard population, housing, economic activity, and infrastructure facilities from natural and technological hazards.
- Promoting efficient, timely development through coordinated public and private investment programs.
- Stimulating community participation in the planning and development process.
Objectives:
- Describe the main processes in national land use planning
- Indicate where and how hazard information can be utilized in national land use planning
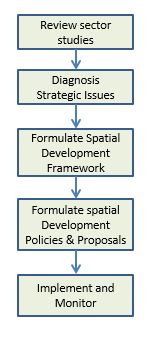
Flowchart:
Use case study area description:
A NLUP is typically a long term plan with a horizon of 10-20 years that is used to provide guidance for more detailed local land use plans. In rapidly changing environments, the temporal validity of such plans will tend to be shorter and more frequent updates may be required, and such updates should be made at intervals of 5-10 years - in Grenada the National Physical Development Plan (NPDP) covers the period of 2003-2021 and it should be reviewed every 5 years. Other Caribbean nations have similar provisions for NLUP preparation that are as yet not fully operational.
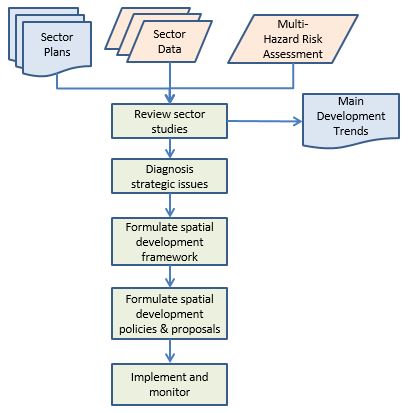
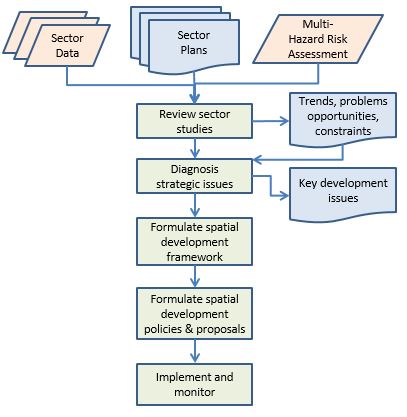
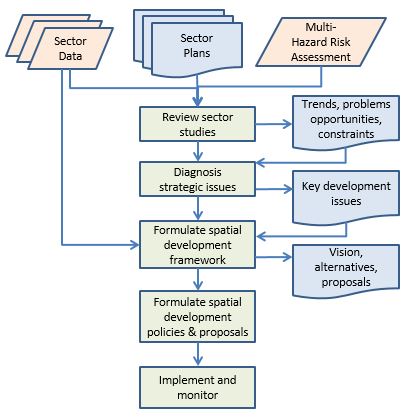
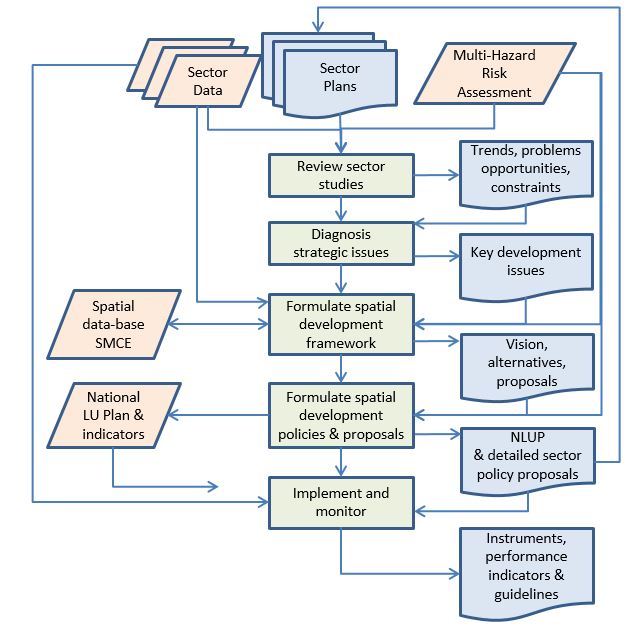
A NLUP will generally include a diagnosis of key issues across a range of development sectors (e.g. for agriculture, industry, economic development housing, tourism, etc.) and outlines a strategic vision and development objectives for future development activity. The plan also presents a basic spatial development strategy as well as sector and area policies and proposals. A NLUP process involves a substantial investment in human and financial resources for probably 1-2 years. The flowcharts above show the 5 main steps in the formulation of a NLUP: sector studies, diagnosis of strategic issues, formulation and assessment of the spatial development framework and related policies and proposals and implementation and monitoring. Information from risk assessments is required from the initial stages of the process and should be a key element in the review of sectorial policies and plans and the identification of strategic development issues. The flowchart (Figure 1 below) shows how risk analysis and planning processes are related (for more details of this see also methodology book 7.1). For example, map overlay operations between hazard maps and sector development plans can be used to highlight high risk locations which may need specific attention. Moreover, data on past events and in particular the location and scale of loss and damage caused can inform the identification of priority problems and locations.
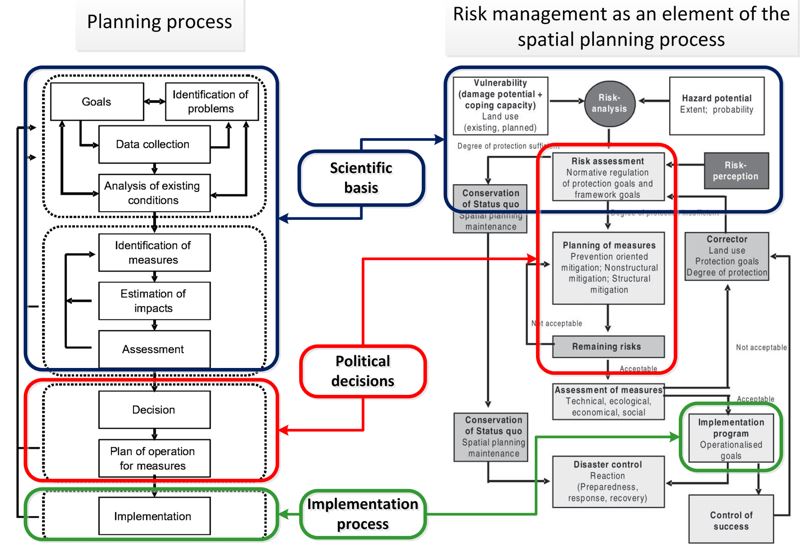
Figure 1: Risk assessment and management as planning process (adapted from Grieving and Fleischhauer, 2006)
This use case is illustrated mainly with examples from Grenada. Some key information about Grenada is shown in Table 1 below. More information about Grenada can be found here https://en.wikipedia.org/wiki/Grenada and information on their spatial planning systems in all CHARIM countries is described in Use Case 8.3 in Step 14.
|
Aspect |
Grenada |
|---|---|
|
Location |
Consists of the islands of Grenada, Carriacou and Petite Martinique. |
|
Total land area
|
344 Km2 (133 Sq. Miles) Grenada 321 Km2 |
|
Population (est.) |
109,590 (2012) |
|
Typical natural hazards |
Hurricanes, storm surge, volcanic activity, flooding, landslides, earthquake, tsunami |
|
Maximum elevation |
Mount St. Catherine - 840 m asl |
|
Terrain |
Mountainous |
Table 1: Relevant information about Grenada
Problems definition and specifications:
Planning problems are generally wicked problems meaning that the solution to one problem may lead to a new or an aggravated problem in the same or another location and/or at a future time. Essentially this means that trade-offs between competing issues will constantly need to be made, especially in integrated spatial planning processes. It is therefore not only important for stakeholders to identify and agree on issues they must also help to prioritize development issues in such a manner that the basis for trade-off based decision making can be established. The main issue at stake here is how to undertake a spatial planning process in which hazard/risk information is to be considered alongside of other development issues?
We are particularly concerned with how to use hazard/risk information in the NLUP process as, if adequate attention is given to hazards, the NLUP process can significantly reduce the levels of exposure of potentially vulnerable elements (buildings, critical infrastructures, population) and thereby reduce risk and increase resilience as damage levels and losses in future events should be lower. However, it must be remembered that 100% risk free development is not possible and that trade-offs with other development issues will always need to be made. For example, settlements require access and connectivity in order to be functioning communities, but sometimes the roads which provide such connectivity may have to pass through very hazardous areas where the likelihood of damage in the event of a flood or landslide is high. While measures may be undertaken to minimize their susceptibility to damage or loss (see use case 3.2.2 for example) extreme events may still have substantial impacts and connectivity may be reduced from time to time. One response to this is to ensure that settlements are not solely dependent upon a single road for access: planning for multiple road connections to settlements is more costly, but may reduce the likelihood of a settlement becoming inaccessible in a post-disaster situation.
Requirements for information will depend on the specific issues at hand in a given country and the nature of the planning activities. Fleischhauer et al. (2006) have described in general terms the type of hazard information that is required for two different planning activities (Table 2): those directed at keeping hazardous areas free of development and those directed at making differentiated decisions on what a given land area can be used for. The type of information required for both is very similar. Although their analysis was directed at the regional planning scale in Europe, similar data needs are expected to exist for the different Caribbean Island States. Typically the mapping scales for such data at National level is 1:25,000 - 1:50,000, though in some instances larger or smaller scales may also be used.
|
Hazard related issues |
Planning Activity |
|
|---|---|---|
|
Keeping areas clear of development |
Differentiated decision on land |
|
|
River flood hazard information |
-extent of flood -frequency of flood |
-extent of flood -frequency of flood |
|
Earthquake hazard information
|
-extent of earthquake area -intensity of earthquake (possible damages) -frequency of earthquakes |
-extent of earthquake area -intensity of earthquake (possible damages)
|
|
Landslide hazard information |
-extent of landslides and avalanches -intensity of landslides and avalanches -frequency of landslides and avalanches |
-extent of landslides and avalanches -intensity of landslides and avalanches |
|
Forest fire hazard information |
-extent of forest fires
|
- extent of forest fires |
|
Volcanic hazard information
|
-extent of volcanic effects -type of volcanic effects (pyroclastic flows, ash-cloud surges, lahars, lateral blasts) |
-extent of volcanic effects -type of volcanic effects (pyroclastic flows, ash-cloud surges, lahars, lateral blasts) |
|
Contents of hazard map
|
-hazard zones -hazard intensities |
-hazard zones -hazard intensities |
|
Risk mitigation planning instruments |
-priority zones for spatially relevant functions or uses -exclusion zones in which development is prohibited. |
-securing sites and routes for infrastructure |
Table 2: Overview of requirements of national planning for hazard related information (adapted from Fleischhauer et al., 2006)
Data requirements:
Given a NLUP's thematic scope and duration the NLUP process has extensive data requirements. Ideally, these can largely be satisfied by drawing upon sectorial studies and data bases as well as current national topographic databases and current planning documents and databases (see table below). Nevertheless shortcomings in data availability and quality should be anticipated and some primary data collection will almost certainly be required. For example, a national level flood analysis is only indicative of likely flood and exposure levels and should not be used for detailed site assessment and decision making (see Use Case 8.6 for more details of how such an analysis can be made and its limitations and applications).
Typical data sets that are required for incorporating hazard information in the planning process of Grenada are shown in Table 3 below. Table 4 on the other hand shows what data is actually currently available. Scales, spatial coverage and production date vary. It is important to consider such issues when using hazard data as the maps may no longer accurately reflect the current situation.
|
Scale\data types |
National (1:25,000 - 1:50,000) |
|---|---|
|
Topographic layers
|
National elevation contours or digital elevation model (DEM) Slope map (to identify steep and flat areas for development suitability) Built up areas (individual or groups of buildings) - Note that recent large scale building footprint data might also be used if it is available country wide and of sufficiently quality. Road network Main transport infrastructure facilities (e.g. airport, port) River networks |
|
Administrative units and/or Census units |
Various administrative units (e.g. Parishes) with associated statistical information on population etc. |
|
Land cover |
Land cover classes for example derived from satellite imagery: Classes (Built up, forest, water, bare soil, crop land, pasture, ..) |
|
Actual land use |
Actual land use map in classes relevant for sectorial policy and planning (e.g. conservation, industrial, commercial, agriculture, residential, recreational, touristic, institutional, or any other purposes). Latest data should be as current as possible and if possible some data of earlier times that would enable time series and development trend analysis should also be available. |
|
Land use and sectoral plans (currently such plans are not available in GIS format) |
These plans should ideally include national and/or local maps that identify where new developments are foreseen to occur in the current planning period. For all relevant national policy sectors: (e.g. environment and conservation, transportation, industry, commerce, tourism, agriculture, education, health, housing, recreation, etc.) |
|
National hazard maps depending upon the specific context
|
River flood hazard maps (1:5 to 1:50 years) Storm surge maps (1:10 to 1:100 years) Tsunami hazards Earthquake microzonation maps Landslide susceptibility (low, medium and high landslide density) Volcanic hazard susceptibility. (For details of the types of maps which can be generated see Use Case 6.1 ). |
|
Vulnerability maps |
Vulnerability assessment based upon Census data and wards Use Case 7.1 Elements at risk: buildings Use Case 7.4 Infrastructure vulnerability |
Table 3: Typical data types required for National Physical Development Planning in Grenada
|
Type |
Purpose Description |
Coverage |
Scale |
Date |
Autdor - Consultant |
Source |
|---|---|---|---|---|---|---|
|
Multiple hazards |
Identify areas prone to natural hazards and recommend mitigation measures |
Towns of St. George's, Gou-yave, Victoria Sauteurs, Grenville, Tivoli, St. Paul, St. David |
1:25, 000 |
June 1988 |
Vivian Bacarreza |
(CDERA, 2003d) |
|
Grenada erosion hazard map (draft)
|
100 year return hurricane event. Island-wide coastal erosion hazard map |
Island wide |
1:25, 000 |
October 2006 |
JECO Caribbean Inc |
JECO Caribbean Inc., 2006) |
|
Grand Anse erosion hazard map (draft) |
100 year return period hurricane event.
|
Grand Anse |
1:10, 000 |
October 2006 |
JECO Caribbean Inc |
(JECO Caribbean Inc., 2006) |
|
Landslide hazard map |
Prepared as part of national hazard mitigation plan |
Island-wide (main island) |
1:25, 000 |
October 2006 |
JECO Caribbean Inc |
(JECO Caribbean Inc., 2006) |
|
Landslide hazard map |
Prepared as part of national hazard mitigation plan |
Florida |
1:10, 000 |
October 2006 |
JECO Caribbean Inc |
(JECO Caribbean Inc., 2006) |
|
Flood hazard map |
Prepared as part of national hazard mitigation plan |
Island-wide (main island) |
1:25, 000 |
October 2006 |
JECO Caribbean Inc |
(JECO Caribbean Inc., 2006) |
|
Flood hazard map |
Prepared as part of national hazard mitigation plan |
St Jhon's river |
|
October 2006 |
JECO Caribbean Inc |
(JECO Caribbean Inc., 2006) |
|
Volcanic Hazard Zones based on Mt. St. Catderine eruption |
Prepared as part of national hazard mitigation plan |
Mt. Saint. Catderine area |
1:25, 000 |
October 2006 |
JECO Caribbean Inc |
(JECO Caribbean Inc., 2006) |
|
Kick em Jenny volcanic hazard zones |
|
Kick em Jenny area |
1:10,000 |
|
|
|
|
National level Flood map |
Under tde CHARIM project |
Grenada (main Island) |
1:50,000 |
February 2015 |
ITC |
UT-ITC |
|
Local level flood maps |
Under tde CHARIM project |
St Jhon's and Gouyava river catchments |
|
February 2015 |
Aris |
UT-ITC |
Table 4: Available hazard maps for Grenada (Adapted from Alam, 2015)
Like all plans a NLUP is future oriented and as the future is inherently uncertain, plans are based upon a mixture of calculations and assumptions about future situations and contexts. Current planning processes often adopt a scenario based approach that tries to accommodate a range of likely development conditions in the planning processes in such a manner that insights into a range of possible futures is provided. Scenario planning is often seen to be useful in situations where data availability or quality may be relatively low and is therefore likely to be a useful approach for Caribbean countries amongst others.
Analysis steps:
The process of preparing a NLUP consists of 5 main steps: Review of sector studies; Diagnosis of strategic issues; Formulate spatial development framework; Formulate spatial development policies and proposals; Monitoring and evaluation (see flowchart above). Each of these steps is discussed in more detail below, with special attention to where and how hazard information can be utilized in the NLUP process. Some examples of some uses of hazard data will be highlighted, but the lack of a database containing a national land use plan and other sectorial plans with their spatial implications for any of the islands prohibits a full GIS based assessment and demonstration. In the future, when such data becomes available this case study could be further developed to include such analyses.
General Application
1. Review of sector studies
That is intended to identify the main sectorial development trends, anticipated problems, opportunities and constraints. In addition to using the sector plans and related databases, this activity should also make use of multi-hazard risk assessment data and reports as these provide boundary conditions for the identification of problems, opportunities and constraints. In the first instance existing developments as well as sectorial plans and proposals for new investments should be compared with available hazard/risk information - this could best be performed through a GIS overlay analysis process to highlight potential exposure of current and future vulnerable elements to risk.
2. Diagnosis of strategic issues
Through an integrated analysis of the sector studies including the growth prognoses translated into land requirements, key development issues can be identified. Such analyses should be done by sector and where possible by administrative unit (e.g. Parish) in order to connect development issues to the localities more precisely. Contrasting land supply with anticipated land demand at local level helps to identify potential land supply problems that will likely require guidance or intervention from the national level. Typical questions that need to be addressed at this step are:
- What are the current and foreseen sectorial land demands for the planning period?
- Which strategic public investments in infrastructures are foreseen and what are their priorities?
- Can risks be addressed through mitigation or adaptation measures?
- Is there adequate suitable land to satisfy each sector's land demands?
3. Formulate Spatial Development Framework
The formulation of a spatial development framework will require the creation of a strategic vision for national spatial development that is elaborated into key development objectives, and considers various options that national spatial development may adopt. In spatial development planning there are almost always alternative possibilities that future spatial development might take. These alternatives should be evaluated on the basis of the overall spatial development objectives. Ultimately one integrated spatial development framework will be selected and approved by relevant technical and political authorities.
4. Formulate Spatial Development Policies and Proposals
This stage in the procedure will generate the final NLUP as well as associated guidelines and recommendations for more detailed sector and area policies and proposals regarding land use, population and settlement, economic activity, housing, community facilities, economic infrastructure, and environmental management (see for example Use Case 2.2). These products must be widely communicated, discussed and scrutinized according to legal provisions for public consultation and participation. They will also require careful scrutiny by sector agencies that perhaps need to adjust their current policies and plans according to these new NLUP provisions. This "leap-frogging" of policies and plans over time is a typical feature of integrated spatial planning processes and is a way to accommodate temporal inconsistencies between different types and levels of plans such as sectorial plans and an integrated spatial plan or a NLUP and local development plans.
5. Implement and Monitor
The effectiveness of planning cannot be guaranteed through participation in the plan development process only. A plan's performance can only be judged by the extent to which it has been effective in modifying the behavior of public and private development agents in such manner that its objective can be reached. This step in the NLUP process requires the formulation of instruments for the plan's implementation (these can be a combination of regulatory, incentive, penalty or communicative measures) that together seek to modify behavior such that spatial development objectives are attained. With regard to disaster risk reduction, the NLUP can for example seek to prohibit certain types of development in very high risk areas or to constrain development by requiring certain mitigation measures to be adopted in areas with lower risk levels. The NLUP may for instance also require the relocation of certain developments from particularly hazardous locations (see for example Use Case 2.4). The degree to which such measures have been implemented should be monitored during the planning period and, ultimately sanctions could be applied for non-compliance with NLUP proposals and guidelines.
Examples of hazard analyses at different stages
1. Review sector studies
As a first step relatively simple GIS overlay analyses can be undertaken in which various GIS hazard data layers are compared to sector oriented plans and maps. The manner in which this could be done is illustrated in Figure 2 below. A key issue to be considered here is what is the level of tolerable risk that a country or community is willing to accept? This issue is considered in more detail in the following section.
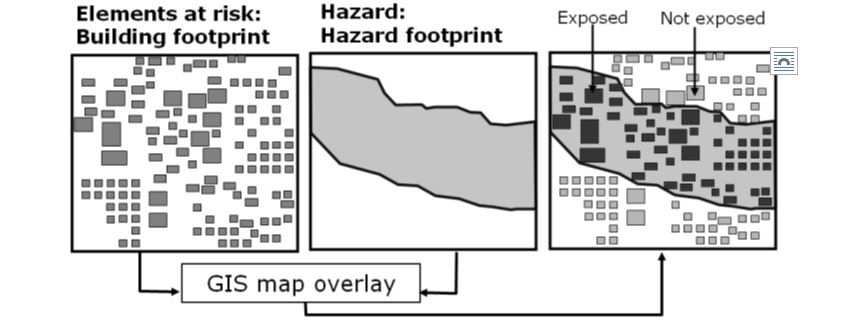
Figure 2: Spatial overlay of hazard map and elements-at-risk (Van Westen et al., 2011)
For example, spatial overlays can be made between the available island level hazard maps and GIS layers that give an impression of the scale and nature of affected elements: e.g. the actual land use, buildings, main infrastructure natures etc. However, to obtain a more integrated assessment of the current levels of exposure a multi-hazard susceptibility map and assessment could also be used following the methodology described here for the island of St. Vincent, see Use Case 6.1. Following this approach will allow the NLUP team to identify and quantify the current levels and locations of hazard exposure across the country.
As Grenada already has a national physical plan, the envisaged future land uses identified in this plan should be compared to a multi-hazard susceptibility map in order to identify which planned land uses that are highly sensitive to hazards (e.g. residential areas, industry, commercial, industrial) may be exposed to potential threats. These areas should be carefully assessed for possible mitigation measures, for which a cost-benefit analysis should be executed, or rezoning for a less sensitive land use (e.g. agriculture or forest) such that risks will not be excessively increased.
2. Diagnosis of strategic issues: what is the tolerable or acceptable risk?
One of the key issues in this step is the assessment of available, developable land which is either hazard free or subject only to hazards of a very low frequency and impact or for which cost-effective hazard mitigation measures can be undertaken.
A relatively easy and transparent way to use hazard maps in spatial planning is to use them in a series of individual overlay operations with land use zoning or current development maps. First, the individual hazard maps should use a standardized set of classes (methodology book chapter 5.1 has more details of how these can be calculated). Table 5 shows examples of how different return rates for flooding or storm surges could be used to define classes of hazard susceptibility from low to very high.
It is important for policy and decision makers to understand that the choice of tolerable risk level determines whether a locality will have more or less potentially usable or developable land at its disposal. This choice will therefore affect the use rights of both public and private land owners. For example, if decision makers opt to use the 1:50 year flood return period to represent intolerable risk levels, they will necessarily have a more restrictive spatial development policy than if they opt for a return period of 1:20 or 1:10 years. In the long term a more restrictive risk policy will reduce the expected losses associated with hazardous events, because it constrains spatial development and investments on land.
|
Hazard type |
Hazard / susceptibility classes |
|||
|
Low |
Moderate |
High |
Very high |
|
|
Tsunami |
- |
- |
- |
<1.87 m: 4 |
|
Storm surge |
10 year RP: 1 |
25 year RP: 2 |
50 year RP: 3 |
100 year RP: 4 |
|
Flooding |
5 year RP: 1 |
10 year RP: 2 |
25 year RP: 3 |
50 year RP: 4 |
|
Volcanic hazards |
Low: 1 |
Moderate: 2 |
High: 3 |
Very high: 4 |
|
Landslides |
Low: 1 |
Moderate: 2 |
High: 3 |
Very high: 4 |
|
Forest fires |
Low: 1 |
Moderate: 2 |
High: 3 |
Very high: 4 |
Table 5: Assigning weights to the classes of the individual hazard/susceptibility maps according to the method of Boruff and Cutter (2007)
For maximum clarity and ease of communication it is advisable for each tolerable hazard level map to be separately overlaid with the land use or parcel and main infrastructure maps of the territory. In this manner planners, decision makers and land owners can know which hazards are affecting which lands and infrastructures and to what levels.
It is also possible to create so called multi-hazard risk maps through Spatial Multi-Crietria Evaluation for example (see methodology book chapter 6.5 for details of such an analysis). However, while such maps are attractive because they integrate all hazards into one map, they explicitly conceal the underlying causes of risk, which should be understood and visible if their effects on land use planning are to be well understood and implemented. From a practical perspective the individual risk analyses are likely to be easier and more useful to work with.
3. Formulate spatial development framework
This framework must explicitly consider the constraints or limitations imposed upon spatial development by multi-hazard risk assessment. Special consideration should also be given to the possibility that new risks may be generated by future spatial development projects. For example, new settlement areas can generate increased runoff and contribute to downstream flood risk, or the creation of a new road may increase the possibility of landslides that may endanger the road itself or nearby settlements. It is therefore paramount that attention is given to the dynamics of both development and hazards.
In this step it is important to critically examine a number of issues. To determine if there is enough suitable land available (i.e. land that has both tolerable risk and is appropriate from other spatial planning perspectives). In this process overall risk is determined by combining the various hazard risk maps in order to define high risk priority zones (these should be completely void of development) and risk reserve zones (where the most sensitize land uses e.g. schools, hospitals or potentially dangerous activities e.g. industries working with hazardous substances) should be avoided. Some less sensitive land uses (e.g. warehouses for non-hazardous goods, etc.) may be allowed to remain or be allocated to locations with moderate risk if they do not entail significant economic or human risks (losses) in the event of a disaster. Such decisions are in line with the differentiated decision making approach referred to in Table 2 above.
The use of a qualitative risk matrix methodology (see Figure 3) that combines the probability of a hazard with the expected level of impact (related to vulnerability and exposure levels) can be useful. In such an approach data on the overall hazard intensity is combined with data on the degree of vulnerability (or potential impact) resulting in levels of risk. Users can adjust the number of levels used according to available data at their disposal. In the example below there are 5 levels for both hazard and vulnerability.
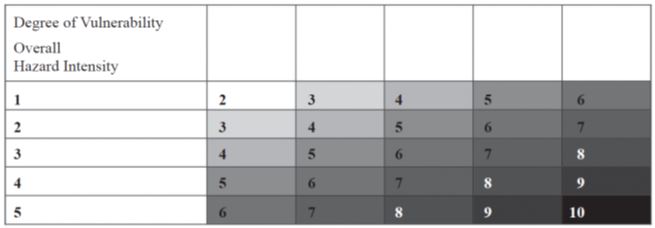
Figure 3: Integrated risk matrix (Source: Greiving, 2006)
If a national flood hazard map has been generated for 1:5 year, 1:10 year, 1:20 year and 1:50 year flood events, then 5 levels could be used as there would also be land for which the analysis shows that flood exposure is less than 1:50 years. The expected depth of flood waters or its expected velocity, could be used as an indicator of likely impact, again classified into various classes (e.g. 0cm, 1-25 cm, 25-75cm, 75-150cm, >150 cm). The values chosen here should reflect data availability and also political decisions related to the degree of risk that the country is willing to consider as acceptable. These levels should be reflected in official documents and decisions taken by the responsible authorities so that they can be properly communicated to all stakeholders.
In parishes with a sufficient supply of hazard free land to satisfy all anticipated demands this analysis is likely to be sufficient. The planning team can then consider how the required land uses can be allocated across space and where new main infrastructure elements (roads, etc.) will be needed. In allocating new urban land uses the planning team should consider issues such as:
- Connectivity:
- Connections to new settlement areas should be designed so as to balance connectivity requirements with minimal hazard exposure.
- The infrastructure networks should be designed with some redundancy to minimise the likelihood of isolation due to severe damage during a disaster.
- Settlements which have in the past been regularly isolated for long periods of time due infrastructure damage by landslides, floods etc. should receive extra attention in infrastructure planning.
- Settlement size and service levels:
- Small settlement areas should be located in such a manner that residents have easy access to existing social facilities
- Larger settlements should aim to be self-sufficient in terms of local social facilities (e.g. primary schools, health services, convenience shops, etc.).
If alternative locations for settlement expansion have been identified it is imperative to check if the proposed expansion areas can exacerbate hazardous conditions in the vicinity or downstream areas. In particular the planning team should be concerned about the possibility for development activities to aggravate landslide susceptibility. Although some information on this could be obtained from landslide susceptibility hazard maps, it is certainly advisable to consult a landslide expert to discuss possible implications of proposed developments. Also, as flooding is a frequent issue, it is necessary to determine how much additional surface water runoff can be anticipated from any new settlement area and how this may aggravate downstream flooding. This will require some local flood modeling to be undertaken (see for example Use Case 6.3). Even where no significant problems are found, settlement design should, where possible depending upon the local soil conditions, incorporate Sustainable Drainage Systems (SuDS) elements such as water infiltration and retention basins, etc. that can help to reduce upstream-downstream effects. SuDS approaches are now favored in many urban areas as a means for achieving water sensitive urban designs that are cost effective and can assist in handling peak water discharges in extreme rain events, making them also an appropriate instrument in the face of likely climate change effects such as increased extreme rain events. More information on SuDS and some related concepts can be found here http://www.susdrain.org and http://www.wsud.org/ . CHARIM use case 3.5 on multi-functional use of space also provides several examples of how various types of green infrastructure can be used to reduce flooding and simultaneously provide other functions.
4. Formulate spatial development policies and proposals
In this step, the planning team should translate its deliberations and decisions into an investment agenda, including specific proposals for each parish according to various time periods of the planning period. If the planning period is in total 20 years, planning and investment proposals might be divided over four 5 year periods for example. All proposals should be accompanied by estimated cost calculations such that the total package of proposals is within the envisaged financial reach of the country. This, may of course, include indications of requirements for loans or grants from international finance agencies.
One of the main outputs from this step will be the national land use plan. This should show the desired land use situation at the end of the planning period and also highlight key investment projects related to critical infrastructures.
Important for the reader will also be to understand for what type of hazard data to look and how this type of data can then be used in the land use plan. If a national level flood hazard map shows the floodplain for the 1:10 year event - what does this mean for the planner working on an NLUP?
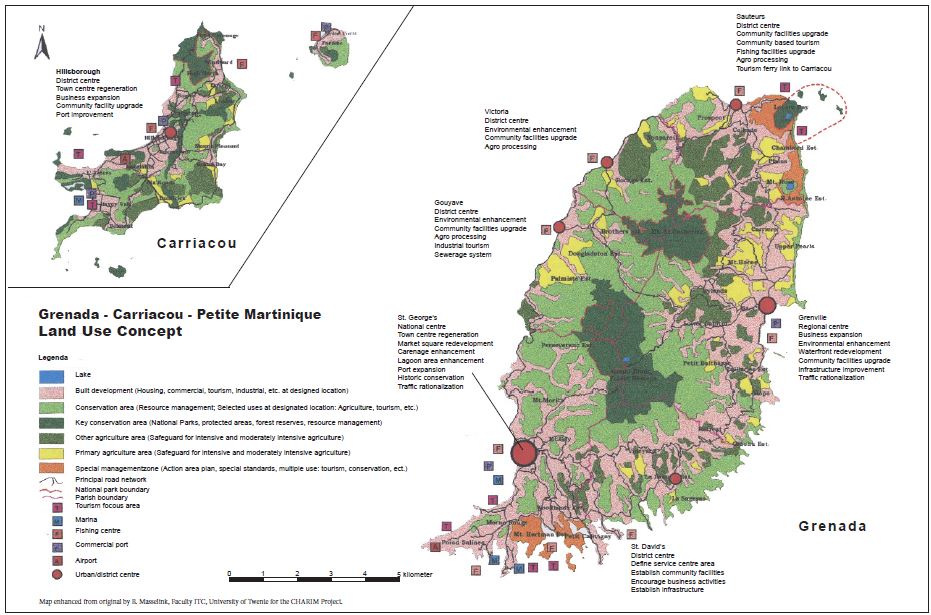
Figure 4: Draft National Land Use Concept Map, Grenada (Source: National Physical Development Plan, Grenada - Carriacou - Petite Martinique)
5. Monitoring and evaluation
The NLUP should be reviewed every 5 years. It is therefore important that the spatial data base is updated regularly so that it accurately reflects the actual physical developments, as well as providing an up to date picture of the hazard and risk situation. Local authorities and parishes should therefore ensure that all approved developments are updated in the appropriate GIS layers (see data required for NLUP above). Further, all hazard events (floods, storm surges, landslides etc. should be carefully recorded and where necessary hazard and risk maps updated. These map updating processes can use a combination of field observations, administrative processes (e.g. planning and building construction permits) and aerospace imagery (e.g. Google Earth, etc.). In the early stages of a plan review process it is advisable to consult hazard experts, local government representatives and citizens about possible important changes in their localities. A stakeholder workshop would provide a good setting for such an exchange of local knowledge.
At least every 5 years, a review of such changes should be made to determine the need for updating the hazard and risk assessment data. These updated assessments, should, in turn, be used to re-evaluate the NLUP proposals, concentrating on the most recent developments of the last 5 years and those anticipated in the remaining planning period. Where risk assessments point to likely problematic situations such land use and infrastructure proposals should be reconsidered and the necessary adaptations in plans should be made. These processes will require a considerable amount of professional expertise from the planning team, as well as stakeholder consultations.
Results:
Although not shown explicitly in the flowchart, making a NLUP involves a mix of analyses, design and assessment that are intertwined with stakeholder participation and technical and political scrutiny and ratifications processes. Normally, the relevant planning legislation will set out the major steps to be undertaken as well as the necessary provisions for stakeholder engagement and participation, which are often done at several stages throughout the whole process. The final plans and proposals should be approved by senior technical officers of relevant ministries, the cabinet and the parliament; though in practice full political ratification is sometimes not done. Failure to do so however, weakens the legitimacy of the NLUP and makes enforcement difficult if not impossible.
A NLUP process generates a series of intermediate and final products. Many of these products take the form of reports and can be produced as hard or softcopy documents for wider public distribution. Inevitably a large amount of spatial and other data will be produced in the process. Some of this concerns intermediate data products with a predominantly technical value, while other datasets may also be valuable to a wide range of stakeholders. While ideally all data should be properly documented with metadata to ensure its future usability, this is especially important for the key datasets and final plan products that are likely to be widely distributed. Proper metadata is required to ensure that users know the characteristics and limitations of the data and how it should and should not be used. Priority should be given to make the final plan data widely available and accessible through open data platforms. The same would apply to sector plans and the multi-hazard risk assessment data which, given the Caribbean context, should be easily and freely available to all stakeholders.
Conclusions:
Multiple hazard and risk information are a key input into the NLUP. They provide important information on the existing high risk development for which hazard mitigation responses of various types may be required and they also establish the boundary conditions within which national land use development strategies and plans for new public and private investments and developments can be formulated and decided upon. Throughout the plan preparation period, which may take several years, technical analyses relating hazards and spatial planning alternatives should be carried out in parallel to sector based assessments, stakeholder participation and negotiations in order to reach consensus on the final NLUP. Throughout the NLUP process a suite of data sets for individual hazards, vulnerability assessments and risk assessments are required. Analytical methods for the combination of such risk related data with topographic and settlement data range from simple GIS overlay operations for each hazard type to more sophisticated analyses for multi-hazard risk assessments.
Both hazard and development conditions are dynamic and subject to various interactions. Unregulated development can lead to increased hazard exposure, but this can also change as a result of unforeseen changes in the hazard situation itself. Poorly planned and designed developments can also aggravate hazardous situations. Good spatial data management that enable such interactions to be identified and targeted in a timely manner is therefore an important support tool for risk related spatial planning at the National level.
References:
Alam, Mujeeb. 2015. Application of Hazard and Risk Information in Spatial Planning in Grenada. Unpublished MSc thesis, University of Twente The Netherlands.
Fleischhauer, M., Greiving, S., & Wanczura, S. (Eds.). (2006). Natural hazards and spatial planning in Europe. Natural Hazards and Spatial planning in Europe (p. 204). Dortmund.
Greiving, S. 2006. “Integrated Risk Assessment of Multi-Hazards: A New Methodology.” Natural and Technological Hazards and Risks Affecting the Spatial Development of European Regions. Geological Survey of Finland, Special Paper 42, 75–82.
Greiving, S. and Fleischhauer, M.. 2006. “Spatial Planning Response towards Natural and Technological Hazards.” In Natural and Technological Hazards and Risks Affecting the Spatial Development of European Regions, edited by Philipp Schmidt-Thomé, Special Pa, 109–23. Geological Survey of Finalnd.
Van Westen, C., Alkema, D., Damen, M. C. ., Kerle, N., & Kingma, N. . (2011). Guide Book: Multi-hazard risk assessment. ITC and UNU school on Disaster Geo-information Management (p. 371). Enschede, The Netherlands.