

Saint Lucia

Total area:
3606 km2
Population:
174,000 (2010)
Coastline:
158 km
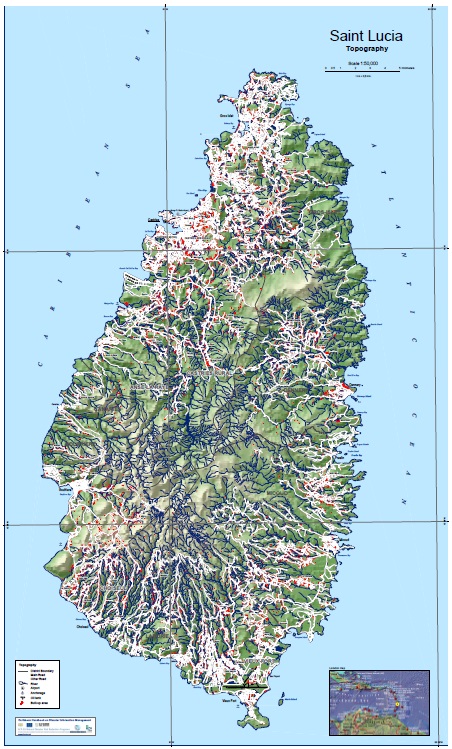
Terrain:
Volcanic and mountainous with some broad, fertile valleys. Max. elevation: 950 m
Natural hazards:
Saint Lucia experiences landslides, particularly in the aftermath of heavy rains. Saint Lucia's mountainous topography coupled with its volcanic geology produces a significant opportunity for landslides. Much of the island's housing is distributed along steep slopes and poorly engineered and constructed housing is particularly at risk. Additionally, the island periodically experiences earthquakes of generally lower magnitudes. The island is classified as seismic zone 2 on a 4-class scale, indicating low to moderate earthquake risk. Also storm surge and flash floods are among the other risks regularly faced by the island.
Summary statistics (2014)
(http://www.preventionweb.net/countries/lca/data/)
More statistical information is available from: http://data.worldbank.org/country/st-lucia
|
Population |
People |
182,273 |
|---|---|---|
|
Urban |
% Total population |
18.459 |
|
Rural |
% Total population |
81.541 |
|
Urban population growth |
% Annual |
0.821 |
|
Population density |
People / km2 |
298.8 |
|
GDP (Gross Domestic Product) |
Million US$ |
1,332.22 |
|
GDP per capita |
Million US$ |
7,328.37 |
|
Capital stock |
Million US$ |
3,362 |
|
GFCF (Gross Fixed Capital Formation) |
Million US$ |
348.568 |
|
Social Expenditure |
Million US$ |
55 |
|
Gross Savings |
Million US$ |
177.253 |
|
Total reserves |
Million US$ |
192.223 |
Natural disaster impact (2014)
(http://www.preventionweb.net/countries/lca/data/)
|
8-year moving average 2005-2013 |
Extensive [%] |
Intensive [%] |
|
|---|---|---|---|
|
DataCards |
8.25 |
100 |
|
|
Deaths |
2 |
100 |
|
|
House destroyed |
1.88 |
100 |
|
|
House damaged |
223.5 |
100 |
|
|
Injured people |
5 |
100 |
|
|
Displaced people |
146.63 |
50 |
|
|
Combined economic loss (US$) |
2,165,836.94 |
100 |
|
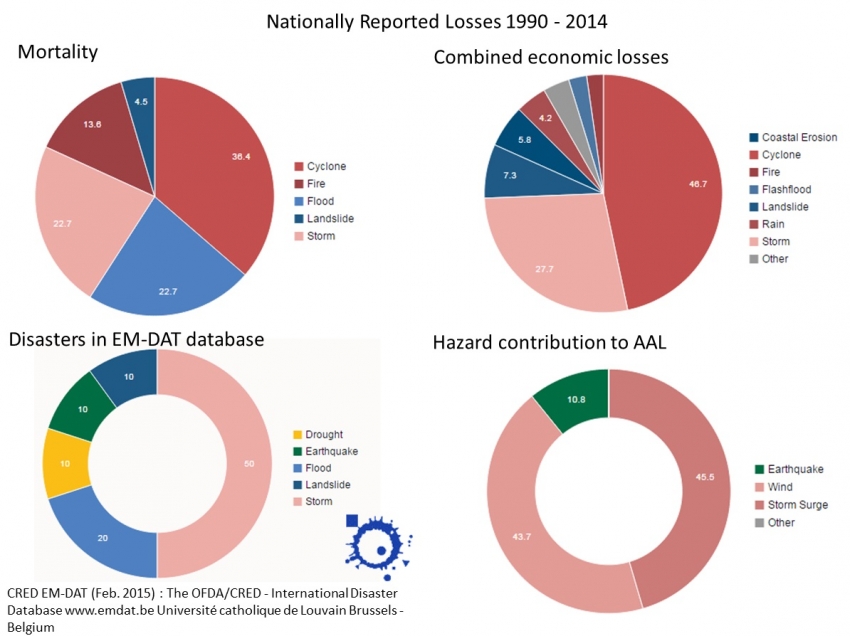
Probabilistic risk results. Average Annual Loss (AAL) by hazard
(http://www.preventionweb.net/countries/lca/data/)
|
Hazard |
Absolute |
Capital |
GFCF |
Social |
Total |
Gross |
|---|---|---|---|---|---|---|
|
[Million US$] |
stock[%] |
[%] |
exp[%] |
Reserves [%] |
Savings [%] |
|
|
Earthquake |
5.06 |
0.151 |
1.452 |
9.265 |
2.632 |
2.855 |
|
Wind |
20.42 |
0.607 |
5.858 |
37.39 |
10.623 |
11.52 |
|
Storm Surge |
21.25 |
0.632 |
6.096 |
38.91 |
11.055 |
11.988 |
|
Tsunami |
0.01 |
0 |
0.003 |
0.018 |
0.005 |
0.006 |
|
Multi-Hazard |
46.74 |
1.39 |
13.409 |
85.584 |
24.316 |
26.369 |
Spatial data and hazard assessment activities:
Vulnerability assessments, hazard maps and risk assessments for critical facilities have been prepared for flooding due to storm/wind surge, high wind, drought and debris flow. While maps have been developed, they have not been integrated in the decision support or policy-making process. Presently, NEMO does not support a GIS capability and there is currently no program supporting additional hazard mapping or updates to current hazard maps. Supporting base maps have been prepared in a GIS format and include infrastructure and drainage, national topography, land use, rainfall, soils, geology, etc. These are of varying age, prepared in the 1980s and 1990s, and may not reflect current conditions.
Download World Bank GFDRR report on Saint Lucia
Global Assessment Report on disaster Risk Reduction 2015.

Download the summary for Saint Lucia.
Download the Saint Lucia Country document on disaster risk reduction.