Summary
This use case addresses the options for planning of a road from Dennery to Choc in St. Lucia, addressing in particular the potential impact of hazard on the road trajectory. The general methodology that is developed in chapter 8.3 of the methodology handbook is applied to generate and analyze potential alternatives for a new road. In this process the natural hazards of flooding and landslide play a role alongside criteria such as slope, people served, environmental effects and cost. The evaluation method that is used evaluates two already developed route alternatives and concludes that one alternative scores better on all counts.
Keywords:
Road planning, flooding and landslides, spatial multi-criteria analysis
| Before you start: | Use case Location: | Uses GIS data: | Authors: |
|---|---|---|---|
| Read chapter 7 of the Methodology Book and Section 5.4 of the Data Management Book | Saint Lucia. | No | Mark Brussel |
Introduction:
Constructing roads in the eastern Caribbean islands is a challenge. The mountainous terrain and the frequent occurrence of landslides and floods along road trajectories make road construction technically challenging and expensive. Once constructed, roads continue to be affected by landslides and floods, which increases operation and maintenance costs manifold. It is therefore imperative that any road planning activity that is undertaken in these conditions takes natural hazards into account. There are however other considerations. The islands have rich ecosystems and natural resources that need protection. Also cost and economic benefits are of importance. Therefore many criteria will be involved in a typical evaluation of alternatives.
On the island of St. Lucia a long standing discussion is ongoing to develop a new North - South route over the island from Vieux Fort to Gros Islet, to open up parts that are as yet not properly connected and to relieve traffic in the congested roads of the capital Castries. Already in 2000 an elaborate study was performed that concluded that road construction on the island is extremely expensive, mostly due to the difficult terrain. At the time, anticipated traffic volumes and benefits of accessibility would not make the part of the road that would connect Dennery to Choc economically feasible.
Notwithstanding the above, the development of a more direct connection between the two locations has remained on the agenda. The current connection runs via the capital Castries, which is an indirect connection that is hampered by traffic jams and creates unnecessary traffic in the capital Castries.
In this use case we use a fast procedure to make an initial evaluation of two possible route alternatives for a new road between Dennery and Choc Bay. The first alternative was developed in the feasibility study by DIWI (2001) indicated in the map below as Alternative 1, the second is a route that is designed to follow as much as possible existing roads and built up areas, to reduce construction cost and impact.
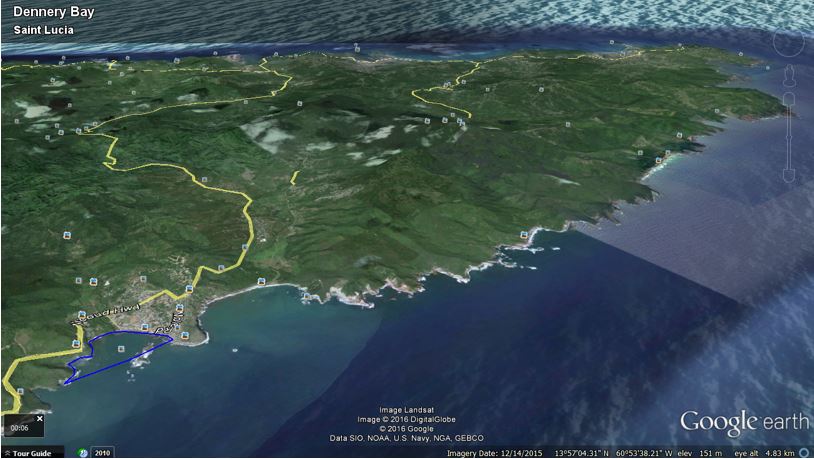
Figure 1 Google Earth birds eye view of area between Dennery and Choc Bay
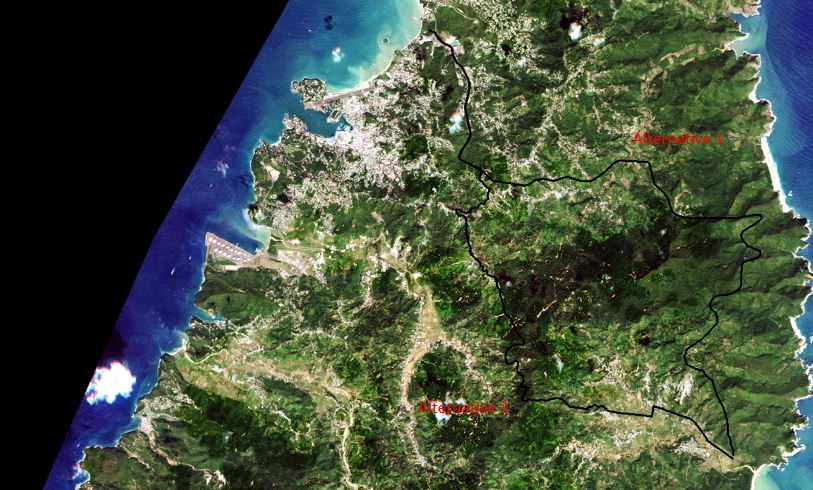
Figure 2 Rapid Eye Image of 2011 with both road alternatives
The method used is meant to evaluate the best routes on main criteria. It does not involve calculation of actual construction and other costs and is not an economic appraisal method, rather it is a fast way to compare route alternatives. Notwithstanding the limited scope, we believe that the use of accurate digital terrain models and flood and landslide data in GIS allow for a useful evaluation of natural hazards and slopes.
Objectives:
The objective of this use case is to demonstrate a method to analyze possible alternatives for the planning of a new road.
Flowchart:
For a full description of the methodology we refer to the methodology book, chapter 8.3, in which all steps are given and explained. The chart below provides an overview of the methodology followed.
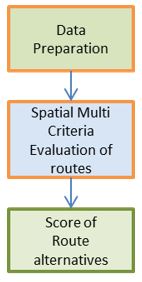
Figure 3 Main methodology
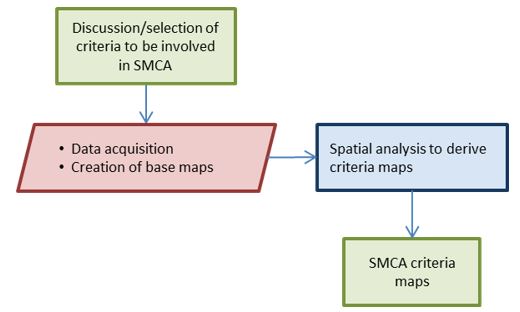
Figure 4 Data preparation phase
The criteria used are based on the choice of the author and could of course be changed/extended and supplemented. The purpose of this analysis is not to provide the best possible solution for the routing problem, but rather to demonstrate how the methodology works and give an idea of the kinds of solutions that are generated. A real life discussion between policy makers and planners is needed to determine local priorities, select criteria, determine their scores and importance. In addition, better quality and additional data could augment the results of the process. The analysis is implemented in the software ILWIS (http://52north.org/communities/ilwis/ilwis-open), an open source software that has been developed by ITC. This software contains an SMCE module that is suited for the type of analysis discussed in this use case.
Analysis steps:
The analysis starts with the selection of criteria. The following criteria have been included:
Natural hazards
- Flood hazard (cost criterion)
- Landslide susceptibility (cost criterion)
Environment and other constraints
- Environmentally sensitive areas (constraint criterion)
- Environmental value of land (cost criterion)
Cost
- Cost of land to be acquired (cost criterion)
- Cost of construction (cost criterion)
- Cost of river crossings (cost criterion)
People served
- People served within 250 m of the planned road (benefit criterion)
Development of criteria maps:
Flood hazard
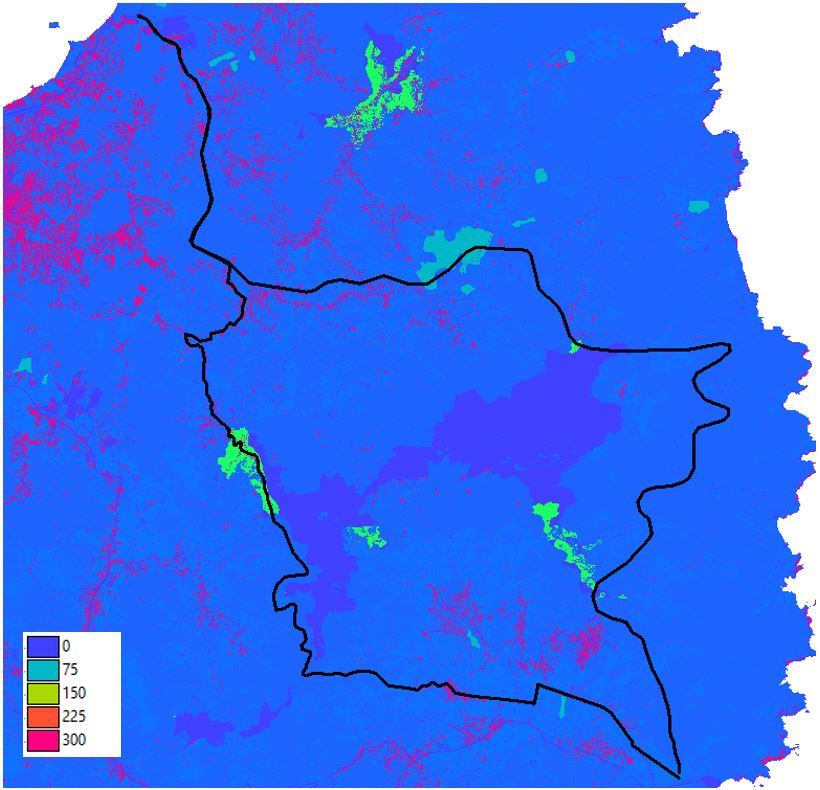
The flood hazard in relation to the road trajectories can be seen on the following map (Figure 5) which has been produced under the CHARIM project. For each class of flood hazard severity a score is assigned during the SMCE procedure in ILWIS. This is done via an attribute table in which the unique classes of the map are linked to their score, which is calculated in an additional column.
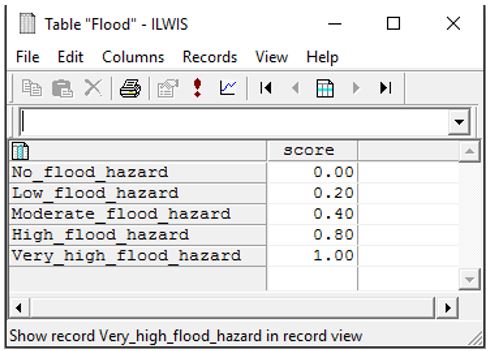
As we are dealing with a cost criterion, the best situation gets a score of 0, whereas the worst situation gets a score of 1. A similar procedure is followed with the other class criteria maps on landslides and environmental value. A visual inspection of the map shows us that both routes are affected only in a limited manner by flood risk, mostly because of the relative high terrain that they go through.
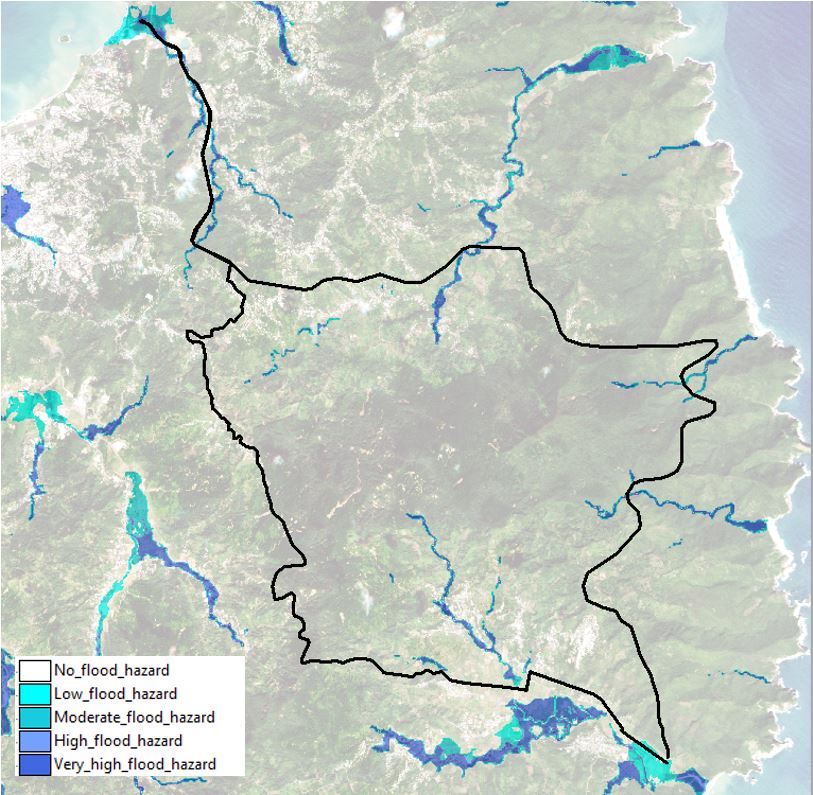
Figure 5 Flood hazard map with road trajectories
By carrying out a GIS overlay procedure of the road trajectories with the Flood Hazard Map we calculate for all road pixels their corresponding scores in the Flood Hazard map. If we score both alternatives accordingly and quantify the overall cost of flooding for both alternatives, we get the following overall result:
|
FLOOD COST |
Route alternative 1 |
Route alternative 2 |
|---|---|---|
|
Mean Flood cost factor |
0.06 |
0.04 |
|
Length of route |
22704 m |
20653 m |
|
Length corrected and normalised cost factor |
1 |
0.61 |
Route alternative 2 therefore scores better than alternative 1, but it must be stated that, since the mean cost factors are low, flood risk as such is not very severe. Also it is localized mostly at river crossings where adequate (albeit expensive) measures can be taken such as bridge construction. For these reasons, in the overall analysis flood hazard will be given a lower weight than Landslide hazard.
Landslides
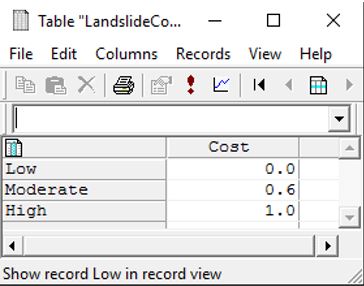
The landslide hazard map (Figure 6), produced by the CHARIM project, consists of three classes: Low susceptibility, Moderate susceptibility and High susceptibility. The classes are costed as follows:
As can be seen from the map landslide hazards constitute a very severe problem for these two road trajectories. For considerable parts of both trajectories landslide risk is high, particularly in the higher areas. This makes both routes not very suitable and as a result, road construction and operation and maintenance of the road once constructed will be expensive.
As we can see from the table, the overall cost scores of both alternatives are much higher than in the case of flooding. Also here, Route alternative 2 scores better, although the difference is not as high.
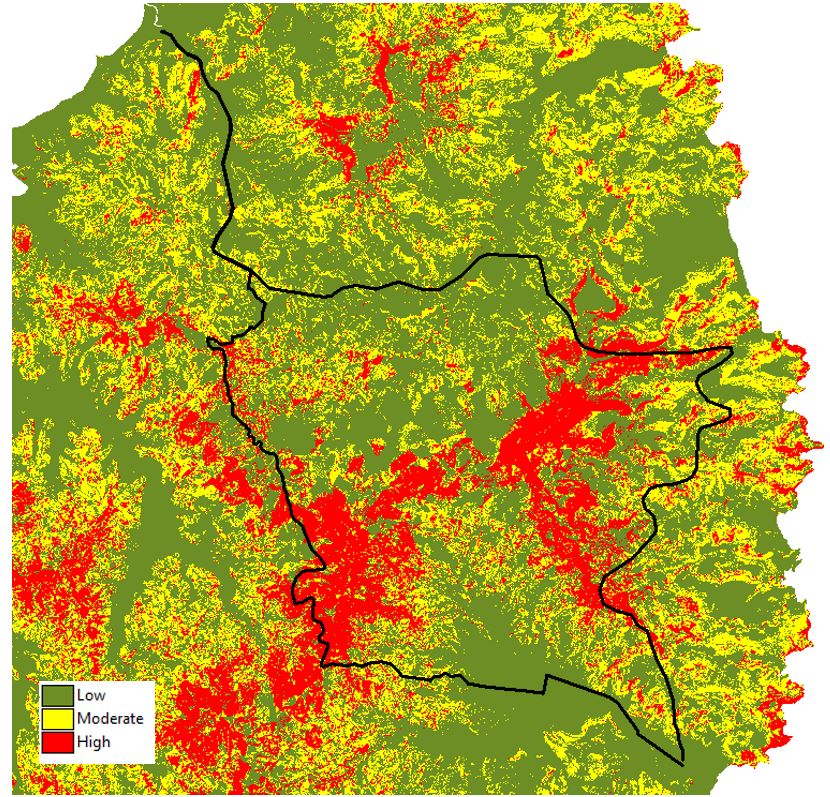
Figure 6 Landslide Hazard map
The table below summarizes the relative costs of both alternatives.
|
LANDSLIDE COST |
Route alternative 1 |
Route alternative 2 |
|---|---|---|
|
Mean landslide cost factor |
0.31 |
0.26 |
|
Length of route |
22704 m |
20653 m |
|
Length corrected and normalised cost factor |
1 |
0.76 |
Environmentally sensitive areas (constraint criterion)
There are a number of protected environmentally sensitive areas where no road construction should take place. These areas will act as spatial constraints in the analysis. It is not entirely well defined what they are. Different sources indicate different protected areas. The IUCN-UNEP World Database on Protected Areas (WDPA) section on St. Lucia of February 2015 provides the following map.
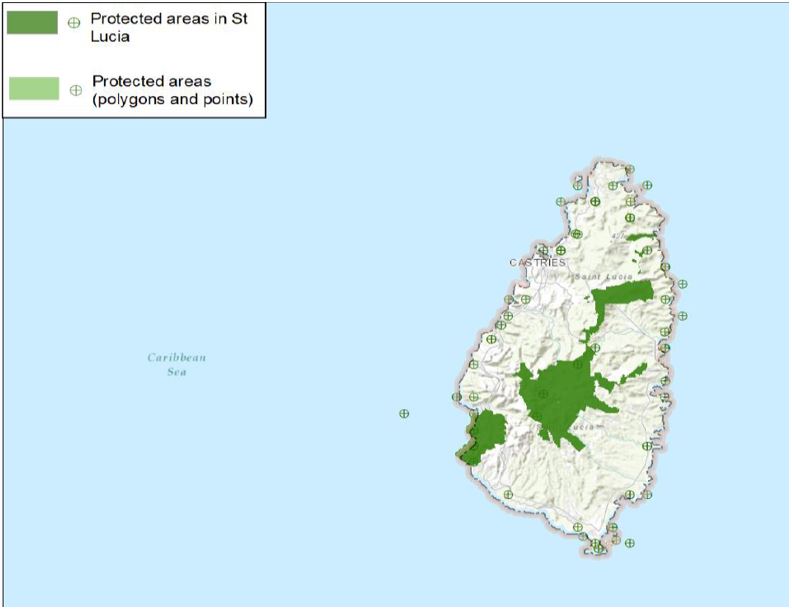
Figure 7 Overview of protected areas in St. Lucia
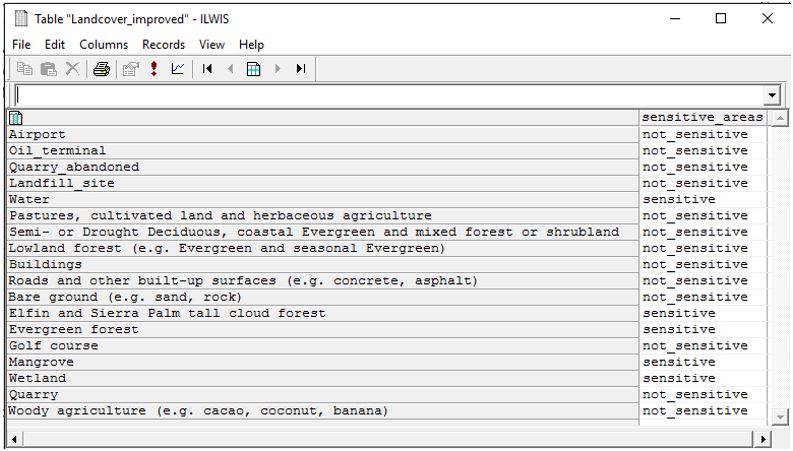
Other sources indicate different areas, but all sources share the inclusion of the native forests. On the websites of the St. Lucia government no conclusive limits can be drawn. Also, how far certain areas require a level of protection that makes them unfit for passing a road through will be the object of political debate. For the purpose of this analysis the following areas are excluded from road construction on the basis of their environmental sensitivity:
- Water bodies
- Elfin and Sierra Palm tall cloud forest
- Evergreen forest
- Wetland
- Mangrove forest
A map is created that is based on the land cover map in which the environmentally sensitive areas are classified. This is again done through the production of an attribute table of the land cover map, in which a new column is made in which sensitive and non-sensitive areas are indicated (see table below).
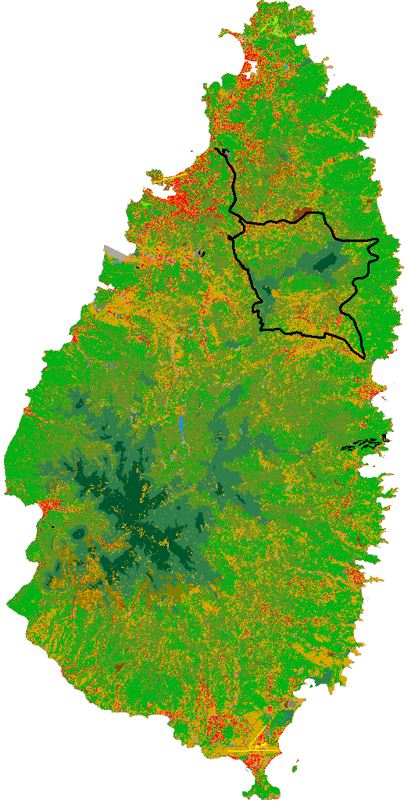
Figure 8 Land Cover map
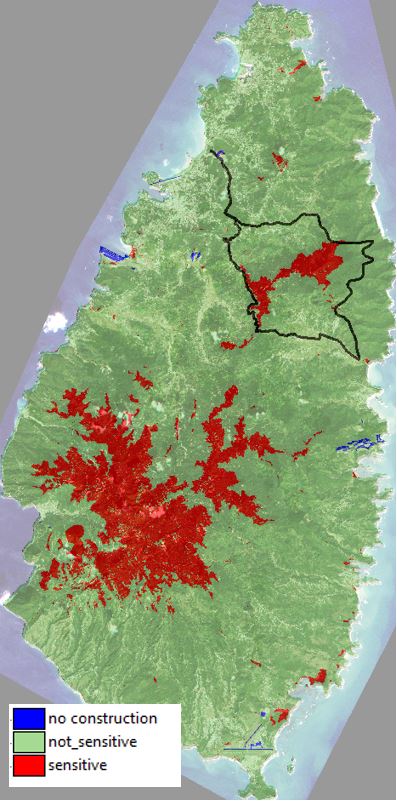
Figure 9 Sensitive areas
The table is used to create an attribute map indicating only the sensitive and non-sensitive areas (Figure 7). As can be seen from this map, both road trajectories are bypassing the sensitive areas and are therefore not hampered by this spatial constraint.
The base map of land cover that is used for this analysis is also used for the calculation of the environmental value of land and the land acquisition cost.
Environmental value of land
In addition to the areas that are environmentally too sensitive to be included, areas may also have environmental significance in the sense that they support the ecosystem, reduce runoff and produce co-benefits that make them valuable. We have classified the remaining land cover classes in their high, medium or low environmental value. These have been assigned a cost score of 0, 0.5 and 1, respectively. This produces the following outcome for the two routes:
|
ENVIRONMENTAL COST |
Route alternative 1 |
Route alternative 2 |
|---|---|---|
|
Mean environmental cost factor |
0.84 |
0.55 |
|
Length of route |
22704 m |
20653 m |
|
Length corrected and normalised cost factor |
1 |
0.60 |
Cost of land to be acquired (cost criterion)
In this map, we assign scores for the non-excluded land cover classes, associated with the cost of land acquisition of that type of land. In the absence of actual data these are estimated as indicated in the land price column of the table below, and then standardized in the SMCE procedure. These prices are also added as a column in the attribute table of the land cover map and can be changed as appropriate.
|
|
Land acquisition prices (ECD/m2) |
|---|---|
|
Bare ground (e.g. sand, rock)
|
10 |
|
Buildings
|
300 |
|
Golf course
|
100 |
|
Lowland forest (e.g. Evergreen and seasonal Evergreen)
|
30 |
|
Pastures, cultivated land and herbaceous agriculture
|
50 |
|
Roads and other built-up surfaces (e.g. concrete, asphalt)
|
0 |
|
Semi- or Drought Deciduous, coastal Evergreen and mixed forest or shrubland |
30 |
|
Woody agriculture (e.g. cacao, coconut, banana)
|
75 |
The map indicates land acquisition estimates along the two road trajectories. As already in part of the trajectory there is a road, which reduces the land acquisition cost at that location, only the newly to be constructed sections are evaluated using this criterion. This results in the following table:
|
LAND COST |
Route alternative 1 |
Route alternative 2 |
|
Mean land acquisition cost factor |
36.7 |
33.5 |
|
Length of new sections to be constructed |
17971 m |
4040 m |
|
Normalised and length weighted cost factor |
1 |
0.21 |
Road construction
Road construction costs are difficult to determine in an initial planning phase, as no designs are available that can be quantified. Obviously there are some factors that will influence to a large extent the costs of the road: the topography of the terrain, the length of the road, and the number of special features such as bridges and culverts.
Here we use the following sub criteria: slope, river crossings and road length. As we are not so much interested in absolute costs, but more in relative costs, we try to quantify the influence of slopes as follows: Based on the slope map we identify the classes that are suited for road construction; those sections where permissible gradients can be realized. Using the Overseas Road Note (TRL, 1998), we limit the permissible gradient to 10%. Above 10% we need to construct curves and hairpins to overcome differences in terrain altitude. We do this by multiplying cost with a factor of 2 for slopes between 10 and 20 % (As average road length will be doubled in this case), 3 between 20 and 30 % etc, up till 50 % which we choose to be the maximum slope in order for the for side slopes to not become too steep. Although some slope values of above 50 % are still found, these are few and would need to be avoided where possible in the detailed road alignment development. In order to have a more generalized view of the terrain slopes, to avoid sudden very steep jumps in the slopes, we use a DEM that is resampled to 50 m. Hereafter we calculate slope percentages by reclassifying the map into 6 classes, according to the table below
|
Slope percentage |
Class |
Cost factor |
Normalised cost factor |
|---|---|---|---|
|
0-10 |
1 |
1 |
0.1 |
|
10-20 |
2 |
2 |
0.3 |
|
20-30 |
3 |
3 |
0.5 |
|
30-40 |
4 |
4 |
0.7 |
|
40-50 |
5 |
5 |
0.9 |
|
Above 50% |
6 |
6 |
1 |
The result table below provides an overview of how the two proposed routes compare in terms of slope:
|
|
Route alternative 1 |
Route alternative 2 |
|---|---|---|
|
Mean slope (%) |
28.0 % |
22.6% |
|
Standard deviation slope (%) |
21.8 % |
24.3 % |
|
Median slope (%) |
25.6 % |
15.6 % |
|
Maximum slope
|
122.4 % |
197.7 % |
|
Length of route |
22704 m |
20653 m |
|
Mean cost factor |
0.46 |
0.35 |
|
Length corrected and normalised cost factor |
1 |
0.70 |
Cost of river crossings
The cost of river crossings has been estimated on the basis of a flow accumulation map, in which for each pixel the areas that are contributing to the flow at that particular location are calculated. By putting a threshold at 2000 pixels, or 5 ha, a network of streams appears that can be overlaid on the alternative road trajectories. This threshold value is associated with a large enough flow. Doing so provides the following result:
|
|
Route alternative 1 |
Route alternative 2 |
|---|---|---|
|
New bridges needed |
14 |
7 |
|
Cost factor |
1 |
0.5 |
People within 250 m of road (benefit criterion)
When the new road connects existing communities more easily to the Dennery and Choc area, this is seen as a benefit, as the accessibility of these people to services, jobs and education will improve. This criterion is calculated as the number of buildings that are in the vicinity of the newly to be developed road. This is done through a buffering and overlay procedure in GIS, as illustrated with the map below.
|
|
Route alternative 1 |
Route alternative 2 |
|---|---|---|
|
No of buildings served |
1560 |
1976 |
|
Benefit factor |
0.79 |
1 |
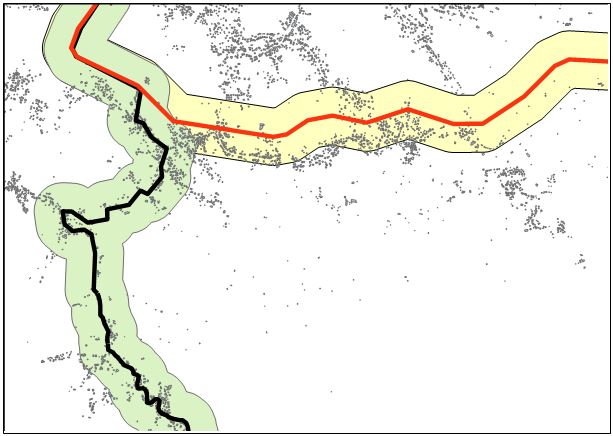
Figure 10 Visual interpretation of buffer calculation
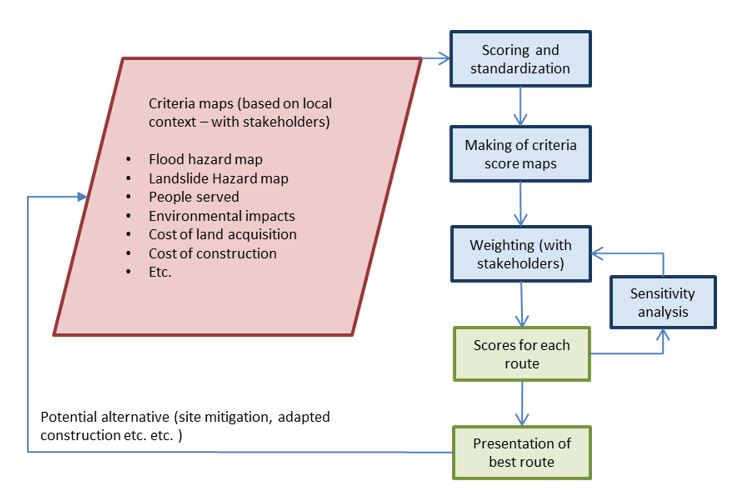
Figure 11 SMCE procedure
After all maps are prepared, the SMCE analysis, as indicated in Figure 10 can be completed. This is done using the ILWIS SMCE software. Below, an overview is given of the way the SMCE window looks and how the criteria tree is shaped.
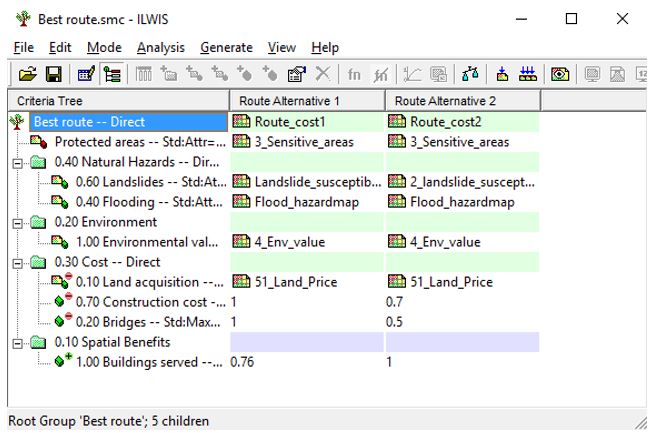
Figure 12 Overview of Best route table in ILWIS SMCE
In the tree, weights need to be specified for each of the criteria maps, as well as for each particular group. For example, in Figure 12, Natural hazards gets a weight of 0.5, environment 0.2 and costs 0.3. For different weight combinations different models can be run and different results obtained.
Final Results
The table below shows the overall scores for each of the criteria without weighting.
|
|
Criterion |
Route alternative 1 |
Route alternative 2 |
|---|---|---|---|
|
1 |
Flooding |
1 |
0.61 |
|
2 |
Landslides |
1 |
0.76 |
|
3 |
Environmental value |
1 |
0.60 |
|
4 |
Land acquisition |
1 |
0.20 |
|
5 |
Construction cost |
1 |
0.70 |
|
6 |
River Crossings |
1 |
0.50 |
|
7 |
Buildings served (Benefit) |
0.79 |
1 |
It is very interesting to note that for all cost criteria (1-6) Route alternative 1 is the most costly and for the benefit criterion (7) Route alternative 1 is the least beneficial. This implies that whatever weighting scheme we apply, Route alternative 2 will always come out as the best alternative by far. The only impact that weighting will have is on the relative difference between cost. If we apply the weighting scheme indicated in Figure 12, we arrive at a normalized cost of Route alternative 2 of 0.66 compared to the cost of 1.00 for Route alternative 1.
The difference is so substantial that further steps like a sensitivity analysis make little sense, the result will not alter the ranking.
Conclusions:
- The GIS techniques used allow for a fast and value free analysis of which route is the best in terms of the criteria chosen. The inclusion of hazard and risk information offers valuable insights into the anticipated effect of hazards on the road trajectories.
- In view of the score difference of the two alternative routes it is anticipated that adding more criteria and adjusting the weights will not significantly alter the final result in the sense of a change in ranking. This is caused by the fact that the trajectory of Route alternative 2 is almost 10 % shorter and that it scores better on natural hazards in particular.
- It is obvious that road construction in the mountainous and hazardous terrain of St. Lucia is a difficult and costly affair. Whether or not the best ranked route makes sense to construct in terms of cost and benefits would need to be evaluated by a much more thorough cost/benefit analysis.
Recommendations
- It is recommended that multiple stakeholders are involved in setting up out the SMCE analysis. A discussion on which criteria should be involved and how they should be weighted needs to take place locally. Probably also additional data would be needed to carry out the evaluation. Care should be taken not to overly complicate the procedure by bringing in too many criteria. This will in the end lead to more averaged out scores of the alternatives and little extra information. Only the relevant criteria need to be involved.
- The up-to-date-ness and quality of data and maps needs to be secured to enhance the quality of the analysis and the decision making. Where data quality is insufficient it is better to exclude a criterion, or improve data quality.
References:
DIWI consult international (2001). Feasibility report for the construction of a highway from Vieux Fort to Gros Islet.
IUCN, UNEP, WCMC, (2016). Protected planet St. Lucia, retrieved from http://www.protectedplanet.net/country/LC consulted on the 5th of Jan 2016
The Encyclopedia of Earth (27 May 2009). Protected areas of Saint Lucia. Retrieved from http://www.eoearth.org/view/article/155412 on 15 February 2016
TRL (1998). Overseas Road Note 6: A guide to geometric design, Transport and Road Research Laboratory, London
Gordon Keller & James Sherar, 2003, Low-Volume Roads Engineering, Best Management Practices Field Guide, By USDA Forest Service/USAID
Last update: 24-03-2016