Author: Nanette C. Kingma, Cees van Westen and Emile Dopheide
Keywords:
Links:
Introduction
There are a number of tools that can be used in evaluating the best scenarios for disaster risk reduction:
- Cost Benefit Analysis is used to compare costs and benefits of a project over a period of time in monetary terms;
- Cost Effectiveness Analysis: (CEA) has most of the features of CBA, but does not require the monetization of either the benefits or the costs (usually the benefits). CEA does not show whether the benefits outweigh the costs, but shows which alternative has the lowest costs (with the same level of benefits).
- Multi Criteria Analysis (MCE) is a tool that, in contrast to CBA, allows the treatment of more than one criterion and does not require the monetization of all the impacts. MCE results in a ranking of alternatives.
The growing importance of environmental and social issues has led to the emergence of instruments such as Environmental Impact Assessment (EIA) and Social Impact Assessment (SIA). The output of these instruments could be presented separately or linked to the outcome of a CBA.
Risk reduction
According to the ISDR conceptual framework, disaster risk reduction must be placed in the broader context of sustainable development, where economic, socio-cultural, environmental and political factors/goals are to be considered. Many angles have to be studied. One can use the tools of cost benefit analysis to assess the economic and financial acceptance of risk reduction measures, but it is preferred to use to CBA in conjunction with other decision support methods, such as such as cost-efficiency or multi-criteria analysis. In figure 1 an schematic overview is given of input elements for CBA for disaster risk reduction.
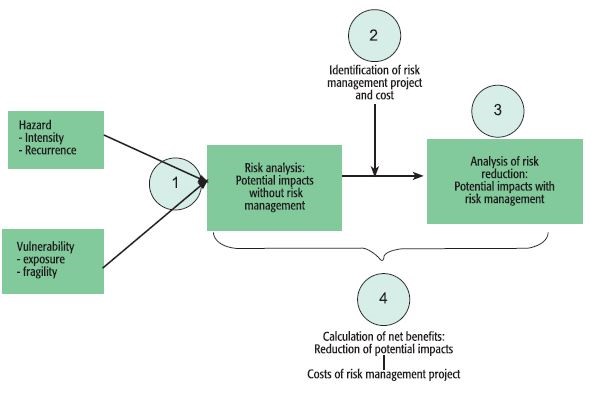
Figure 1. Schematic overview of input elements for CBA for disaster risk reduction. Source: Mechler, 2008.
In order to justify public investments in risk reduction for a certain hazard we need to assess all costs and benefits associated with this risk reduction. Besides, we need to know how large the current risk is in terms of damage per year in order to compare with other types of hazards and to compare to other societal goals.
In disaster risk management the benefits are mostly the avoided or reduced potential damages and losses. For instance in a flood control project the benefits can be reduced potential flood damages and a higher income /value of the land were the land is protected. The reduced damages can either be direct or indirect damages or monetary (tangible) or non-monetary (intangible).
The aim is to reduce the risk, thus to decrease the area under the probability-loss curve. A schematic example is given in figure 2 - see also use case 6.4 and Methodology book, chapter 5.5. Figure 2A shows the original situation with the annualized risk being the area under the red curve (the blue area). In figure 2B for a possible risk reduction measure (e.g a flood protection scheme protecting for floods up to the 100 year recurrence interval) the new risk curve is indicated as the green curve. The new risk is indicated by the blue + orange area. The risk reduction is indicated with the yellow area. As long as the yellow area is not larger than the orange area the risk is reduced. How much and how the probability loss curve is shifted depends very much on the type of risk reduction measure. In order to calculate the risk (expected annual damages) a number of points are needed on the probability-loss curve (minimum 3).
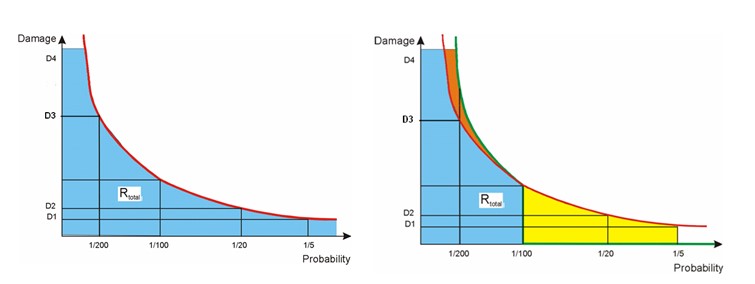
Figure 2: LEFT The amount of risk is, in the original situation, is the blue area under the red probability-damage curve. RIGHT A risk reduction option is applied: the new amount of risk is the blue area + the orange area. The yellow area is the reduction in risk due to the risk reduction measure.
Cost-benefits analysis in Disaster Risk Management
CBA for Disaster Risk Management brings additional challenges because ( after Mechler, 2005) because Natural Hazards/ Disasters are low probability events having high consequences. We need proper risk assessment. Questions are:
- How large is the current risk in terms of damage per year?
- Can we rank the different amounts of risk for the different hazards; to see which hazard causes the largest annual average damage.;
- By how much is it possible to reduce risk and how costly is it?
Planning horizons in administration are usually short, often only a few years, whereas disasters are rare events and need of a much longer planning framework to be able to assess the potential benefits of risk reduction measures. The costs for (structural) risk reducing measures are relatively less difficult to estimate but it is estimating the benefits that is the major challenge! What we need to estimate is how often natural hazard events occur (frequency) and how much damage and losses occur as a result of these events.
Types of damages
Direct damages are the result from the physical interaction of the natural phenomenon with the damageable property. The magnitude of the damage may be taken as the cost of restoration of property to its conditions before the event, or its loss in market value if restoration is not worthwhile.
Direct damages are a function of many variables that are partly related to the hazard (its intensity, the type, the impact force), and partly related to the characteristics of the property, its vulnerability to that particular hazard.
Indirect damages are caused by disruption of physical and economic linkages of the economy, for example interruption of traffic flow, loss of industrial production, loss of personal income and business profit.
There is no simple relationship between direct and indirect damages.
Another distinction can be made between tangible and intangible (or sometimes also called non-tangible) damage.
Tangible losses are damages that can be expressed in terms of monetary value; often these losses concern damaged or lost property (that have a certain replacement value), or losses related to dysfunction of production facilities with more-or-less clear economic consequences.
Intangible losses are losses where no clear monetary value can be assigned; Loss of human life is a clear example, but it also includes loss of objects (small and large) with high emotional, cultural, environmental, sentimental or religious value. Another category of intangible losses are related to emotional stress, like psychological traumas or grief. Intangible losses are difficult - if not impossible - to quantify and their impact varies from person to person.
To be included in a Cost-Benefit Analysis framework, intangible costs have to be expressed in monetary terms (Meyer et al , 2013). If this seems inappropriate or unethical (what is the value of a human life?) other decision support frameworks such as Multi-criteria Analysis or Cost-Effectiveness Analysis can used because these can also include non-monetary decision criteria. Table 1 gives some examples of direct-indirect and tangible and intangible damages. Disaster risk reduction is about reducing these types of consequences of disaster; any reduction of these losses can therefore be seen as the benefits of risk reduction efforts.
Table1. Quantifiable Damages/ disaster impacts After Mechler,2005.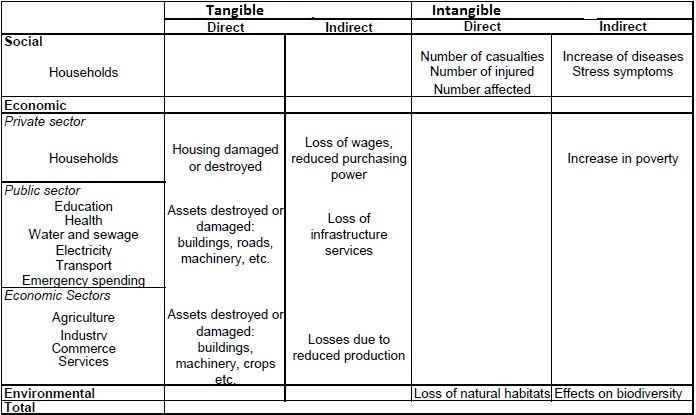
According to Mechler (2005) there are two main categories of impact on the environment, namely impacts on the environment as provider of assets that can be used. Examples are water, with multiple uses for drinking and irrigation and soil for agricultural crop production. These impacts can be valued in an economic evaluation. The other category relates to the environment as non-use values Intangible effects are on loss of natural habitats and indirect effects on bio-diversity.
Tabel 2 shows another overview of quantifiable damage costs including and risk mitigation cost.
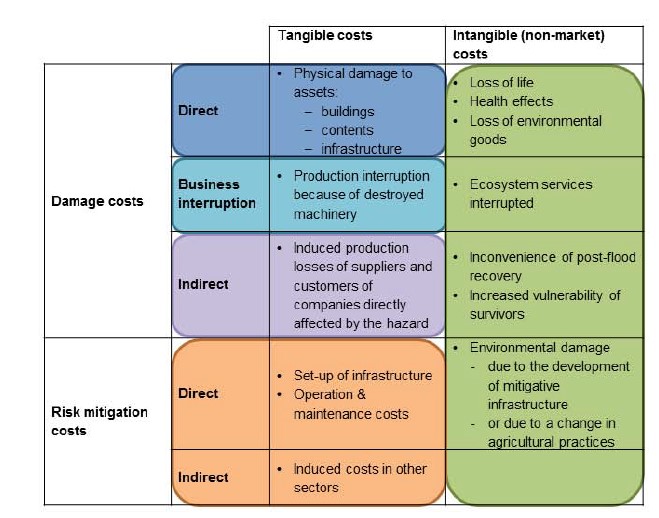
Table 2. Cost categorization in Meyer et al. (adapted from and extended based on Penning-Rowsell et al., 2003; Smith and Ward, 1998).
Methods for assessment of damages:
Risk reduction can be costly and therefore governments and financiers have to carefully consider how much they are willing to invest in it (Wagemakers et al) . But whose costs and benefits are we interested in? The decision maker must carefully consider what damage to include in the decision. Is the decision maker interested in the macro-economic effects, the losses in production or in the human suffering accompanied with a flood? (Wagemaker et al ).
Economic valuation techniques for flood hazard based on Ruijgrok et al., 2004 in Wagemaker, Leenders and Huizinga :
Control costs - Damage cost avoided. The economic value of flood damage is estimated by the cost of measures to prevent flooding;
Averting behaviour method. The economic value of flood damage is estimated by the cost to avoid actual damage and unwanted effects;
Replacement costs. The economic value of flood damage is estimated by the costs to repair or compensate for flood damage;
Productivity costs. The economic value of flood damage is estimated by the costs of the loss of production of commercially marketed goods;
Conditional valuation method. The economic value of flood damage is estimated by creating a hypothetical market in which people are enabled to price flood damage
Estimation of direct economic impacts ( after Mechler, 2005):
Estimation of direct economic impacts can be done by loss assessment conducted by local, regional and national governments, industry and commercial firms, disaster management organizations etc. Also use can be made of damage data bases etc. (see previous chapters on vulnerability and elements at risk.
Methods for deriving indirect economic effects ( after Mechler, 2005):
Can be estimated after an event by:
- Conducting surveys post event: bottom-up,
- Examining statistical information on the performance of affected sectors after the event in top-down manner,
- Deriving simple relationships e.g by Parker et al 1987 between Indirect loss and Daily Gross Profit an Days interrupted business
(see further pp24-26: http://www.mekonginfo.org/assets/midocs/0003131-environment-cost-benefit-analysis-of-natural-disaster-risk-management-in-developing-countries-manual.pdf ) Mechler, 2005.
Methods for monetizing intangible losses.
Goods and services that are not traded in a market have generally no monetary value, this holds for many environmental and social losses caused by the occurrence of natural disasters. In the field of environmental economics several methods are developed, see figure 3.
Figure 3. Methods for monetarising benefits . Source : Mechler, 2005
(see further pp26-27: http://www.mekonginfo.org/assets/midocs/0003131-environment-cost-benefit-analysis-of-natural-disaster-risk-management-in-developing-countries-manual.pdf ) , Mechler, 2005.
6.3.3 Cost Benefit Analysis as a tool for decision making.
Cost-Benefit Analysis (CBA) is a tool used in public decision-making and consists of a set of procedures for defining and comparing benefits and costs. The tool assists in identifying, measuring and valuing in monetary terms the benefits and costs of a project.
Resources such as capital, land, labour and management capacity are relatively scarce and can be allocated by a nation / agency/ person to different uses. What choice is made depends among others on the benefits that the specific allocation creates as compared to the costs of the project; you want to know whether a “project “is worthwhile and whether it is the best alternative.
Public agencies and development organisations will be particularly concerned with the question of whether a proposed project is a good investment in terms of its contribution to the welfare of society. CBA is an instrument that will assist in answering this question
CBA as applied in public decision-making typically takes the perspective of the society and is often referred to as the economic analysis or the economic CBA. This analysis is often complemented by a financial analysis of the project. The financial analysis compares the costs and benefits from the perspective of the project organisation or a specific target group (see text box 1 below). If the CBA is extended to include aspects of income distribution, one speaks of social CBA.
Uncertainty, assumptions and sensitivity analysis:
In this step the elements that are most uncertain or risky are identified and the the assumptions made during the analysis are indicated. Sensitivity analysis is applied to relevant parameters in order to obtain an indication of the robustness of the assumptions made. These parameters could include costs, benefits, prices and the timing of costs and benefits; Calculate the switching values on the most relevant parameters.
Final recommendations
Formulate a final recommendation based on the results of the economic and financial CBA.
An unambiguous conclusion on the profitability of a project is formulated if the economic and financial CBA have the same result (e.g. economic and financial NPV are both positive or both negative).
If a project is economically unfeasible but financially sound, the project should not be supported on economic grounds but might be attractive for the private sector to implement.
If the project is economically sound but financially unfeasible, a solution might have to be recommended for the weak financial basis that might prove a risk to the sustainability of the project.
Structure the recommendation within a context by making special reference to the effects that could not be monetised, to the assumptions, and to the uncertainty and gaps in knowledge.
Cost-Benefit Analysis and Inflation
Net present value calculations provide a valuable theoretical approach for handling financial and economic analyses. One practical issue that often raises questions concerns the treatment of inflation in cost-benefit analyses. Inflation refers to a general increase in prices throughout the economy. Inflation should be separated from and not be confounded with the time value of money. Common practice in cost-benefit analysis is to express all cash flows in constant or real prices as if there is zero inflation. This is valid as long as it is reasonable to assume that prices of all inputs and outputs change in a same degree. Moreover, setting up the cash flow in nominal prices (rather than constant or real prices) requires an inflation forecast, which is a difficult if not impossible task. There are no economic tools that allow us to forecast inflation as far into the future as required for the life of a typical project. Therefore it is preferable to use constant or real prices for cash flows in financial and economic CBA. This implies that a real interest or discount rate (I.e. corrected for inflation) has to be applied.
Limitations:
It is preferred to use to CBA in conjunction with other decision support methods, such as such as cost-efficiency or multi-criteria analysis . This is because CBA has its limitations e.g. the "distributional issue" that CBA does not address the distribution of benefits and costs. Societal welfare is maximized by simply aggregating individual welfare over all people affected and changes therein due to projects and policies. A focus on maximizing welfare, rather than optimizing its distribution is a consequence (Dasgupta and Pearce, 1978 in Mechler, 2008) . Other limitations are the difficulty of accounting for non-market values. The use of high discount rates expresses a strong preference for the present over future generations. (Mechler, 2005) .
Further reading:
Mechler R, (2005) Cost-benefit Analysis of Natural Disaster Risk Management in Developing countries. Manual. http://www.mekonginfo.org/assets/midocs/0003131-environment-cost-benefit ...)
Mechler, R (2008) , (IIASA) & The Risk to Resilience Study Team; 10/2008. From Risk to Resilience: Working paper 1:The Cost_Benefit Analysis Methodology
http://www.preventionweb.net/publications/view/8088
Messner, F. (2007) Evaluating flood damages: guidance and recommendations on principles and methods. Centre of Environmental Research, a member of Dresden Flood Research Center. FLOODsite
http://www.floodsite.net/html/partner_area/project_docs/t09_06_01_flood_...
Benson, C. and J. Twigg (2004). 'Measuring mitigation': Methodologies for Assessing Natural Hazard Risks and the Net benefits of Mitigation - A Scoping Study. Dasgupta, A. K. and D.W. Pearce (1978). Cost-Benefit Analysis: Theory and Practice. London, Macmillan.
Dopheide, E , (2003) Chapter 8 Cost Benefit Analysis in Groenendijk (2003) Planning and management tools. ITC publication
Mechler R, (2005) Cost-benefit Analysis of Natural Disaster Risk Management in Developing countries. Manual. Deutsche Gesellschaft für Zusammenarbeit (GTZ) GmbH http://www.mekonginfo.org/assets/midocs/0003131-environment-cost-benefit ...)
Mechler, R (2008) , (IIASA) & The Risk to Resilience Study Team; 10/2008. From Risk to Resilience: Working paper 1:The Cost_Benefit Analysis Methodology
http://www.preventionweb.net/publications/view/8088
Meyer V, Becker N, Markantonis V., Schwarze Rvan den Bergh J. C. J. M., Bouwer L. M. , Bubeck P., Ciavola P. ,Genovese E, Green C., Hallegatte S., Kreibich H., Lequeux Q., Logar I., Papyrakis E. , Pfurtscheller C. , Poussin J., Przyluski V., Thieken A.H. , and Viavattene C. ( 2013) . Review article :Assessing the costs of natural hazards – state of the art and knowledge gaps. Nat. Hazards Earth Syst. Sci., 13, 1351–1373, 2013
Penning-Rowsell, E., Johnson, C., Tunstall, S., Tapsell, S., Morris, J., Chatterton, J., Coker, A., and Green, C.: The benefits of flood and coastal defence: techniques and data for 2003, Enfield, Flood Hazard Research Centre, 2003.
Smith, K. and Ward, R.(1998) : Floods: Physical processes and human impacts,
John Wiley & Sons, Chichester, UK.
Wagemaker J. ,Leenders J. and Huizinga J. (2008) Economic Valuation of Flood Damage For Decision Makers In The Netherlands and the Lower Mekong River Basin. 6th Annual Mekong Flood Forum, 2008
http://www.tnmckc.org/upload/document/fmmp/6/6.6/Approved%20papers%20and...
Westen, van C.J. , Alkema D, Damen M.C.J. , Kerle N, Kingma N.C. Multi Hazard Risk Assessment . Distance Education Guide book 2010.